. 2014 Jul 29:8:83.
doi: 10.3389/fncir.2014.00083. eCollection 2014.

Inhibitory projections from the ventral nucleus of the trapezoid body to the medial nucleus of the trapezoid body in the mouse

Affiliations

Inhibitory projections from the ventral nucleus of the trapezoid body to the medial nucleus of the trapezoid body in the mouse

Otto Albrecht et al. Front Neural Circuits. .

Abstract

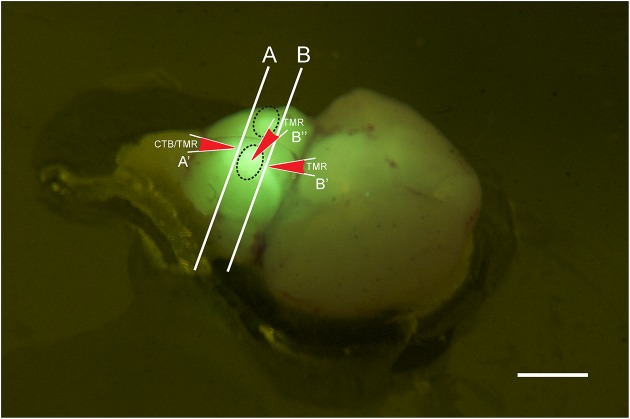
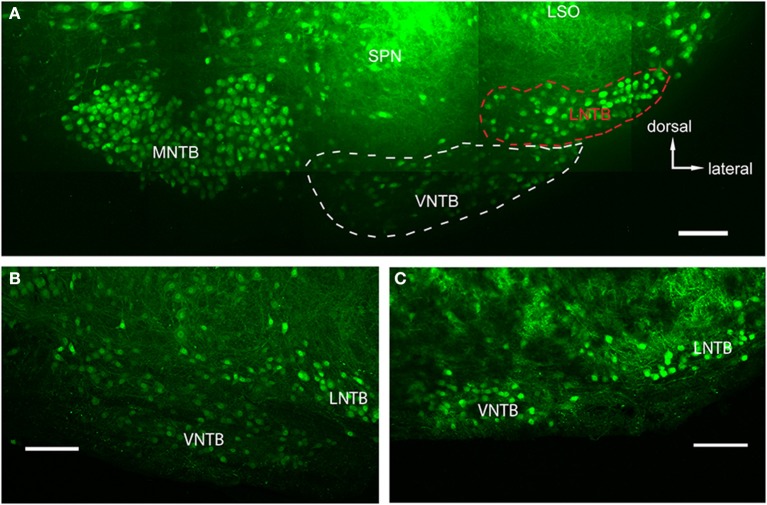
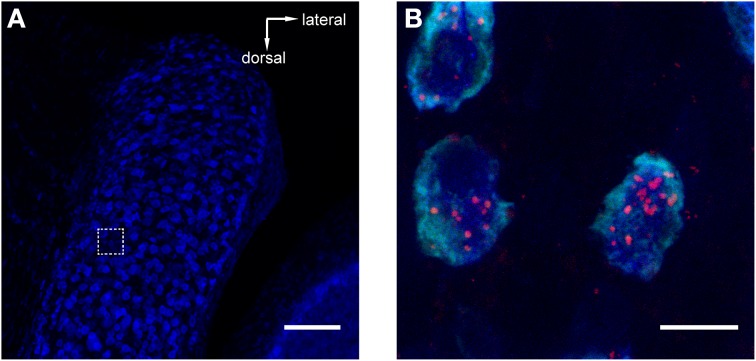
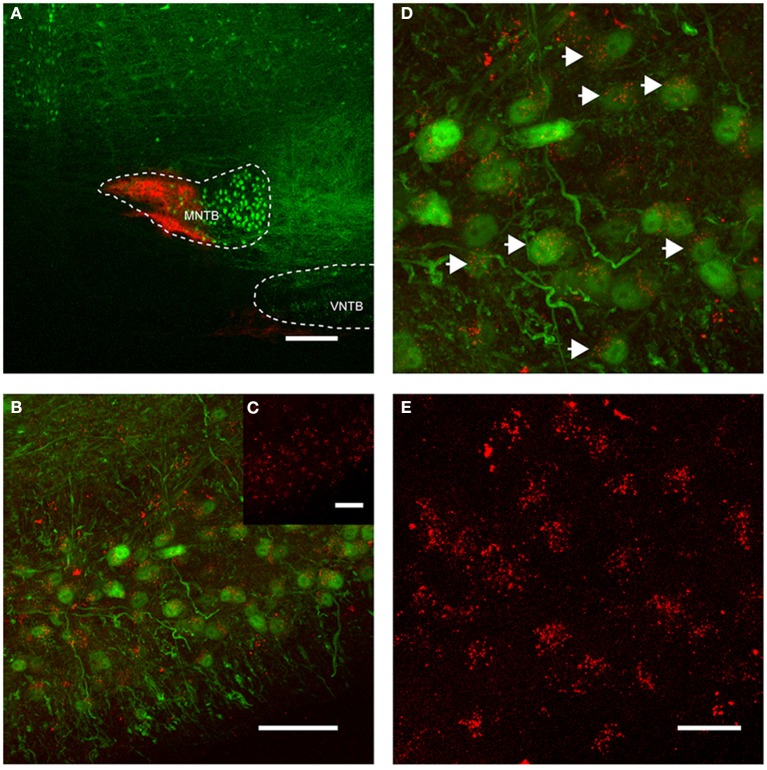
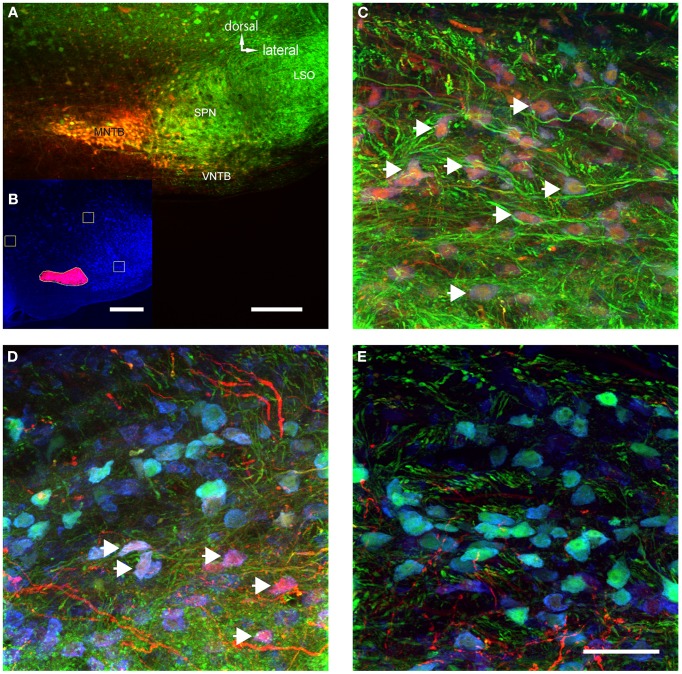
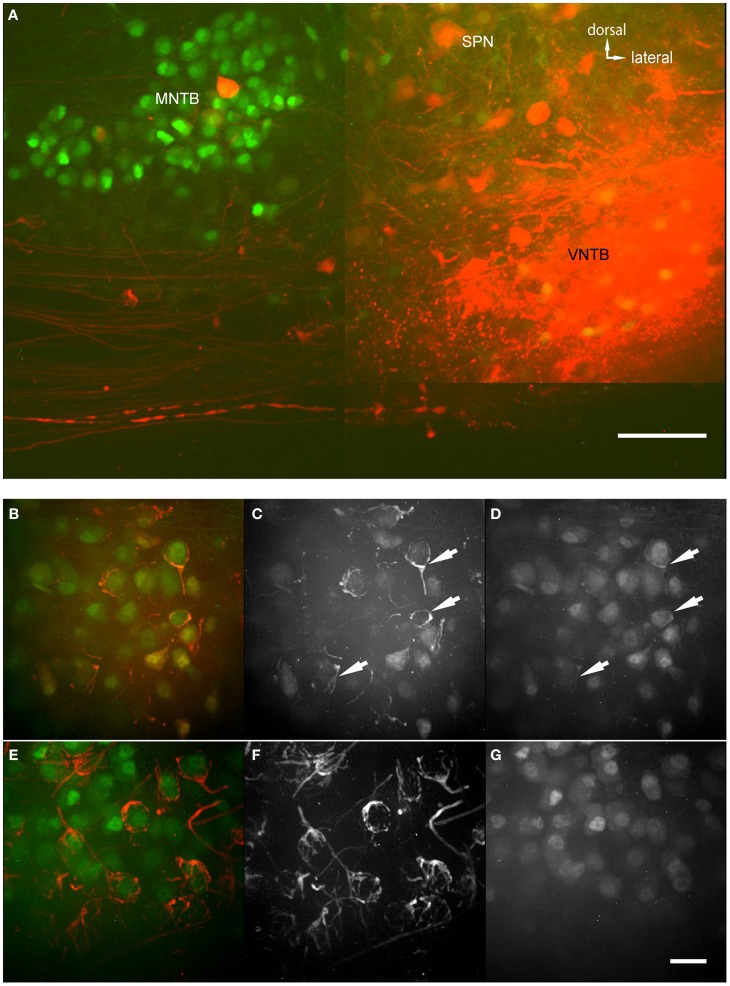
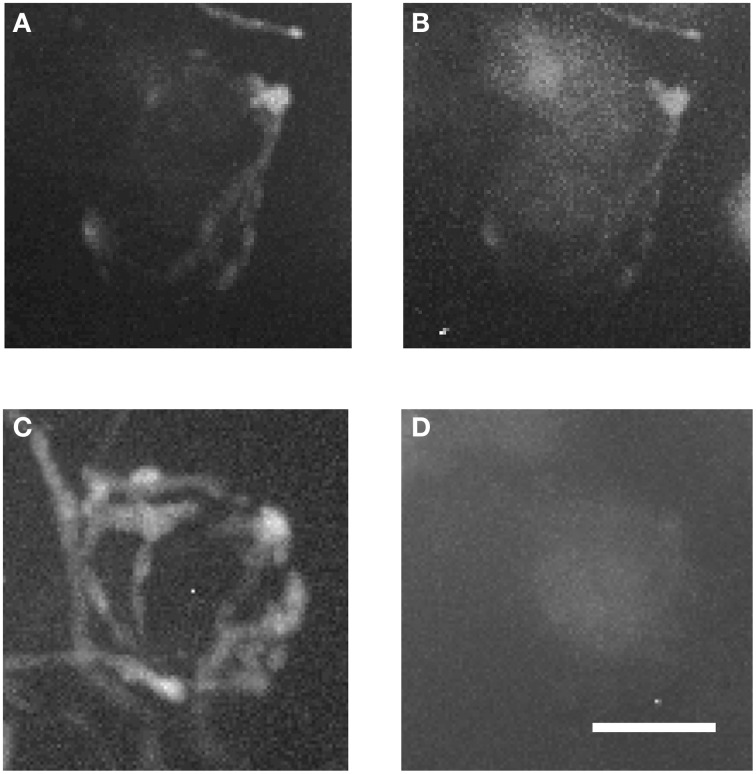
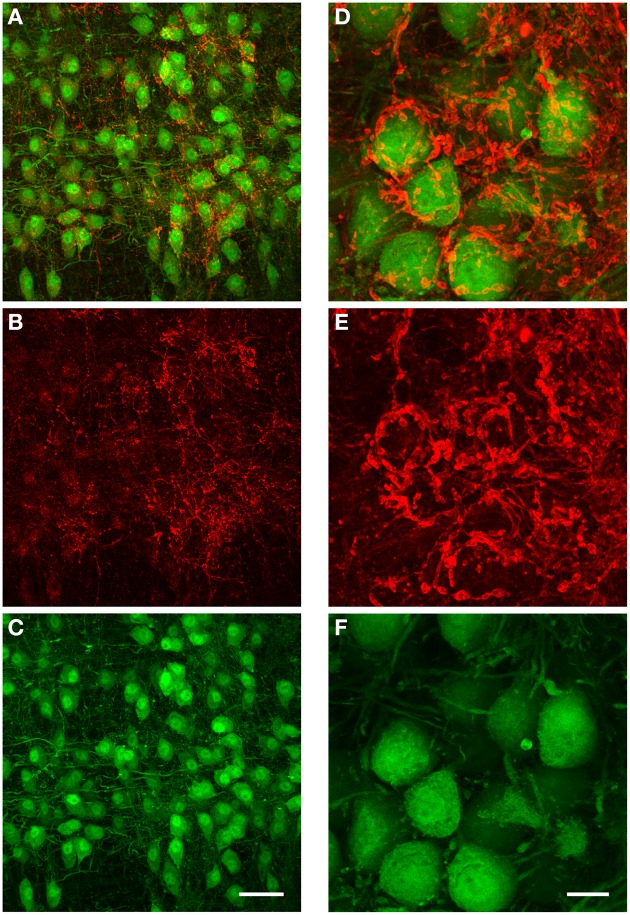
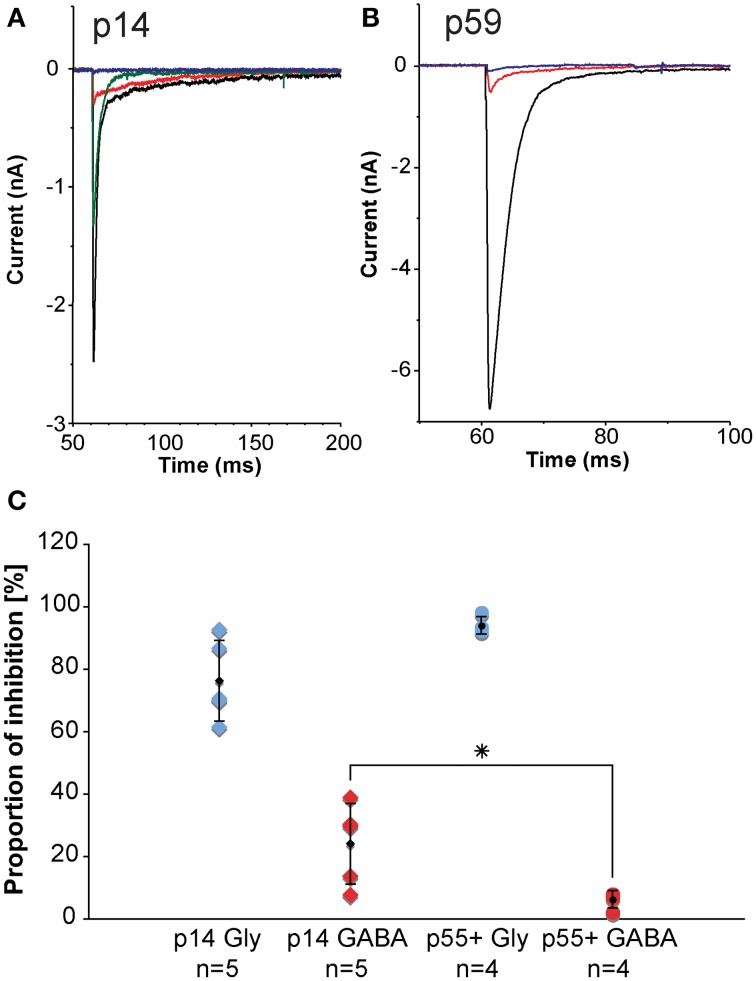
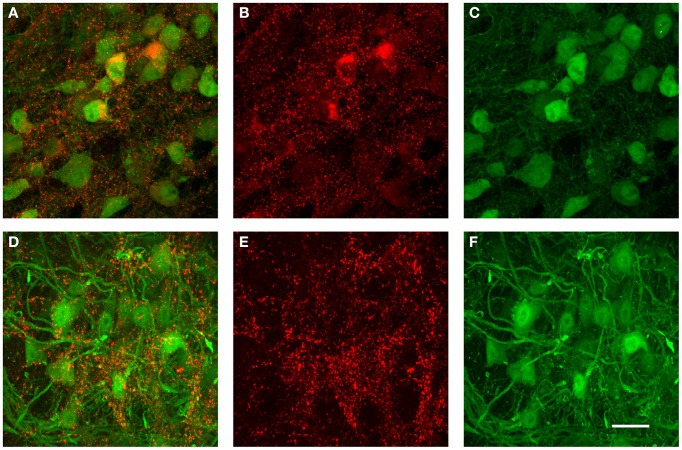
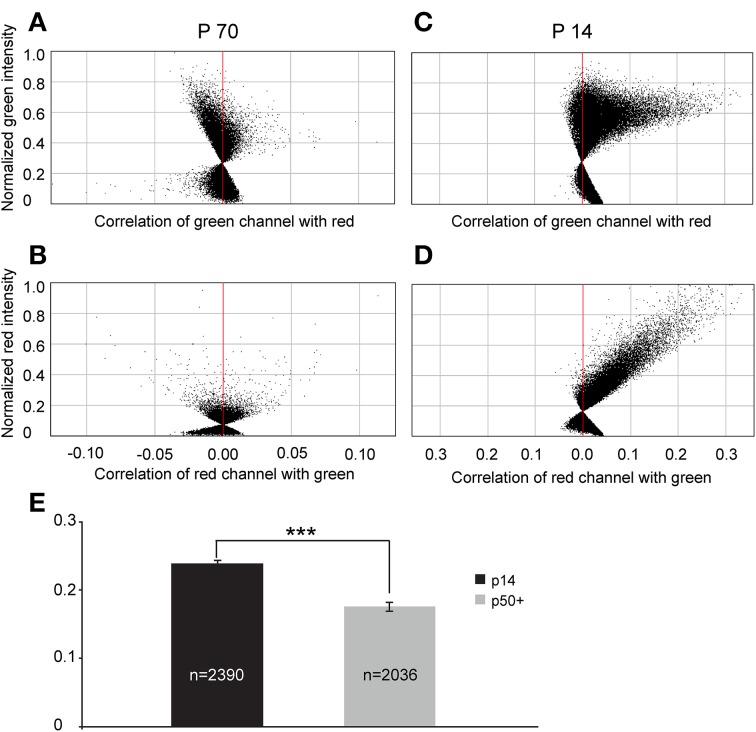
Neurons in the medial nucleus of the trapezoid body (MNTB) receive prominent excitatory input through the calyx of Held, a giant synapse that produces large and fast excitatory currents. MNTB neurons also receive inhibitory glycinergic inputs that are also large and fast, and match the calyceal excitation in terms of synaptic strength. GABAergic inputs provide additional inhibition to MNTB neurons. Inhibitory inputs to MNTB modify spiking of MNTB neurons both in-vitro and in-vivo, underscoring their importance. Surprisingly, the origin of the inhibitory inputs to MNTB has not been shown conclusively. We performed retrograde tracing, anterograde tracing, immunohistochemical experiments, and electrophysiological recordings to address this question. The results support the ventral nucleus of the trapezoid body (VNTB) as at least one major source of glycinergic input to MNTB. VNTB fibers enter the ipsilateral MNTB, travel along MNTB principal neurons and produce several bouton-like presynaptic terminals. Further, the contribution of GABA to the total inhibition declines during development, resulting in only a very minor fraction of GABAergic inhibition in adulthood, which is matched in time by a reduction in expression of a GABA synthetic enzyme in VNTB principal neurons.

Keywords: MNTB; VNTB; auditory; calyx of held; glycinergic; inhibition; trapezoid body.


Figures

Figure 1
Figure 1
Photo of a brain stem explant of a young (p2) GlyT2-GFP mouse showing the ”bulbs” on the ventral surface of the explant (dashed oval lines). The image was taken through a yellow filter while the brain explant was illuminated with a 405 nm laser. With this type of lighting, the bulbs light up brightly and can easily be distinguished, presumably because they contain the VNTB with GFP positive neurons close to the brain surface, and presumably because other major sources of GlyT2-GFP label, such as the MNTB, are located close by. The locations of the two different coronal cutting planes for retrograde and anterograde injections are shown by lines A and B, respectively, and the injection sites and their directionality are depicted by the red arrows A', B', and B.” Scale bar: 1 mm.
Figure 2
Figure 2
Glycinergic auditory nuclei in a brainstem of a p14 GlyT2-GFP mouse. (A) Maximum projection of 10 tiled confocal stacks through a 200 μm brain section cleared prior to imaging using the ClearT2-protocol. Five major nuclei with glycine label can be seen: the medial nucleus of the trapezoid body (MNTB), the ventral and lateral nuclei of the trapezoid body (VNTB and LNTB, outlined with white and red dashed lines, respectively), the SPN, and the ventral, high-frequency region of the lateral superior olive (LSO). (B,C) Closeup of the VNTB/LNTB area, showing the anatomical features used to discriminate between the VNTB and the LNTB. The image in (B) represents a more posterior location than (A) and (C) is located even more posterior than the ones in (A,B). Note the increasing gap between the two nuclei void of glycinergic cells. Scale bars: 100 μm.
Figure 3
Figure 3
Retrograde tracer injections into MNTB resulted in labeling of neurons in the antero-ventral cochlear nucleus (AVCN). Red = TMR, blue = Nissl. (A) Image of AVCN in Nissl only to highlight the globular shapes of cells in the approximate location where globular bushy cells (GCBs) are expected. The dashed square indicates the area from which the magnification in (B) was imaged. The image is a maximum projection of a 80 μm stack. (B) Maximum projection computed from a sub-stack through the mid-sections of 3 labeled GBCs (spanning a total of 9 μm). Note the punctate labeling of the cell bodies. Scale bar for (A): 100 μm, for (B): 10 μm; 4.6× digital zoom.
Figure 4
Figure 4
Retrograde labeling of MNTB resulted in labeling of glycinergic neurons in the ipsilateral VNTB. The image is from a case in which CTB was injected into the MNTB of a p88 GlyT2-GFP mouse. Glycinergic neurons expressing GFP are shown in green, the tracer is shown in red. (A) Shows the site of injection targeting mostly the medial half of the MNTB. (B) Depicts the resulting label in the ipsilateral VNTB [the inset (C) shows the red channel for this image only]. (D) Is a magnification of a portion of the image shown in (B), with (E) showing the corresponding red channel only. The white arrows in (D) highlight double-labeled neurons. Images are maximum projections of confocal stacks (image depth: 60 μm). Scale bar for (A): 200 μm, (B,C): 50 μm, for (D,E): 20 μm.
Figure 5
Figure 5
The volume of TMR-injections into MNTB correlates with the number of labeled VNTB neurons. (A) A brain stem image showing a TMR-injected (red) MNTB. (B) The result of a semi-automatic analysis of the same injection with our custom-built MATLAB algorithm, illustrating the method of quantifying the apparent extent of the tracer injection. (C) Shows a section of VNTB from a brain where the tracer injection into the ipsilateral MNTB was extensive (65% of MNTB volume). (D) represents a section of VNTB from a brain where the tracer injection into the ipsilateral MNTB was moderate (5.5% of MNTB volume). (E) Represents a section of VNTB from a brain where the tracer injection into the ipsilateral MNTB was minimal (1.5% of MNTB volume). (A,C–E) are maximum projections of confocal stacks (image depth: 80 μm), (B) is based on an epifluorescence microscopy image taken at low magnification (10×). Scale bar for (A): 200 μm, for (B): 500 μm and (C–E): 50 μm.
Figure 6
Figure 6
Anterograde injections into VNTB reveal connections to MNTB neurons. (A) Brain stem section of a case where TMR was injected into the VNTB of a p14 GlyT2-GFP mouse. The image shows the injection site within the VNTB, as well as the ipsilateral MNTB. A number of axons projects from the injection area to the ipsilateral MNTB and appears to terminate there. The image consists of a total of 4 tiled confocal stacks; the image depth of the original stack was 300 μm. Before imaging, the section was cleared using the ClearT2-protocol. (B–D) magnifications from the ipsilateral MNTB of a p14 brain that was cleared with the technique, showing a variety of labeled presynaptic elements. (B) Represents the overlay of both channels (red: TMR, green: GlyT2-GFP), (C) shows the red and (D) the green channel only. Double-labeled structures are highlighted with white arrows. (E–G) Since the majority of axons from AVCN to MNTB (innervating the calyces of Held) are passing through the injection area in the VNTB, typically some labeling of calyces of Held in the contralateral MNTB was observed as well. These were used as a control to compare to the labeled inhibitory endings in the ipsilateral MNTB. Note the structural differences between synapses labeled on the ipsilateral (B–D) and the contralateral side (E–G), and the fact that at least some of the tracer-labeled ipsilateral structures are co-labeled with GFP, while the contralateral ones are not. Scale bar for (A): 100 μm, for (B–G): 50 μm.
Figure 7
Figure 7
Two magnified MNTB principal cells and their TMR-traced inputs. (A,B) are showing a cell located ipsilaterally to the injected VNTB, (C,D) a contralateral one. Note the structural differences between the two input types and the fact that the ipsilateral terminal can be seen in the green channel (coding for GlyT2-GFP). Scale bar: 25 μm.
Figure 8
Figure 8
Immunohistochemical labeling against GlyT2 protein reveals complex inhibitory synaptic structures surrounding MNTB principal neurons. All images are maximum projections of a confocal stack [image depth for (A–C): 40 μm, for (D–F): 20 μm]. The overlay of both channels is displayed in (A). The antibody labeling against GlyT2 is shown in red (B) and the GFP-expression under the GlyT2-promoter in green (C). Note that many of the presynaptic terminals labeled by the GlyT2 antibody are highly complex in their structure, and similar to the inhibitory synaptic inputs labeled with the anterograde TMR-injections into the ipsilateral VNTB shown in Figures 6B–D. (D–F): Higher magnification image (3× digital zoom) taken in the MNTB of a different GlyT2-GFP mouse. Scale bar for (A–C): 50 μm, for (D–F): 10 μm. The age of the animal was p59.
Figure 9
Figure 9
In-vitro electrophysiology in the mouse reveals that the GABAergic contribution to the total inhibition at MNTB principal neurons declines with age. (A,B) are representative examples of pharmacologically isolated inhibitory currents observed in a p14 (A) and a p59 (B) mouse and measured while inhibitory synapses were electrically stimulated in the vicinity of the MNTB principal neuron. The black trace is the total inhibitory current following electrical stimulation, the red trace shows the residual GABAergic current after blocking the glycine component with strychnine, the blue trace is the complete block after an additional wash-in of SR-95531 (gabazine). The green trace shows a partial recovery after a successful washout of both drugs. (C) Normalized current amplitudes for glycine currents suggest a developmental decline of the GABAergic contribution to the total inhibition. Blue diamonds: normalized glycinergic currents measured from p14 animals; blue dots: normalized glycinergic currents measured from p55+ animals; red diamonds: normalized GABA currents measured from p14 animals; red dots: normalized GABA currents measured from for p55+ animals; black symbols: averages with error bars (SD). The GABA component declines significantly with age from almost 25% of total inhibitory current at postnatal day 14 down to about 6% in adult animals, whereas the glycine component does not experience statistically significant changes. All excitatory currents were blocked during these experiments with the glutamate receptor blockers DNQX and AP-V. All recordings were done near physiological temperature (35–37°C), which significantly speeds up channel kinetics (Leao et al., 2005). *The p-value is 0.032 (t-test).
Figure 10
Figure 10
Examples of immunohistochemical label against GAD67 in the VNTB of GlyT2-GFP mice. (A–C) show a representative anti-GAD67 labeling pattern in the VNTB of a p14 mouse, with (A) being the overlay of both channels, (B) the antibody labeling in red and (C) the GlyT2-GFP expression in green. Images shown in (D–F) show the same labeling in an adult animal aged p70 (color coding is the same as in (A–C)]. Note that at p14, many glycinergic neurons are co-labeled with GAD67, while almost none of the glycinergic neurons seen at the older age are co-labeled against GAD67. All images are maximum projections of confocal stacks. Scale bar: 20 μm.
Figure 11
Figure 11
Intrasomatic labeling against GAD67 in glycinergic VNTB neurons declines with age. (A–D) show pixel data from two single glycinergic VNTB neurons. Single glycinergic VNTB neurons were selected in a region of interest and analyzed for co-localization of signals in both channels. (A,B) display the normalized intensity correlation values of pixels in a p70 animal for the green and the red channel, respectively. Most of the values do not exceed the intensity correlation quotient (ICQ) range of −0.05 to 0.05 and are mostly distributed around the midline, indicating a largely uncorrelated or random distribution of overlapping green and red pixels (the resulting total ICQ was −0.001 in this case). By contrast, (C,D) show a strongly positive correlation of signals in the green and the red channels, respectively (with a resulting total ICQ value of 0.38 for this specific neuron). (E) Averaged total ICQ values for 2390 glycinergic VNTB neurons in p14 animals (black) and 2036 glycinergic VNTB neurons in p50+ (p59–70; gray) animals, respectively. ***p < 0.001 (Mann-Whitney rank-sum test).

References

    1. Awatramani G., Turecek R., Trussell L. (2004). Inhibitory control at a synaptic relay. J. Neurosci. 24, 2643–2647 10.1523/JNEUROSCI.5144-03.2004 - DOI - PMC - PubMed
    1. Awatramani G., Turecek R., Trussell L. (2005). Staggered development of GABAergic and glycinergic transmission in the MNTB. J. Neurophysiol. 93, 819–828 10.1152/jn.00798.2004 - DOI - PubMed
    1. Banks M., Smith P. (1992). Intracellular recordings from neurobiotinlabeled cells in brain slices of the rat medial nucleus of the trapezoid body. J. Neurosci. 12, 2819–2837 - PMC - PubMed
    1. Borst J. G. G., van Hoeve J. S. (2012). The calyx of Held synapse: From model synapse to auditory relay. Annu. Rev. Physiol. 74, 199–224 10.1146/annurev-physiol-020911-153236 - DOI - PubMed
    1. Brown J. C., Howlett B. (1972). The olivo-cochlear tract in the rat and its bearing on the homologies of some constituent cell groups of the mammalian superior olivary complex: a thiocholine study. Acta Anat. (Basel) 83, 505–526 10.1159/000143889 - DOI - PubMed

Publication types

MeSH terms

LinkOut - more resources