Review
. 2014 Jul 28:5:174.
doi: 10.3389/fphar.2014.00174. eCollection 2014.

Implementation of pharmacokinetic and pharmacodynamic strategies in early research phases of drug discovery and development at Novartis Institute of Biomedical Research

Affiliations
Review

Implementation of pharmacokinetic and pharmacodynamic strategies in early research phases of drug discovery and development at Novartis Institute of Biomedical Research

Tove Tuntland et al. Front Pharmacol. .

Abstract

Characterizing the relationship between the pharmacokinetics (PK, concentration vs. time) and pharmacodynamics (PD, effect vs. time) is an important tool in the discovery and development of new drugs in the pharmaceutical industry. The purpose of this publication is to serve as a guide for drug discovery scientists toward optimal design and conduct of PK/PD studies in the research phase. This review is a result of the collaborative efforts of DMPK scientists from various Metabolism and Pharmacokinetic (MAP) departments of the global organization Novartis Institute of Biomedical Research (NIBR). We recommend that PK/PD strategies be implemented in early research phases of drug discovery projects to enable successful transition to drug development. Effective PK/PD study design, analysis, and interpretation can help scientists elucidate the relationship between PK and PD, understand the mechanism of drug action, and identify PK properties for further improvement and optimal compound design. Additionally, PK/PD modeling can help increase the translation of in vitro compound potency to the in vivo setting, reduce the number of in vivo animal studies, and improve translation of findings from preclinical species into the clinical setting. This review focuses on three important elements of successful PK/PD studies, namely partnership among key scientists involved in the study execution; parameters that influence study designs; and data analysis and interpretation. Specific examples and case studies are highlighted to help demonstrate key points for consideration. The intent is to provide a broad PK/PD foundation for colleagues in the pharmaceutical industry and serve as a tool to promote appropriate discussions on early research project teams with key scientists involved in PK/PD studies.

Keywords: DMPK; Novartis; PK-PD modeling; drug discovery; pharmacodynamics; pharmacokinetics.


Figures

Figure 1
Figure 1
The iterative process of PK/PD modeling in drug discovery.
Figure 2
Figure 2
Progression from acute exploratory PK/PD studies to subchronic and chronic PK/PD studies as drug candidates are identified and profiled.
Figure 3
Figure 3
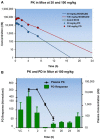
PK and PD profiles of an oncology drug candidate in a mouse xenograph model. (A) Displays the pharmacokinetic profiles of a compound following oral administration at 30 and 100 mg/kg to mice. (B) Illustrates the PK/PD results at 100 mg/kg with the drug showing return of the PD response to baseline.
Figure 4
Figure 4
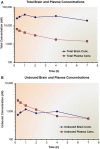
Impact of non-specific binding on the total and unbound concentrations of a drug candidate in plasma and brain. (A) Shows the total drug concentrations in brain and plasma, while (B) shows the corresponding unbound drug concentrations. Both plasma protein and brain homogenate binding studies were conducted using the Rapid Equilibrium Dialysis (RED) device.
Figure 5
Figure 5
Simulation of steady-state exposure and efficacy data of hypothetical dosing regimens in a preclinical mouse model. A drug was dosed at 30 mg/kg once daily (QD) or 3 mg/kg twice daily (BID) in a mouse xenograph model. Observed and predicted plasma levels were plotted with the simulated PD responses to aid selection of dose and dosing frequency in a follow-up efficacy study.
Figure 6
Figure 6
Dose fractionation studies to determine the pharmacokinetic driver. Impact of once daily (QD) vs. twice daily (BID) dosing regimens of the same total daily dose; both doses yield identical overall AUC0-24 h values but different Cmax concentrations over the course of the dosing regimens.
Figure 7
Figure 7
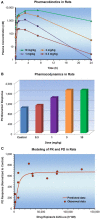
Dose dependent PK and PD observed in a rat model of diabetes. (A) Shows the PK with time, (B) shows the PD with time, and (C) plot of PK vs. PD. There was instantaneous equilibrium between exposure and effect, thus the PK/PD data were modeled using a direct Sigmoidal Emax response model.
Figure 8
Figure 8
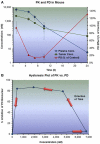
Effect vs. plasma concentration of a drug candidate following a single oral dose to tumor bearing mice. (A) Shows the PK and PD response both plotted against time. (B) Shows the PK plotted directly against PD. Delayed pharmacodynamic response resulted in a hysteris plot. An indirect response model (inhibition of input function) was subsequently developed to describe and predict PD response inhibition based upon various dosing regimens.
Figure 9
Figure 9
Total plasma and liver exposures relative to pharmacodynamics response. Rat total plasma and target tissue (liver) exposure was plotted with PD effect. A sigmoidal Emax model with baseline and Hill coefficient (γ) correction factors was used to describe the dataset. Improved in vitro-in vivo correlation was obtained when converting total plasma concentration to free plasma concentration for the estimate of in vivo EC50.
Figure 10
Figure 10
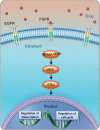
Biological cascade of BRAFV600E activation and cell cycle implications. The BRAFV600E pathway includes multiple biomarkers whose direct or indirect response could be indicative of efficacy.
Figure 11
Figure 11
Using multiple biomarkers to indicate modulation of the BRAFV600E pathway. A single oral dose was administered to tumor bearing mice. Plasma and tumor tissue were collected from the same mice to simultaneously obtain plasma PK and biomarker response of phospho-MEK and phospho-ERK in tumors.
Figure 12
Figure 12
Variability in PK and PD data. Dose-dependent suppression of biomarker response in rats following administration of a drug candidate. The error bars represent variability in both plasma AUC and biomarker response.
Figure 13
Figure 13
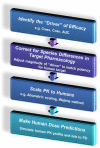
Extrapolating preclinical PK/PD data to the clinic.
Figure 14
Figure 14
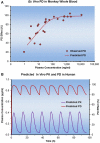
Translation of preclinical PD data to humans. (A) Illustrates the ex vivo incubation data of a drug molecule in whole blood from Cynomolgus monkey when used to determine concentration dependent changes in the desired PD effect. (B) Shows how the model fit of PD parameters from the incubations were used to predict the in vivo efficacy. Allometric scaling of PK parameters enabled simulations of plasma concentrations in humans.

References

    1. Agoram B. M., Martin S. W., van der Graaf P. H. (2007). The role of mechanism-based pharmacokinetic-pharmacodynamic (PK-PD) modeling in translational research of biologics. Drug Discov. Today 12, 1018–1024 10.1016/j.drudis.2007.10.002 - DOI - PubMed
    1. Ambrose P. G., Bhavnani S. M., Rubino C. M., Louie A., Gumbo T., Forrest A., et al. (2007). Pharmacokinetics-pharmacodynamics of antimicrobial therapy: it's not just for mice anymore. Clin. Infect. Dis. 44, 79–86 10.1086/510079 - DOI - PubMed
    1. Amore B. M., Gibbs J. P., Emery M. G. (2010). Application of in vivo animal models to characterize the pharmacokinetic and pharmacodynamic properties of drug candidates in discovery settings. Comb. Chem. High Throughput Screen. 13, 207–218 10.2174/138620710790596808 - DOI - PubMed
    1. Andes D., Craig W. A. (2002). Animal models pharmacokinetics and pharmacodynamics: a critical review. Int. J. Antimicrob. Agents 19, 261–268 10.1016/S0924-8579(02)00022-5 - DOI - PubMed
    1. Banker M. J., Clark T. H. (2008). Plasma/serum protein binding determinations. Curr. Drug Metab. 9, 854–859 10.2174/138920008786485065 - DOI - PubMed