. 2014 Jul 28:5:326.
doi: 10.3389/fimmu.2014.00326. eCollection 2014.

Ontogenic, Phenotypic, and Functional Characterization of XCR1(+) Dendritic Cells Leads to a Consistent Classification of Intestinal Dendritic Cells Based on the Expression of XCR1 and SIRPα

Affiliations

Ontogenic, Phenotypic, and Functional Characterization of XCR1(+) Dendritic Cells Leads to a Consistent Classification of Intestinal Dendritic Cells Based on the Expression of XCR1 and SIRPα

Martina Becker et al. Front Immunol. .

Abstract

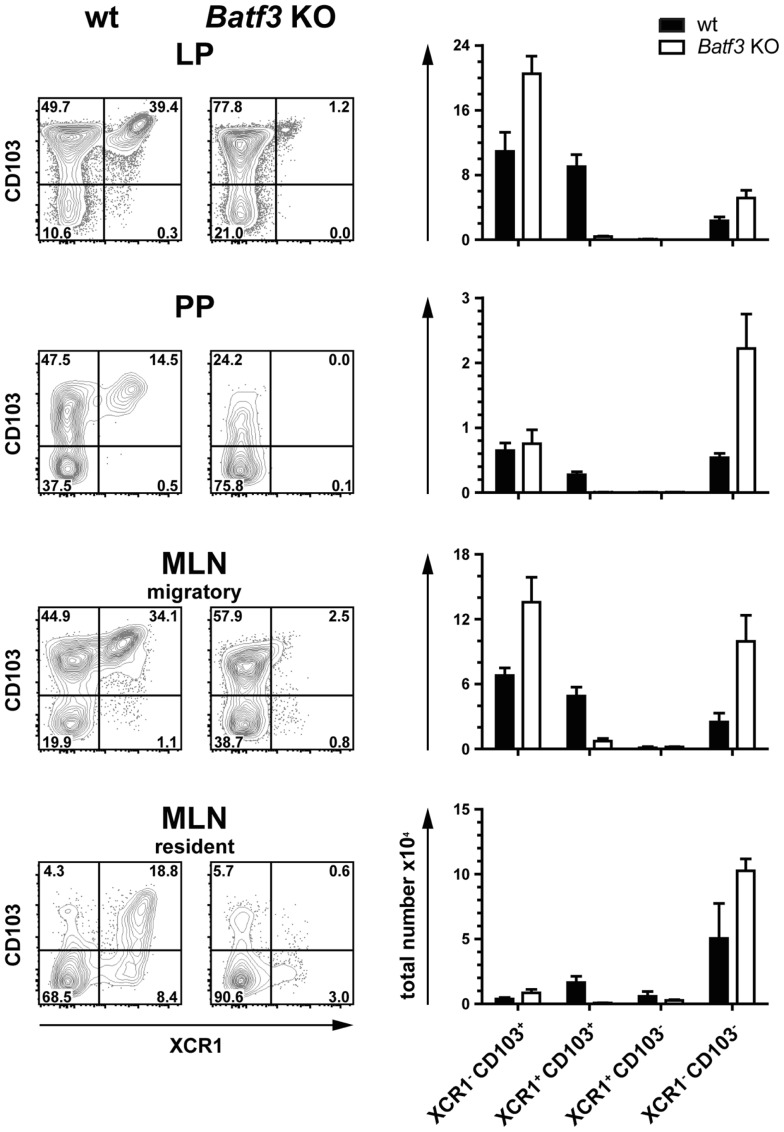
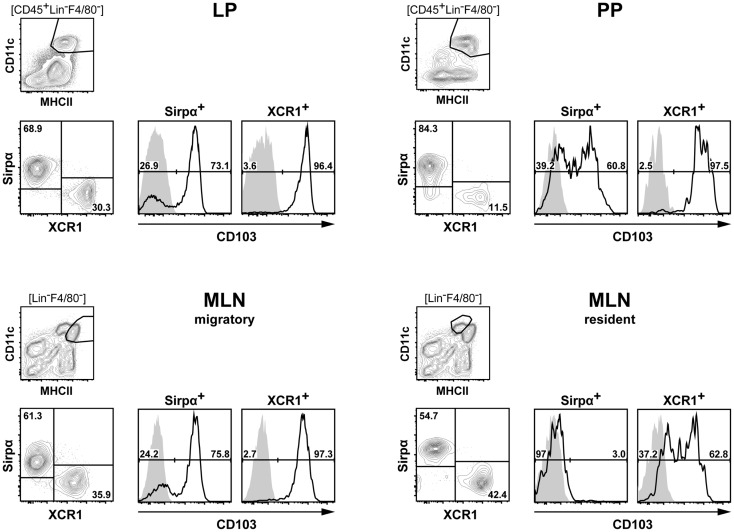
In the past, lack of lineage markers confounded the classification of dendritic cells (DC) in the intestine and impeded a full understanding of their location and function. We have recently shown that the chemokine receptor XCR1 is a lineage marker for cross-presenting DC in the spleen. Now, we provide evidence that intestinal XCR1(+) DC largely, but not fully, overlap with CD103(+) CD11b(-) DC, the hypothesized correlate of "cross-presenting DC" in the intestine, and are selectively dependent in their development on the transcription factor Batf3. XCR1(+) DC are located in the villi of the lamina propria of the small intestine, the T cell zones of Peyer's patches, and in the T cell zones and sinuses of the draining mesenteric lymph node. Functionally, we could demonstrate for the first time that XCR1(+)/CD103(+) CD11b(-) DC excel in the cross-presentation of orally applied antigen. Together, our data show that XCR1 is a lineage marker for cross-presenting DC also in the intestinal immune system. Further, extensive phenotypic analyses reveal that expression of the integrin SIRPα consistently demarcates the XCR1(-) DC population. We propose a simplified and consistent classification system for intestinal DC based on the expression of XCR1 and SIRPα.

Keywords: Batf3; SIRPα; XCR1; cross-presentation; dendritic cells.


Figures

Figure 1
Figure 1
Expression of XCR1 on DC in the lamina propria, Peyer’s patches, and mesenteric lymph nodes. DC from the LP, PP, and MLN of C57BL/6 mice were enriched by digestion and density gradient centrifugation of the tissues, stained for CD11b and CD103, and counter-stained with XCR1-specific mAb MARX10. DC from MLN were separated into resident and migratory DC based on their MHCII expression levels. For analysis, the gates were set on live CD45+ Lin F4/80 CD11c+ MHCII+ cells. Expression of XCR1 is shown on CD103+ CD11b (left upper quadrants), CD103+ CD11b+ (right upper quadrants), CD103 CD11b+ (right lower quadrants), and CD103 CD11b (left lower quadrants) DC. The background staining was determined with homozygous B6.XCR1-lacZ+/+ mice lacking XCR1 (gray). The results shown are representative of three experiments with three animals each.
Figure 2
Figure 2
Correlation of XCR1 expression with different DC surface molecules. DC from the LP, PP, and MLN of C57BL/6 wt mice, and heterozygous CX3CR1GFP or LangerinEGFP (CD207) mice were enriched by digestion and density gradient centrifugation and double-stained for detection of XCR1 and the indicated surface molecules. For analysis, the gates were set on live CD45+ Lin F4/80 CD11c+ MHCII+ cells. The results shown are representative of three experiments with three animals each.
Figure 3
Figure 3
Expansion of intestinal XCR1+ DC by the growth factor Flt3 ligand. C57BL/6 mice were exposed to Flt3 ligand for 9 days in vivo. Thereafter, DC from the LP, PP, and MLN (CD45+ Lin F4/80 CD11c+ MHCII+ cells) were analyzed for expression of CD103 and XCR1, and compared to unexposed controls (flow cytometry histograms). The bar graphs represent the fold increase in total numbers of the indicated DC subsets in relation to unexposed controls. The data shown are representative of two independent experiments (mean ± SEM; in each experimentn = 3).
Figure 4
Figure 4
Development of intestinal XCR1+ DC is dependent on the transcription factor Batf3. DC (CD45+ Lin F4/80 CD11c+ MHCII+) from LP, PP, and MLN cells of C57BL/6 wt controls and Batf3-deficient mice were stained for XCR1 and CD103 (left part of figure). Total numbers of the indicated DC subsets obtained from wt (black bars) and Batf3-deficient mice (open bars) are shown (right part of figure). The results shown are representative of two experiments (mean ± SEM; in each experiment, n = 3).
Figure 5
Figure 5
Positioning of XCR1-expressing cells in the lamina propria, Peyer’s patches, and mesenteric lymph nodes. Distribution of XCR1+ cells was determined in tissues of homozygous B6.XCR1-lacZ+/+ reporter mice using X-gal, a chromogenic substrate for β-galactosidase. (A) Lamina propria of the small intestine, (B) Peyer’s patch, and (C) mesenteric lymph node. (D) Represents a staining control using intestinal tissue from wt C57BL/6 mice containing a Peyer’s patch and adjacent portions of the small intestine. The arrows in (A,D) indicate false positive signals obtained in the epithelial crypts of the lamina propria.
Figure 6
Figure 6
XCR1-expressing cells upregulate CCR7 after inflammation in Peyer’s patches and MLN. C57BL/6 mice were injected i.p. with LPS or with PBS for control, and the expression of CCR7 and XCR1 was compared 14 h later on DC (CD45+ Lin F4/80 CD11c+ MHCII+ cells) in LP, PP, and MLN. Shown is one representative experiment out of three.
Figure 7
Figure 7
Intestinal XCR1+ migratory DC excel in cross-presentation of soluble antigen. C57BL/6 mice were fed with soluble OVA (25 mg), sacrificed 17 h later, and CD11c+ cells were enriched from MLN and LP by density gradient centrifugation and positive magnetic separation. The indicated DC subsets were flow sorted according to their expression of XCR1 and CD103 to purity (>98.5%). Titrated numbers of the respective DC subsets from MLN or LP were then co-cultured with 1 × 105 CFSE-labeled OT-I T cells, DC loaded with SIINFEKL peptide in vitro served as positive controls. Shown is the CFSE dilution profile of the OT-I T cells (CD90.1+ CD8+) after 2.5 days of co-culture with the respective DC subsets (open histograms) or OT-I T cells alone (gray histograms). The results shown are representative of three experiments with LP and MLN, and two additional experiments with MLN only (mean ± SD).
Figure 8
Figure 8
Classification of intestinal DC according to their expression of XCR1 and SIRPα. DC from the LP, PP, and MLN of C57BL/6 mice were enriched by digestion and density gradient centrifugation of the tissues, stained for XCR1 and SIRPα, DC from MLN were further separated into resident and migratory DC based on their MHCII expression levels. For analysis, the gates were set on live CD45+ Lin F4/80 CD11c+ MHCII+ cells. Expression of CD103 is shown on XCR1+ versus SIRPα+ DC. The background staining was determined with homozygous B6.XCR1-lacZ+/+ mice lacking XCR1 (gray). The results shown are representative of two experiments.

References

    1. Pabst O, Bernhardt G. The puzzle of intestinal lamina propria dendritic cells and macrophages. Eur J Immunol (2010) 40:2107–1110.1002/eji.201040557 - DOI - PubMed
    1. Milling S, Yrlid U, Cerovic V, MacPherson G. Subsets of migrating intestinal dendritic cells. Immunol Rev (2010) 234:259–6710.1111/j.0105-2896.2009.00866.x - DOI - PubMed
    1. Rescigno M. Intestinal dendritic cells. Adv Immunol (2010) 107:109–3810.1016/B978-0-12-381300-8.00004-6 - DOI - PubMed
    1. Hashimoto D, Miller J, Merad M. Dendritic cell and macrophage heterogeneity in vivo. Immunity (2011) 35:323–3510.1016/j.immuni.2011.09.007 - DOI - PMC - PubMed
    1. Mowat AM, Bain CC. Mucosal macrophages in intestinal homeostasis and inflammation. J Innate Immun (2011) 3:550–6410.1159/000329099 - DOI - PMC - PubMed