

A neural network approach to fMRI binocular visual rivalry task analysis
- PMID: 25121595
- PMCID: PMC4133376
- DOI: 10.1371/journal.pone.0105206
A neural network approach to fMRI binocular visual rivalry task analysis
Abstract
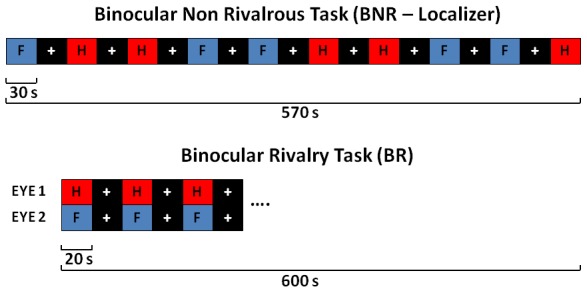
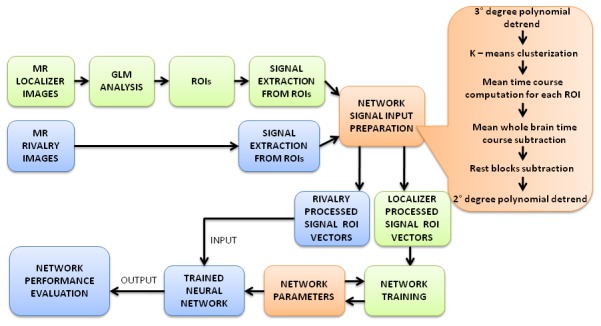
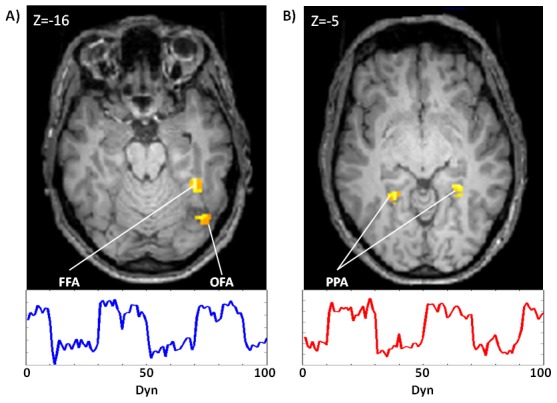
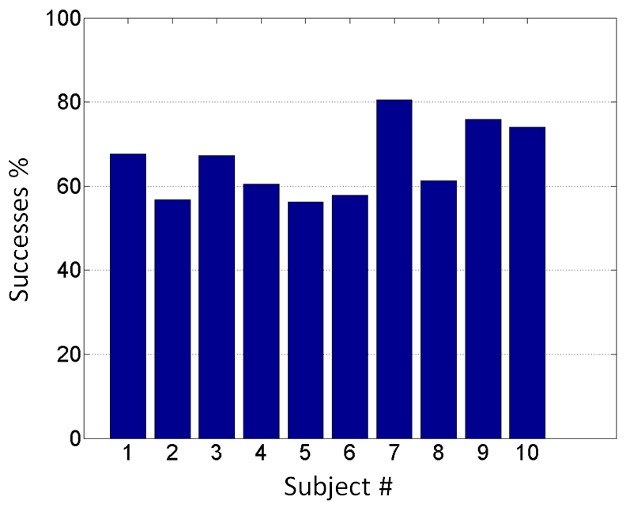
The purpose of this study was to investigate whether artificial neural networks (ANN) are able to decode participants' conscious experience perception from brain activity alone, using complex and ecological stimuli. To reach the aim we conducted pattern recognition data analysis on fMRI data acquired during the execution of a binocular visual rivalry paradigm (BR). Twelve healthy participants were submitted to fMRI during the execution of a binocular non-rivalry (BNR) and a BR paradigm in which two classes of stimuli (faces and houses) were presented. During the binocular rivalry paradigm, behavioral responses related to the switching between consciously perceived stimuli were also collected. First, we used the BNR paradigm as a functional localizer to identify the brain areas involved the processing of the stimuli. Second, we trained the ANN on the BNR fMRI data restricted to these regions of interest. Third, we applied the trained ANN to the BR data as a 'brain reading' tool to discriminate the pattern of neural activity between the two stimuli. Fourth, we verified the consistency of the ANN outputs with the collected behavioral indicators of which stimulus was consciously perceived by the participants. Our main results showed that the trained ANN was able to generalize across the two different tasks (i.e. BNR and BR) and to identify with high accuracy the cognitive state of the participants (i.e. which stimulus was consciously perceived) during the BR condition. The behavioral response, employed as control parameter, was compared with the network output and a statistically significant percentage of correspondences (p-value <0.05) were obtained for all subjects. In conclusion the present study provides a method based on multivariate pattern analysis to investigate the neural basis of visual consciousness during the BR phenomenon when behavioral indicators lack or are inconsistent, like in disorders of consciousness or sedated patients.
Conflict of interest statement
Figures
References
-
- Norman KA, Polyn SM, Detre GJ, Haxby JV (2006) Beyond mind-reading: multi-voxel pattern analysis of fMRI data. Trends Cogn Sci, 10 (9), 424–430 - PubMed
-
- Davatzikos C, Ruparel K, Fan Y, Shen DG, Acharyya M, et al. (2005) Classifying spatial patterns of brain activity with machine learning methods: application to lie detection. NeuroImage, 28 (3), 663–668 - PubMed
Publication types
MeSH terms
LinkOut - more resources
Full Text Sources
Other Literature Sources
Medical
