. 2014 Aug 14;9(8):e99519.
doi: 10.1371/journal.pone.0099519. eCollection 2014.

Metabolome analysis of Drosophila melanogaster during embryogenesis

Affiliations

Metabolome analysis of Drosophila melanogaster during embryogenesis

Phan Nguyen Thuy An et al. PLoS One. .

Abstract

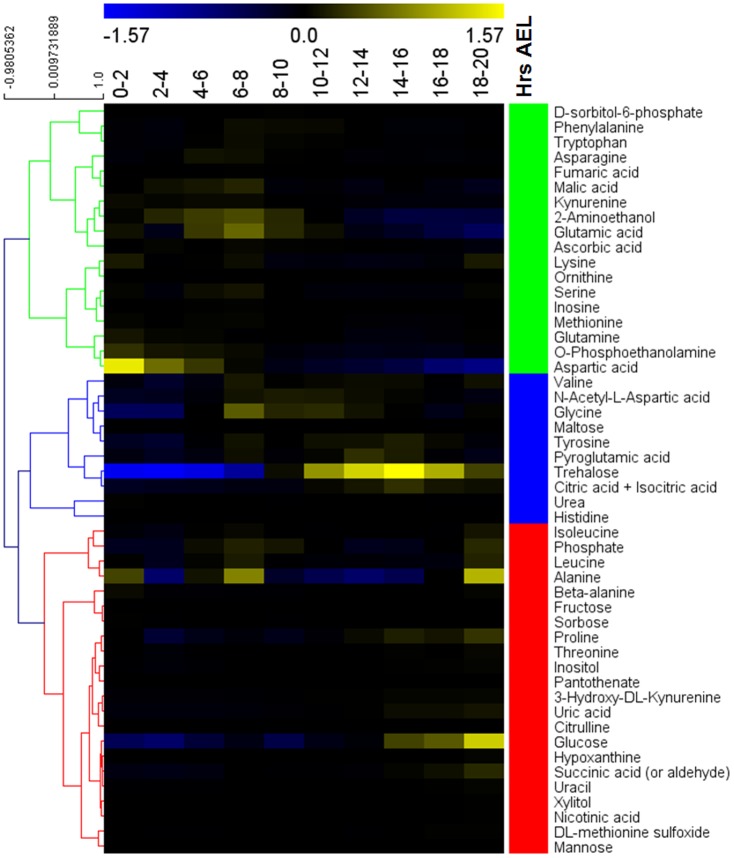
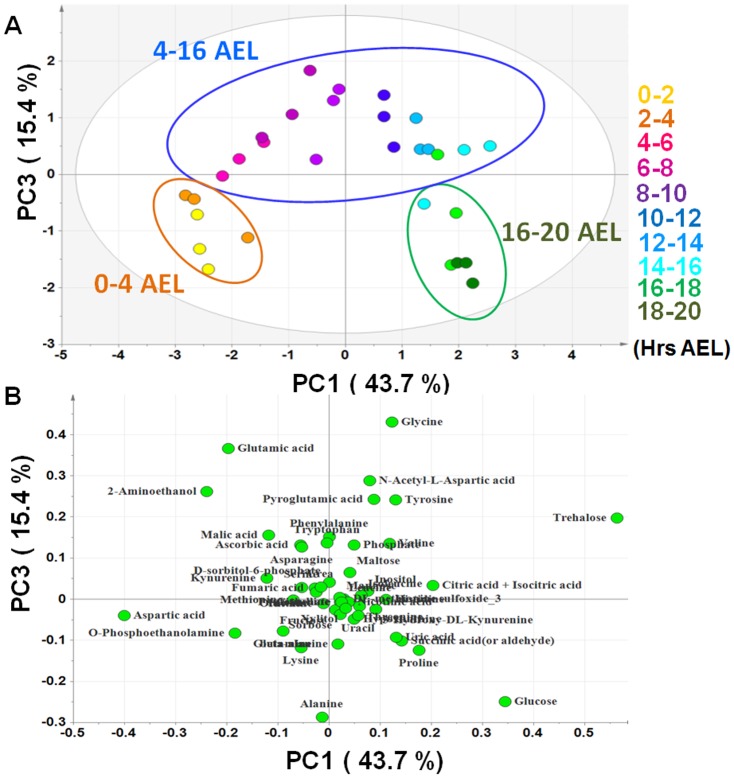
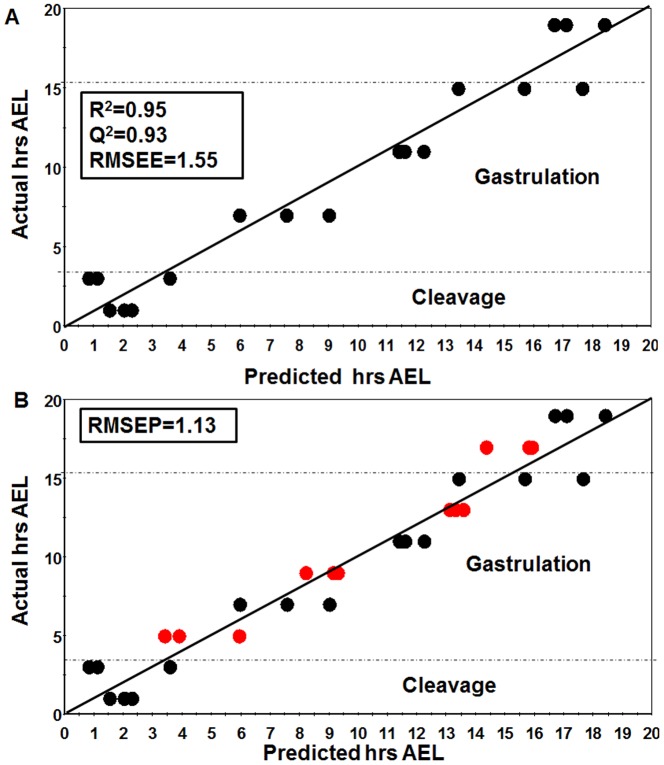
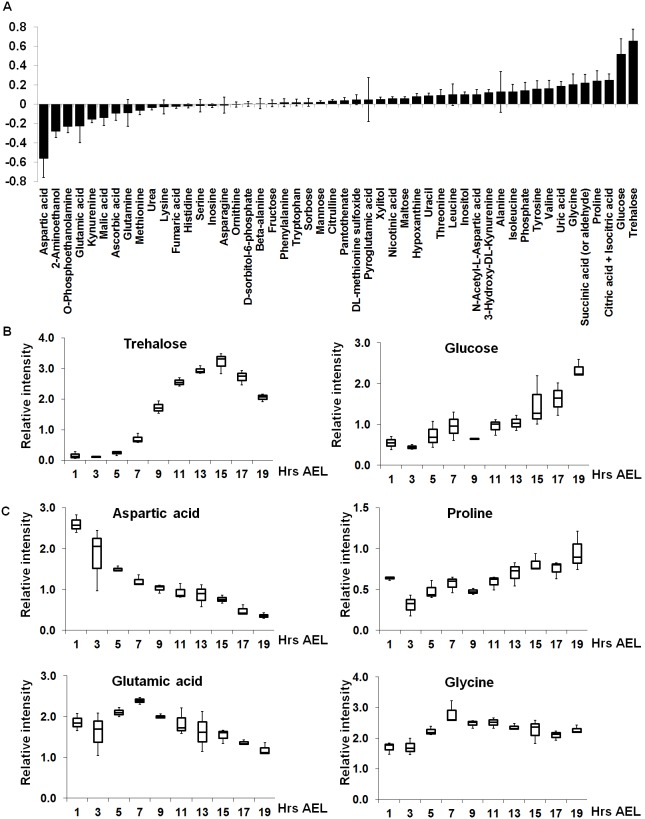
The Drosophila melanogaster embryo has been widely utilized as a model for genetics and developmental biology due to its small size, short generation time, and large brood size. Information on embryonic metabolism during developmental progression is important for further understanding the mechanisms of Drosophila embryogenesis. Therefore, the aim of this study is to assess the changes in embryos' metabolome that occur at different stages of the Drosophila embryonic development. Time course samples of Drosophila embryos were subjected to GC/MS-based metabolome analysis for profiling of low molecular weight hydrophilic metabolites, including sugars, amino acids, and organic acids. The results showed that the metabolic profiles of Drosophila embryo varied during the course of development and there was a strong correlation between the metabolome and different embryonic stages. Using the metabolome information, we were able to establish a prediction model for developmental stages of embryos starting from their high-resolution quantitative metabolite composition. Among the important metabolites revealed from our model, we suggest that different amino acids appear to play distinct roles in different developmental stages and an appropriate balance in trehalose-glucose ratio is crucial to supply the carbohydrate source for the development of Drosophila embryo.


Conflict of interest statement

Competing Interests: The authors have declared that no competing interests exist.

Figures

Figure 1
Figure 1. Heat map showing the widespread changes in metabolites during Drosophila embryogenesis.
Metabolite levels were expressed relative to the average value of that metabolite throughout the development of embryo; the ratios were plotted on a color scale (top). Metabolites were discriminated hierarchically into three clusters which are represent for early (green), middle (blue) and late stage (red) of embryogenesis.
Figure 2
Figure 2. There is a high coincidence between the composition of metabolome and actual developmental stages of Drosophila embryo.
Embryos were collected at 10 time points namely 0–2, 2–4, 4–6, 6–8, 8–10, 10–12, 12–14, 14–16, 16–18, 18–20 hrs AEL. All samples were analyzed in triplicates (n = 3). (A) PCA score plot shows 3 main clusters namely 0–4 hrs, 4–16 hrs and 16–20 hrs AEL, which is in total agreement with the developmental stages of Drosophila embryo (B) The loading plot shows the contributions of each metabolite on the discrimination in score plot according to the distance to the origin.
Figure 3
Figure 3. Partial Least Square was performed to construct a robust and accurate prediction model for Drosophila embryo developmental stages based on the metabolic data.
Among 10 time points investigated, 4 time points including 4–6, 8–10, 12–14 and 16–18 hrs AEL were selected as the test set while the rest were used as training set. PLS regression was first performed with the training set by importing all compounds to the X-matrix while the actual AEL were imported to the Y-matrix. (A) A good correlation between metabolome data and developmental stages could be achieved. R2 and Q2>0.9 indicated an excellent predictive model. (B) Cross-validation of the model using the test set was fitted onto the prediction model constructed using the training set. The root mean square error was calculated to point out how well the observed hrs AEL matched with the real hrs AEL. RMSEP was not so different from RMSEE, showing that the model was validated.
Figure 4
Figure 4. Each metabolite has distinct contributions to the development of Drosophila embryos.
(A) The regression coefficient plot shows the correlation trend of each metabolite. The negative correlation indicated the important role during early embryogenesis and vice versa. The relative intensity of metabolites that are important in sugar and amino acid metabolism are shown in (B) and (C), respectively. The peak intensity of each compound was normalized based on ribitol internal standard.

References

    1. Adams MD, Celniker SE, Holt RA, Evans CA, Gocayne JD, et al. (2000) The genome sequence of Drosophila melanogaster . Science 287: 2185–2195. - PubMed
    1. Fortini ME, Skupski MP, Boguski MS, Hariharan IK (2000) A survey of human disease gene counterparts in the Drosophila genome. J Cell Biol 150: F23–30. - PMC - PubMed
    1. Gilbert S (2000) Early Drosophila Development. Developmental Biology 6th edition.
    1. Tram U, Riggs B, Sullivan W (2001) Cleavage and Gastrulation in Drosophila Embryos. eLS: John Wiley & Sons, Ltd.
    1. Fisher B, Weiszmann R, Frise E, Hammonds A, Tomancak P, et al. (2012) BDGP insitu homepage.

Publication types

LinkOut - more resources