. 2014 Aug 14;10(8):e1004551.
doi: 10.1371/journal.pgen.1004551. eCollection 2014 Aug.

The population genetics of evolutionary rescue

Affiliations

The population genetics of evolutionary rescue

H Allen Orr et al. PLoS Genet. .

Abstract

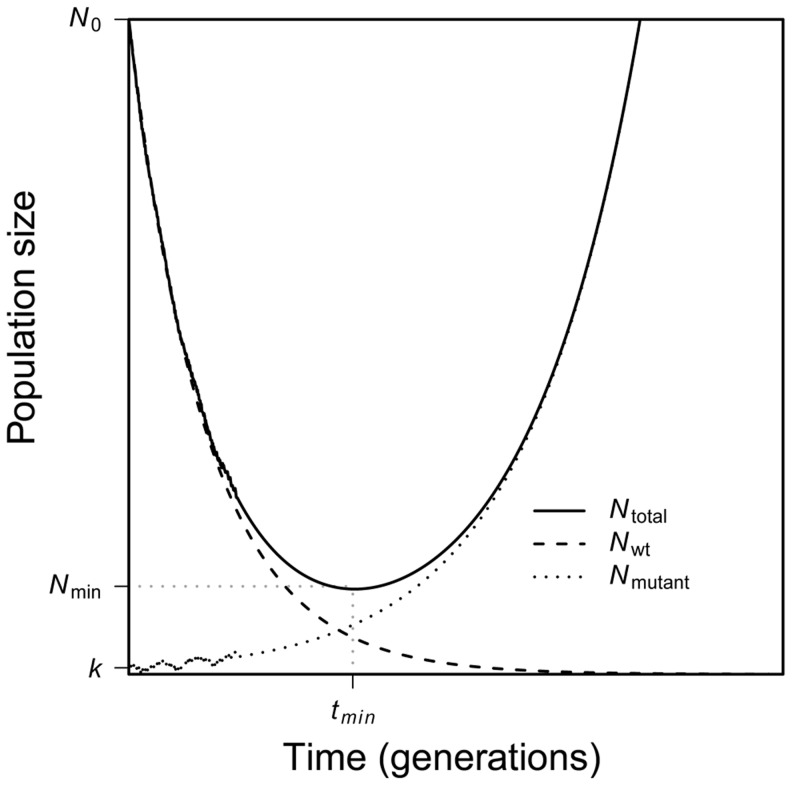
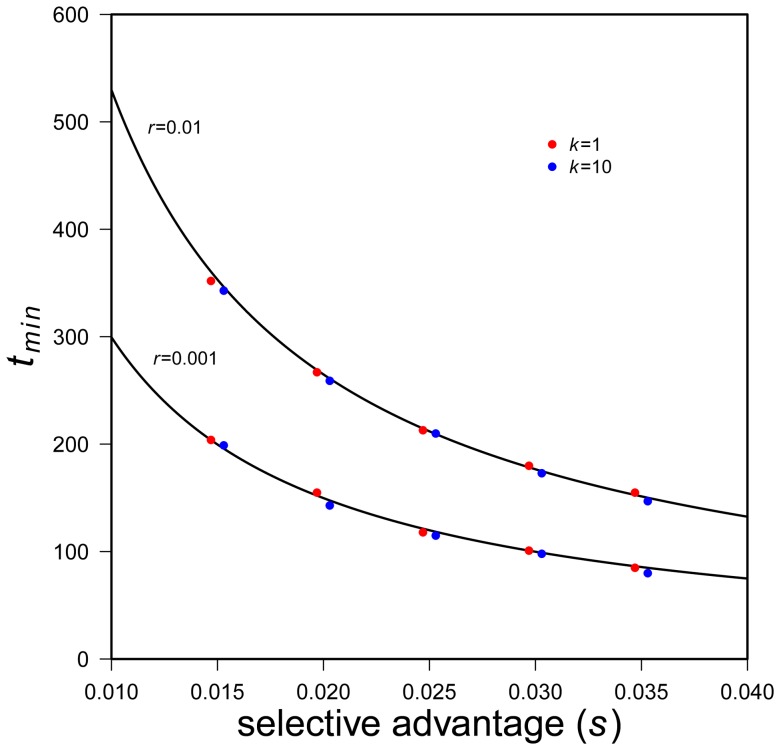
Evolutionary rescue occurs when a population that is threatened with extinction by an environmental change adapts to the change sufficiently rapidly to survive. Here we extend the mathematical theory of evolutionary rescue. In particular, we model evolutionary rescue to a sudden environmental change when adaptation involves evolution at a single locus. We consider adaptation using either new mutations or alleles from the standing genetic variation that begin rare. We obtain several results: i) the total probability of evolutionary rescue from either new mutation or standing variation; ii) the conditions under which rescue is more likely to involve a new mutation versus an allele from the standing genetic variation; iii) a mathematical description of the U-shaped curve of total population size through time, conditional on rescue; and iv) the time until the average population size begins to rebound as well as the minimal expected population size experienced by a rescued population. Our analysis requires taking into account a subtle population-genetic effect (familiar from the theory of genetic hitchhiking) that involves "oversampling" of those lucky alleles that ultimately sweep to high frequency. Our results are relevant to conservation biology, experimental microbial evolution, and medicine (e.g., the dynamics of antibiotic resistance).


Conflict of interest statement

The authors have declared that no competing interests exist.

Figures

Figure 1
Figure 1. A schematic of evolutionary rescue.
Following an environmental change, a population begins to decline as the wildtype suffers a fitness less than one. A rare mutant allele with fitness greater than one may increase in frequency, saving the population from extinction. Together, the two genotypes yield a characteristic U-shaped curve of total population size through time.
Figure 2
Figure 2. The probability that a population is saved by new mutation versus standing genetic variation.
The standing genetic variation plays a greater role in rescue when p 0 > u/r. Simulations assume N0 = 10,000, r = 0.00333, s = 0.01 and u = 10−6 with 100, 000 realizations. Red line indicates p 0 = u/r.
Figure 3
Figure 3. The U-shaped trajectory for populations rescued from standing variation.
100 randomly selected successful realizations in gray, mean of all successful realizations in black, Eq. 6 (without the oversampling correction) in blue, Eq. 10 (with the oversampling correction) in red. Ticks on X-axis represent observed (black) and predicted (red) tmin (Eq. 13) while ticks on the Y-axis represents observed (black) and predicted (red) Nmin (Eq. 14). A) N0 = 10,000, r = 0.01, s = 0.02, k = 1; B) N0 = 100,000, r = 0.01, s = 0.02, k = 1; 100,000 realizations.
Figure 4
Figure 4. The variance in population size during evolutionary rescue.
Observed variance of total population size (black), predicted from Eq. 11 (red), variance in the number of mutants (dotted blue), variance in number of wildtype (dotted green). A) N0 = 10,000, r = 0.01, s = 0.02, k = 10; B) N0 = 100,000, r = 0.005, s = 0.02, k = 3; 100;000 realizations.
Figure 5
Figure 5. Time to minimum expected population size.
Black lines are predicted tmin (Eq. 13), simulation results with k = 1 are red dots, simulation results with k = 10 are blue dots. Two values of r are used (see plot), N0 = 10,000. 5000 successful realizations for each set of parameters.
Figure 6
Figure 6. The U-shaped curve for populations rescued by new mutation.
100 randomly selected successful realizations in gray, mean of all successful realizations in black, Eq. 19 (expectation from new mutation) in red, Eq. 10 (expectation from standing variation) in blue. Ticks on X-axis represent observed (black) and predicted (red) tmin (Eq. 21) while ticks on the Y-axis represents observed (black) and predicted (red) Nmin (Eq. 22). A) N0 = 10,000, r = 0.01, s = 0.02, u = 10−5 B) N0 = 100,000, r = 0.005, s = 0.015, u = 10−6; 10,000 realizations.

References

    1. Pimm SL, Russell GJ, Gittleman JL, Brooks TM (1995) The future of biodiversity. Science 269: 347–350. - PubMed
    1. Leakey RE, Lewin R (1994) The sixth extinction: patterns of life and the future of humankind. New York: Doubleday.
    1. Tilman D, May RM, Lehman CL, Nowack MA (1994) Habitat destruction and the extinction debt. Nature 371: 65–66.
    1. Pimm SL, Raven P (2000) Biodiversity: extinction by the numbers. Nature 403: 843–845. - PubMed
    1. Thomas CD, Cameron A, Green RE, et al. (2004) Extinction risk from climate change. Nature 427: 145–148. - PubMed

Publication types

LinkOut - more resources