. 2014 Aug 14;10(8):e1004523.
doi: 10.1371/journal.pgen.1004523. eCollection 2014 Aug.

Global genetic variations predict brain response to faces

Collaborators, Affiliations

Global genetic variations predict brain response to faces

Erin W Dickie et al. PLoS Genet. .

Erratum in

  • PLoS Genet. 2014 Oct;10(10):e1004802

Abstract

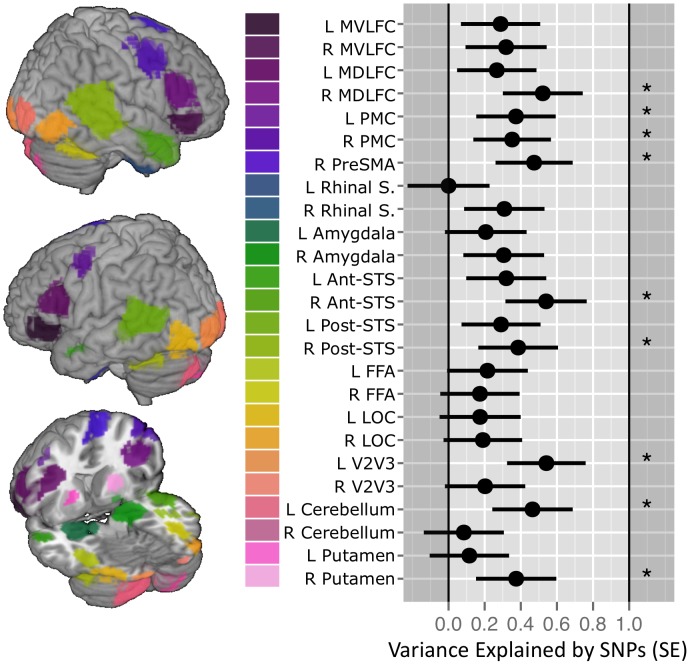
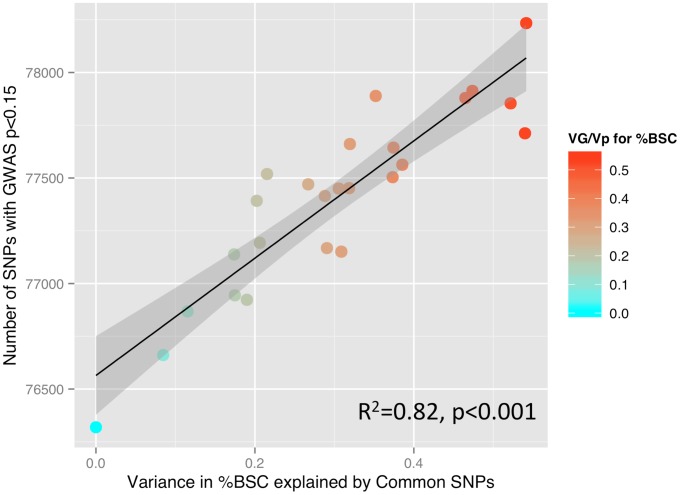
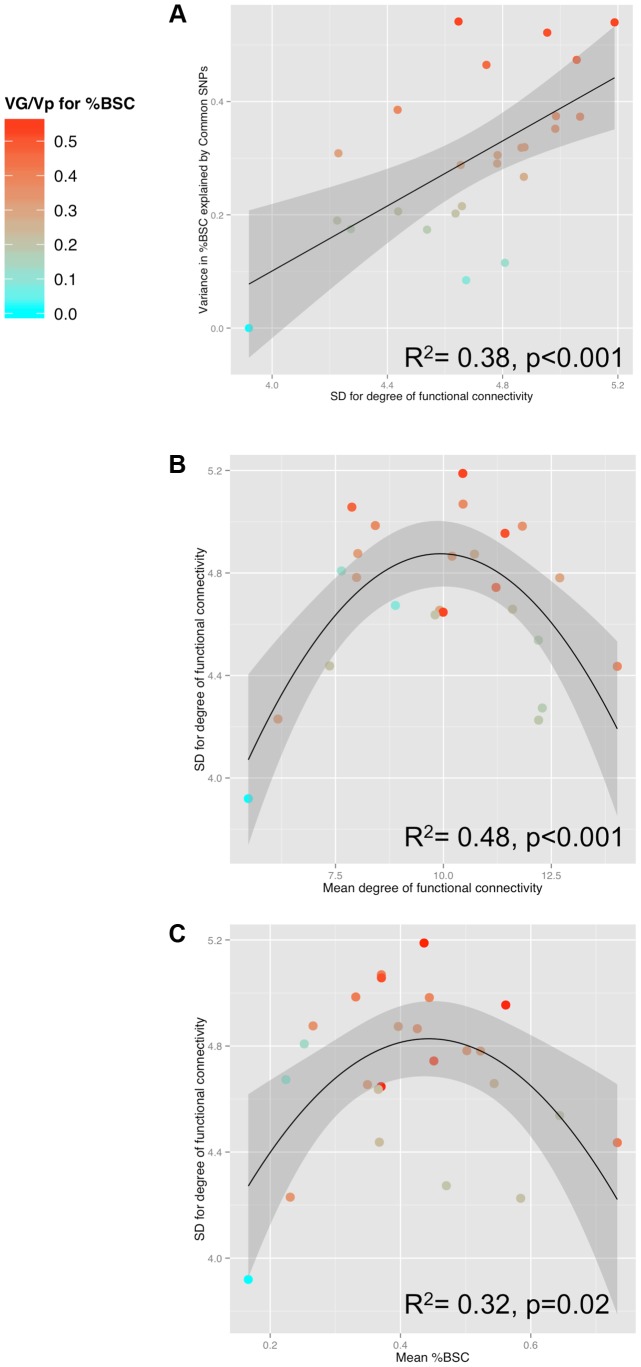
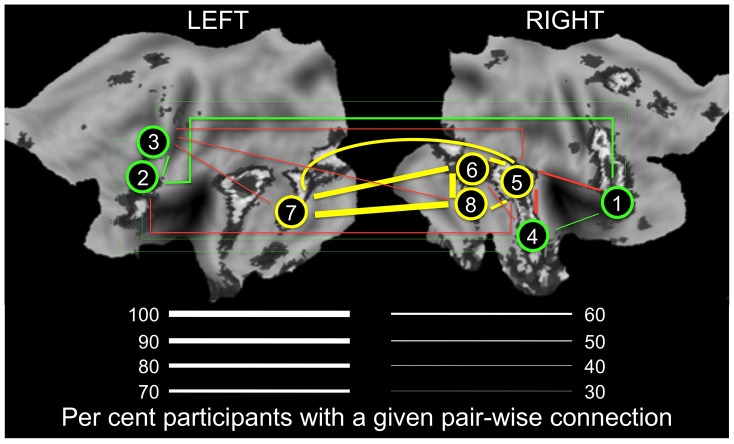
Face expressions are a rich source of social signals. Here we estimated the proportion of phenotypic variance in the brain response to facial expressions explained by common genetic variance captured by ∼ 500,000 single nucleotide polymorphisms. Using genomic-relationship-matrix restricted maximum likelihood (GREML), we related this global genetic variance to that in the brain response to facial expressions, as assessed with functional magnetic resonance imaging (fMRI) in a community-based sample of adolescents (n = 1,620). Brain response to facial expressions was measured in 25 regions constituting a face network, as defined previously. In 9 out of these 25 regions, common genetic variance explained a significant proportion of phenotypic variance (40-50%) in their response to ambiguous facial expressions; this was not the case for angry facial expressions. Across the network, the strength of the genotype-phenotype relationship varied as a function of the inter-individual variability in the number of functional connections possessed by a given region (R(2) = 0.38, p<0.001). Furthermore, this variability showed an inverted U relationship with both the number of observed connections (R2 = 0.48, p<0.001) and the magnitude of brain response (R(2) = 0.32, p<0.001). Thus, a significant proportion of the brain response to facial expressions is predicted by common genetic variance in a subset of regions constituting the face network. These regions show the highest inter-individual variability in the number of connections with other network nodes, suggesting that the genetic model captures variations across the adolescent brains in co-opting these regions into the face network.


Conflict of interest statement

The authors have declared that no competing interests exist.

Figures

Figure 1
Figure 1. SNP-based estimates of heritability in the brain response to ambiguous faces.
(Left) Locations of the 25 functional Regions of Interest (ROI) defined for the Dynamic Ambiguous Face vs. Control contrast . (Right) Proportion of variance in mean percent BOLD signal change (%BCS) explained by common genetic variance for each ROI when viewing facial expressions in 1,620 unrelated adolescents. Error bars indicate the standard Error of the estimate. Stars indicate those estimates significant at an alpha 0.05 (uncorrected). Vertical gridlines are at intervals of 0.2. Abbreviations: Mid-ventrolateral frontal cortex (MVLFC); Mid-dorsolateral frontal cortex (MDLFC); premotor cortex (PMC), pre supplementary motor area (PreSMA); superior temporal sulcus (STS); fusiform face area (FFA); lateral occipital cortex (LOC); left (L); right (R). SNP, single nucleotide polymorphisms.
Figure 2
Figure 2. SNP-based estimates of heritability and the number of SNPs detected in a GWAS.
Relationship between GREML-based heritability estimates (Genetic Variance/Phenotypic Variance) and the number of single nucleotide polymorphisms (SNPs) showing a significant relationship with percent BOLD signal change (%BSC) at a threshold of p<0.15 (see the Results section for rationale). P values for this analysis were obtained using linear regression.
Figure 3
Figure 3. Relationships between SNP-based estimates of heritability, population variance in functional connectivity and the BOLD response.
A) Relationship between GREML-based heritability estimates (Genetic Variance/Phenotypic Variance) and the population variance (standard deviation, SD) of functional connectivity (node degree) across 25 ROIs for the Ambiguous face viewing contrast. B) Relationship between the population variance (SD) and the population mean of degree across the 25 ROIs. C) Relationship between population mean of the brain response (percent BOLD signal change, %BSC) and the population variance (SD) of degree across the 25 ROIs. For all three plots, colour is scaled according to the GREML results for %BSC (cyan for low values and red for high values). VG, Genetic Variance; Vp, Phenotypic Variance.
Figure 4
Figure 4. Connectivity in the “Obligatory” (yellow) and “Optional” (green) nodes of the face network.
Thickness of lines indicates proportion of participants (%) with a given pair-wise connection, defined as a pair-wise correlation r>0.3. Yellow and green lines denote connections within the “Obligatory” and “Optional” networks, respectively. Red lines denote connections across the two subnetworks; for clarity, only connections present in 50% or more participants are shown. For all pair-wise values, see Supplementary Table S2. 1, mid-ventrolateral frontal cortex (right); 2, mid-dorsolateral frontal cortex (left); 3, premotor cortex (left); 4, anterior portion of the superior temporal sulcus (right); 5, posterior portion of the superior temporal sulcus (right); 6, fusiform face area (right); 7, lateral occipital cortex (left); 8, lateral occipital cortex (right). LEFT, the left hemisphere; RIGHT, the right hemisphere. The flat maps of the cerebral cortex contain the probability map of the face network adapted from Tahmasebi et al. .

References

    1. Bourke C, Douglas K, Porter R (2010) Processing of facial emotion expression in major depression: a review. Aust N Z J Psychiatry 44: 681–696 10.3109/00048674.2010.496359 - DOI - PubMed
    1. Machado-de-Sousa JP, Arrais KC, Alves NT, Chagas MHN, de Meneses-Gaya C, et al. (2010) Facial affect processing in social anxiety: tasks and stimuli. J Neurosci Methods 193: 1–6 10.1016/j.jneumeth.2010.08.013 - DOI - PubMed
    1. Marwick K, Hall J (2008) Social cognition in schizophrenia: a review of face processing. Br Med Bull 88: 43–58 10.1093/bmb/ldn035 - DOI - PubMed
    1. Toh WL (2011) Current visual scanpath research: a review of investigations into the psychotic, anxiety, and mood disorders. Compr Psychiatry 52: 567–579. - PubMed
    1. Leppänen JM (2006) Emotional information processing in mood disorders: a review of behavioral and neuroimaging findings. Curr Opin Psychiatry 19: 34–39 10.1097/01.yco.0000191500.46411.00 - DOI - PubMed

Publication types

LinkOut - more resources