. 2014 Aug 13;14(9):12.
doi: 10.1167/14.9.12.

Accuracy and speed of material categorization in real-world images

Affiliations

Accuracy and speed of material categorization in real-world images

Lavanya Sharan et al. J Vis. .

Abstract

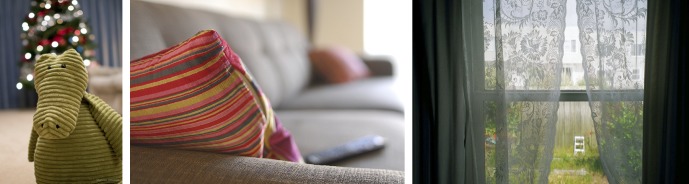
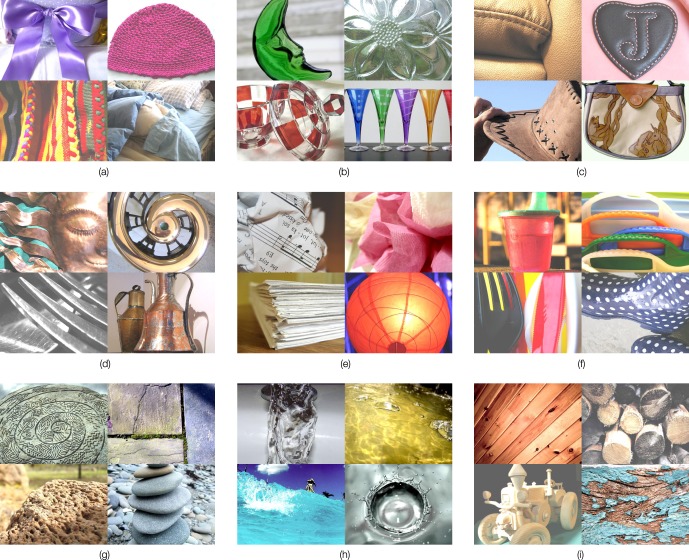
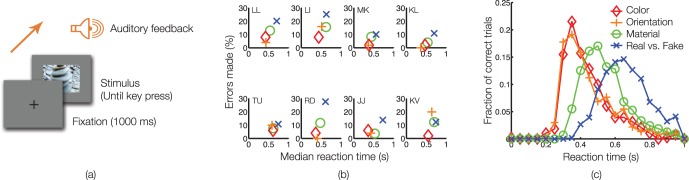
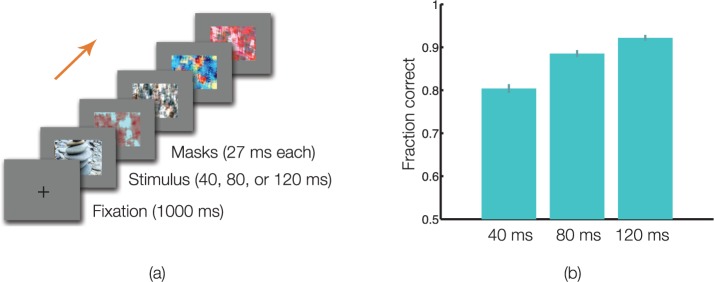
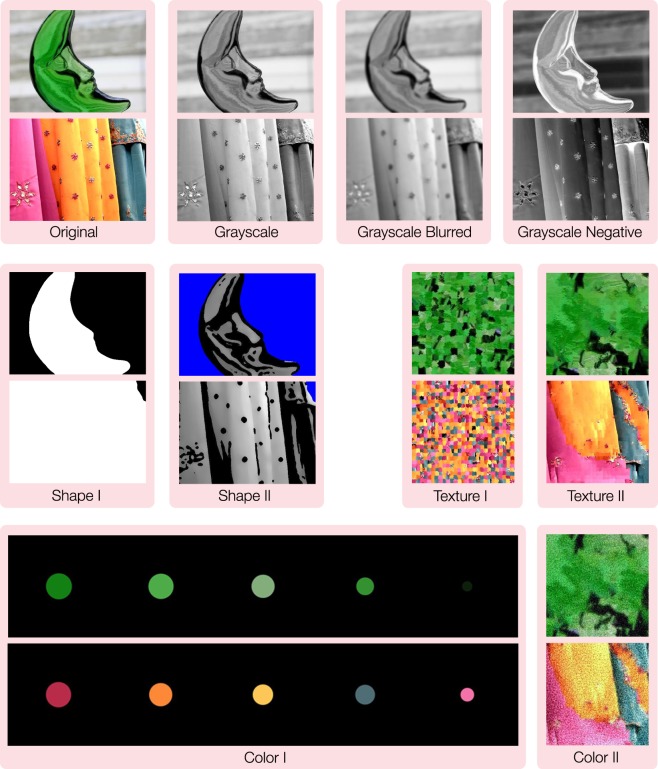
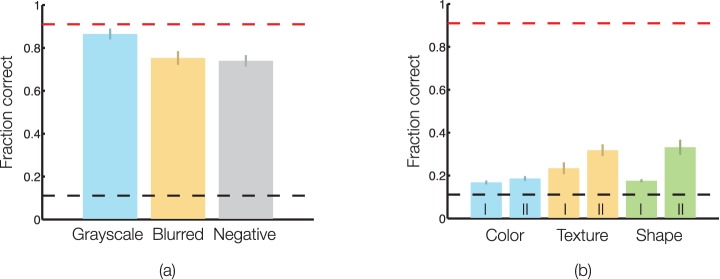
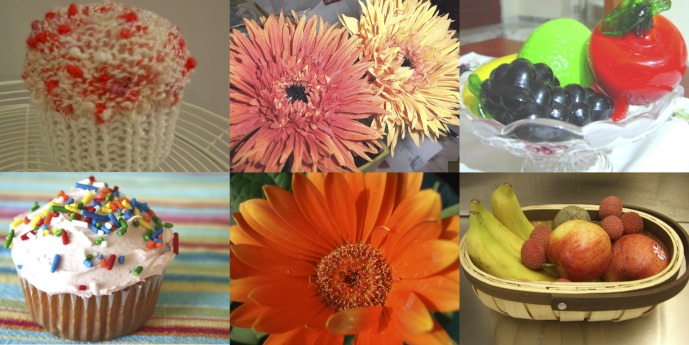
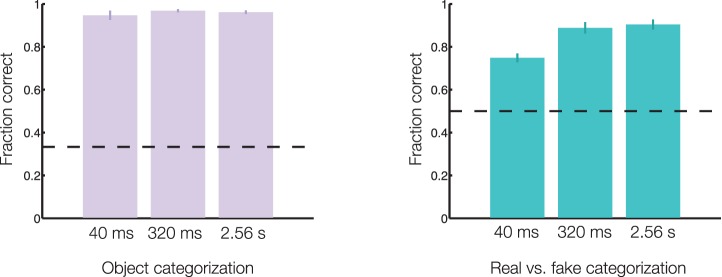
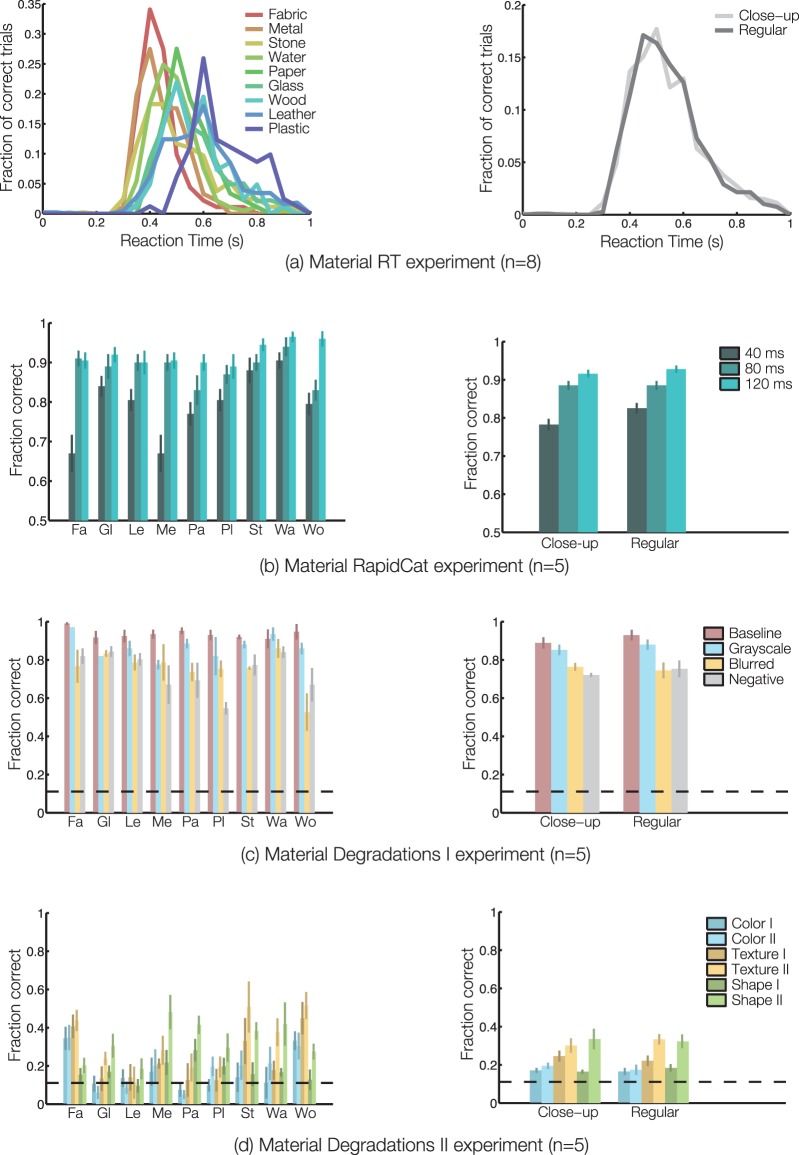
It is easy to visually distinguish a ceramic knife from one made of steel, a leather jacket from one made of denim, and a plush toy from one made of plastic. Most studies of material appearance have focused on the estimation of specific material properties such as albedo or surface gloss, and as a consequence, almost nothing is known about how we recognize material categories like leather or plastic. We have studied judgments of high-level material categories with a diverse set of real-world photographs, and we have shown (Sharan, 2009) that observers can categorize materials reliably and quickly. Performance on our tasks cannot be explained by simple differences in color, surface shape, or texture. Nor can the results be explained by observers merely performing shape-based object recognition. Rather, we argue that fast and accurate material categorization is a distinct, basic ability of the visual system.

Keywords: material categories; material perception; material properties; real-world stimuli.


Figures

Figure 1
Figure 1
Here are examples of everyday objects that are mainly composed of fabric. We can identify the objects in these images (left to right: stuffed toy, cushion, curtains) just as easily as we can recognize what they are made of. Unlike object and scene categorization, little is known about how we perceive material categories in the real world.
Figure 2
Figure 2
An example of a material categorization task. Three of these images contain plastic surfaces while the rest contain nonplastic surfaces. The reader is invited to identify the material category of the foreground surfaces in each image. The correct answers are: (left to right) wood, plastic, plastic, leather, plastic, and glass.
Figure 3
Figure 3
Examples from our image database of material categories: (a) fabric, (b) glass, (c) leather, (d) metal, (e) paper, (f) plastic, (g) stone, (h) water, and (i) wood. We used an intentionally diverse selection of images; each category included a range of illumination conditions, viewpoints, surface geometries, reflectance properties, and backgrounds. This diversity in appearance reduced the chances that simple, low-level information like color could be used to distinguish the categories. In addition, all images in our database were normalized to have the same mean luminance to prevent overall brightness from being a cue to the material category.
Figure 4
Figure 4
Measuring the accuracy and speed of material categorization with RTs. (a) On each trial, observers indicated the presence or absence of a target category (e.g., stone) with a key press. Auditory feedback was provided, and RTs greater than 1 s were discarded. (b) Errors made by the observers are plotted against their median RTs for the baseline categorization tasks (red and orange; Material RT experiment), material categorization task (green; Material RT experiment), and real versus fake task (blue; Real-Fake RT experiment); there is no evidence of a speed-accuracy trade-off. Chance performance corresponds to 50% error. (c) RT distributions for correct trials, averaged across eight observers, are shown here for each type of task. Compared to baseline tasks, material categorization is slower by approximately 100 ms.
Figure 5
Figure 5
Measuring the accuracy and speed of material categorization with rapid presentations. (a) On each trial, the stimulus was presented for either 40, 80, or 120 ms, and it was followed by four perceptual masks for 27 ms each. Observers indicated the presence or absence of a target category (e.g., stone) with a key press. (b) Accuracy at detecting a given material category, averaged across five observers and nine material categories, is well above chance (0.5) for all three presentation times; this rapid recognition performance is similar to that documented for objects and scenes. Errors represent 1 SEM.
Figure 6
Figure 6
Stimuli used in Material Degradation experiments. In Degradation I experiment (Grayscale, Grayscale Blurred, and Grayscale Negative), we manipulated each photograph in our database to degrade much of the information from a particular surface property, while preserving the information from other properties. In Degradation II experiment (Shape I and II, Texture I and II, Color I and II), we did the reverse. Shown here are two examples from our database, a glass decoration and embroidered garments, along with the three manipulations of Degradation I and the six manipulations of Degradation II experiments. The Grayscale manipulation, for instance, tests the necessity of color information. Grayscale Blurred degrades texture information, and Grayscale Negative makes it hard to see reflectance cues like specular highlights and shadows. The Texture I and II manipulations preserve local spatial-frequency content, including color variations, but lose overall surface shape. The Shape I and II manipulations preserve either the global silhouette of the object or a line drawing-like sketch of the surface shape. The Color I and II manipulations preserve aspects of the distribution of colors within the material, but lose all shape information, and all or much of the texture.
Figure 7
Figure 7
Simple features, by themselves, cannot explain performance. These graphs show the accuracy at material categorization for all conditions in Material Degradation Experiments (a) I and (b) II, averaged across observers and material categories. In the Degradation I experiment, removing color information did not affect performance, while removing high spatial frequencies and inverting the contrast polarity did, but only to a small extent. Observers were still able to identify the material categories in the degraded images shown in the top row of Figure 6. In the Degradation II experiment, when observers were presented mainly one type of information, either shape, texture, or color, they performed poorly. For comparison, accuracy on the original photographs in the baseline condition (0.91) is indicated in red and chance performance (0.11) is indicated in black. Error bars represent 1 SEM across three observers in the Grayscale and Grayscale Blurred conditions, two observers in the Grayscale Negative condition, and five observers for all conditions in (b).
Figure 8
Figure 8
Stimuli used in Real versus Fake experiments. Here are some examples from our image database of real and fake objects. (Top row, from left to right) A knit wool cupcake, flowers made of fabric, and plastic fruits. (Bottom row, from left to right) Genuine examples of a cupcake, a flower, and fruits. We attempted to balance the real and fake categories for content by including similar variations in shape, color, object type, and backgrounds. The fake objects in our database were composed of materials such as fabric, plastic, glass, clay, paper, etc., and they ranged from easily identifiable fakes, such as the knit cupcake shown here, to harder cases that potentially required scrutiny. By presenting images from our database to observers and asking them to make real versus fake discriminations, it was possible to dissociate shape-based object recognition from material recognition.
Figure 9
Figure 9
Shape-based object knowledge is insufficient for material recognition. Accuracy at identifying the object in each image as dessert, fruit, or flower (left panel) and as a real or fake example of that object (right panel) is shown here as a function of stimulus duration. Observers were able to identify the object category accurately in all three exposure conditions. Their performance at identifying real versus fake was lower, and it improved with longer exposures. The pattern of these results tells us that shape-based object identity is insufficient for the real versus fake material discrimination and that observers can make fine material discriminations even in brief presentations. Error bars represent 1 SEM across seven observers. Chance performance (black lines) is 0.33 for the object task and 0.5 for the real versus fake task.
Figure 10
Figure 10
Measuring the influence of material category and view type on material categorization. (a) RT distributions for correct trials, averaged across (left) one to six and (right) eight observers, are shown here for each (left) material category and (right) view type. (b) Accuracy at detecting material categories is shown here for all exposure durations as a function of (left) material category and (right) view type. Chance performance corresponds to 0.5, and error bars represent 1 SEM across (left) one to two and (right) five observers. (c–d) Accuracy at nine-way material categorization is shown here for all degradations as a function of (left) material category and (right) view type. Chance performance (0.11) is indicated by dashed black lines, and error bars represent 1 SEM across four observers in the Baseline condition, three observers in the Grayscale and Blurred conditions, two observers in the Negative condition, and five observers in all conditions of (d). The influence of material category should be interpreted cautiously as we lack sufficient statistical power (e.g., n = 1 for fabric and plastic RT curves). Meanwhile, it is safe to conclude that there were no significant effects of view type.

References

    1. Adelson E. H. (2001). On seeing stuff: The perception of materials by humans and machines. In B. E. Rogowitz & T. N. Pappas (Eds.), SPIE: Vol. 4299. Human vision and electronic imaging VI (pp. 1–12). doi:10.1117/12.784132 - DOI
    1. Adelson E. H. (2008). Image statistics and surface perception. In B. E. Rogowitz & T. N. Pappas (Eds.), Human vision and electronic imaging XIII, Vol. 6809 ( pp 1–9). doi:10.1117/12.784132 - DOI
    1. Anderson B. (2011). Visual perception of materials and surfaces. Current Biology, 21 (24), R978–R983 - PubMed
    1. Bacon-Mace N., Mace M. J., Fabre-Thorpe M., Thorpe S. J. (2005). The time course of visual processing: Backward masking and natural scene categorization. Vision Research, 45 (11), 1459–1469 - PubMed
    1. Barron J. T., Malik J. (2011). High-frequency shape and albedo from shading using natural image statistics. In IEEE conference on computer vision and pattern recognition (pp. 2521–2528). doi:10.1109/cvpr.2011.5995392. - DOI

Publication types