. 2014 Nov;24(11):1854-68.
doi: 10.1101/gr.175034.114. Epub 2014 Aug 13.

Unbiased analysis of potential targets of breast cancer susceptibility loci by Capture Hi-C

Affiliations

Unbiased analysis of potential targets of breast cancer susceptibility loci by Capture Hi-C

Nicola H Dryden et al. Genome Res. 2014 Nov.

Abstract

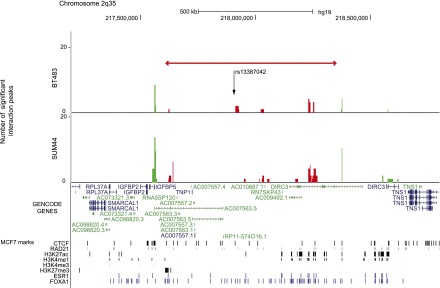
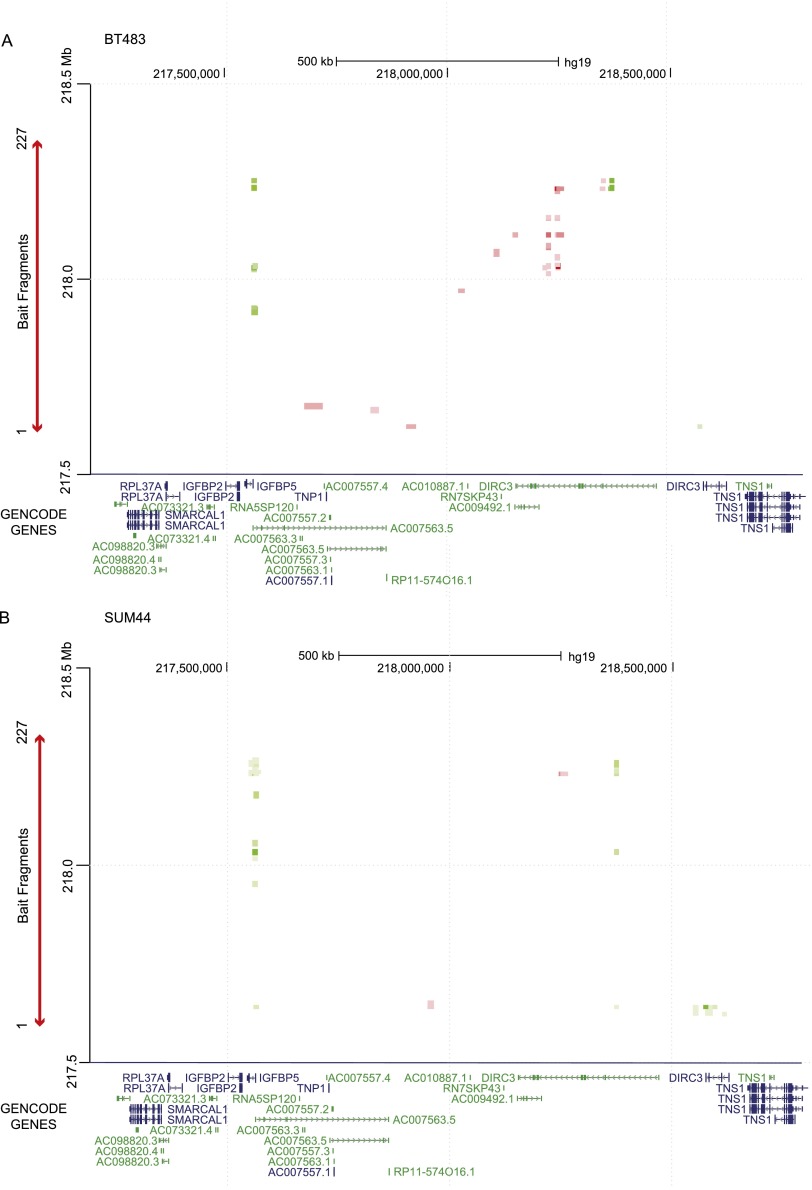
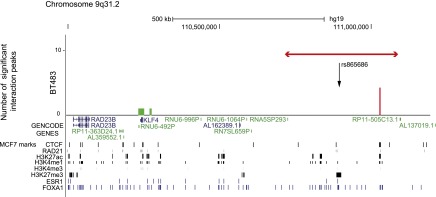
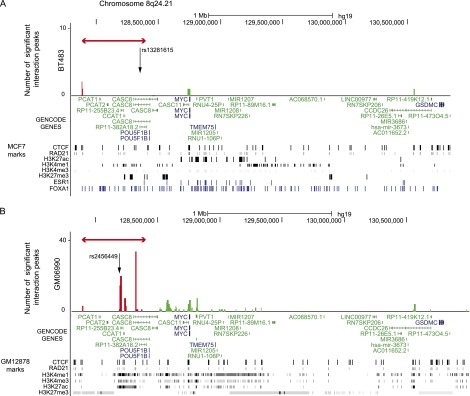
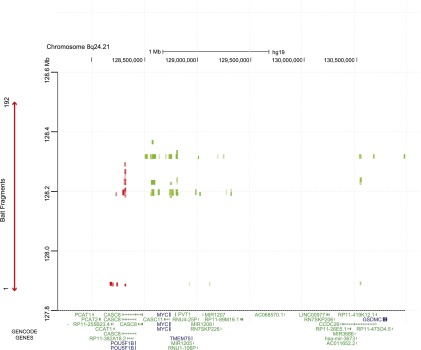
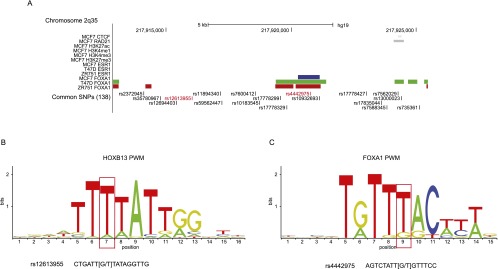
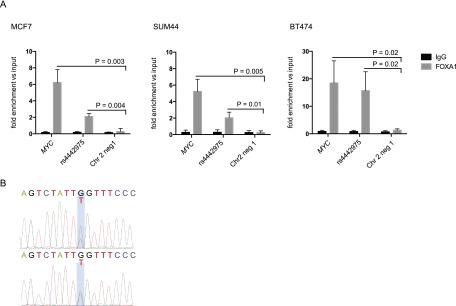
Genome-wide association studies have identified more than 70 common variants that are associated with breast cancer risk. Most of these variants map to non-protein-coding regions and several map to gene deserts, regions of several hundred kilobases lacking protein-coding genes. We hypothesized that gene deserts harbor long-range regulatory elements that can physically interact with target genes to influence their expression. To test this, we developed Capture Hi-C (CHi-C), which, by incorporating a sequence capture step into a Hi-C protocol, allows high-resolution analysis of targeted regions of the genome. We used CHi-C to investigate long-range interactions at three breast cancer gene deserts mapping to 2q35, 8q24.21, and 9q31.2. We identified interaction peaks between putative regulatory elements ("bait fragments") within the captured regions and "targets" that included both protein-coding genes and long noncoding (lnc) RNAs over distances of 6.6 kb to 2.6 Mb. Target protein-coding genes were IGFBP5, KLF4, NSMCE2, and MYC; and target lncRNAs included DIRC3, PVT1, and CCDC26. For one gene desert, we were able to define two SNPs (rs12613955 and rs4442975) that were highly correlated with the published risk variant and that mapped within the bait end of an interaction peak. In vivo ChIP-qPCR data show that one of these, rs4442975, affects the binding of FOXA1 and implicate this SNP as a putative functional variant.


Figures

Figure 1.
Figure 1.
Statistically significant CHi-C interaction peaks at the 2q35 locus. The number of statistically significant interaction peaks mapping to each HindIII fragment (y-axis) is plotted against the genomic location of the HindIII fragment (x-axis) for a 1.6-Mb region (217.2–218.8 Mb) of chromosome 2q35 including the 0.8-Mb genomic region (217,609,776–218,362,744 bp) that was targeted in the sequence capture step of our CHi-C protocol. All coordinates are based on hg19. The capture region is denoted by a double-headed red arrow; the “bait end” of the interaction peaks (i.e., the end that maps to the capture region) is indicated in red, the target end (i.e., the region that maps outside the capture region) is indicated in green. The interaction peaks are aligned with (1) GENCODE genes (v19) with protein-coding transcripts colored blue and noncoding transcripts colored green; and (2) CTCF and RAD21 binding sites, active (H3K27ac, H3K4me1 and H3K4me3) and repressive (H3K27me3) histone modification marks (in black), and ESR1 and FOXA1 binding sites (in blue) generated in the breast cancer cell line MCF7 by the ENCODE Project, Frietze et al. (2012), and Hurtado et al. (2011). The location of the breast cancer risk SNP rs13387042 is also shown.
Figure 2.
Figure 2.
Two-way heatmap of interaction peaks at the 2q35 locus. (A) Two-way heatmap of interaction peaks between bait fragments within the 2q35 capture region and target fragments either side of the capture region (green) or between two bait fragments within the capture region (red) for the BT483 libraries. The genomic locations of the bait fragments are shown on the y-axis. The genomic locations of the target fragments, aligned with GENCODE genes, are shown on the x-axis. The color intensity of each square represents the statistical significance of the interaction peak from dark green/red (P = 1 × 10⁻¹⁰) to light green/red (P ≤ 0.01). Interaction peaks with a false discovery corrected P-value of >0.01 are not shown. (B) Two-way heatmap of interaction peaks for the 2q35 locus in the SUM44 libraries.
Figure 3.
Figure 3.
Statistically significant CHi-C interaction peaks at the 9q31.2 locus. The number of statistically significant interaction peaks mapping to each HindIII fragment (y-axis) is plotted against the genomic location of the HindIII fragment (x-axis) for a 1.2-Mb region (110.2–111.0 Mb) of chromosome 9q31.2, including the 0.3-Mb genomic region (110,759,922–111,097,304 bp) that was targeted in the sequence capture step of our CHi-C protocol. All coordinates are based on hg19. The capture region is denoted by a double-headed red arrow; the “bait end” of the interaction peaks is indicated in red; the target end is indicated in green. The significant interaction peaks are aligned with (1) GENCODE genes (v19) with protein-coding transcripts colored blue and noncoding transcripts colored green; and (2) CTCF and RAD21 binding sites, active (H3K27ac, H3K4me1, and H3K4me3) and repressive (H3K27me3) histone modification marks (in black), and ESR1 and FOXA1 binding sites (in blue) generated in the breast cancer cell line MCF7 by the ENCODE Project, Frietze et al. (2012), and Hurtado et al. (2011).
Figure 4.
Figure 4.
Statistically significant CHi-C interaction peaks at the 8q24.21 locus. (A) The number of statistically significant interaction peaks mapping to each HindIII fragment (y-axis) is plotted against the genomic location of the HindIII fragment (x-axis) for a 3.2-Mb region (127.8–131.0 Mb) of chromosome 8q24.21, including the 0.6-Mb genomic region (127,888,336–128,469,498 bp) that was targeted in the sequence capture step of our CHi-C protocol. All coordinates are based on hg19. The capture region is denoted by a double-headed red arrow; the “bait end” of the interaction peaks is indicated in red; the target end is indicated in green. The significant interaction peaks are aligned with (1) GENCODE genes (v19) with protein-coding transcripts colored blue and noncoding transcripts colored green; and (2) CTCF and RAD21 binding sites, active (H3K27ac, H3K4me1, and H3K4me3) and repressive (H3K27me3) histone modification marks (in black), and ESR1 and FOXA1 binding sites (in blue) generated in the breast cancer cell line MCF7 by the ENCODE Project, Frietze et al. (2012), and Hurtado et al. (2011). The location of the breast cancer risk SNP rs13281615 is also shown. (B) As above, but based on statistically significant interaction peaks in the lymphoblastoid cell line GM06990 and aligned with ENCODE data from the lymphoblastoid cell line GM12878.
Figure 5.
Figure 5.
Two-way heatmap of interaction peaks at the 8q24.21 locus. Two-way heatmap of interaction peaks between bait fragments within the 8q24.21 capture region and target fragments either side of the capture region (green) or between two bait fragments within the capture region (red) for the GM06990 libraries. The genomic locations of the bait fragments are shown on the y-axis. The genomic locations of the target fragments, aligned with GENCODE genes, are shown on the x-axis. The color intensity of each square represents the statistical significance of the interaction from dark green/red (P = 1 × 10⁻¹⁰) to light green/red (P ≤ 0.01). Interactions with a false discovery corrected P-value of >0.01 are not shown.
Figure 6.
Figure 6.
Functional annotation of bait fragment 82 at the 2q35 capture region. (A) The locations of all SNPs that are correlated (r2 ≥ 0.1) with the published risk SNP (rs13387042) are shown, with the two SNPs that are strongly correlated (r2 ≥ 0.8) in red. SNPs are aligned with CTCF and RAD21 binding sites, active (H3K27ac, H3K4me1, and H3K4me3) and repressive (H3K27me3) histone modification marks (in black) generated in the breast cancer cell line MCF7 by the ENCODE Project and by Frietze et al. (2012), and ESR1 and FOXA1 binding peaks generated in MCF7 (blue), T-47D (green), and ZR75-1 cells (red) by Hurtado et al. (2011). All three breast cancer cell lines are homozygous for the G-allele of rs4442975. (B) Position weighted matrix (PWM) for HOXB13 binding site. The base position that is altered by rs12613955 is indicated by a red box and the sequence of rs12613955 is shown below. Based on ChIP-seq data in (human) prostate cancer cells (Huang et al. 2014), the consensus sequence is conserved between mouse and man. (C) PWM for FOXA1 binding site with the base position that is altered by rs4442975 indicated by a red box and the sequence of rs4442975 shown below.
Figure 7.
Figure 7.
ChIP qPCR analysis of FOXA1 binding to rs4442975 region. (A) FOXA1 ChIP-qPCR for MYC (positive control), rs4442975 (test region), and a control region (Chr2: 217,922,940–217,923,055 bp) mapping 2.1 kb telomeric to rs4442975 that showed no evidence of FOXA1 binding in data from Hurtado and colleagues. Mean ±SD for three technical replicates. (B) Sanger sequencing of the rs4442975 region in FOXA1 immunoprecipitated chromatin (top) and input genomic DNA (bottom).

References

    1. The 1000 Genomes Project Consortium . 2012. An integrated map of genetic variation from 1,092 human genomes. Nature 491: 56–65 - PMC - PubMed
    1. Affer M, Chesi M, Chen WD, Keats JJ, Demchenko YN, Roschke AV, Van Wier S, Fonseca R, Bergsagel PL, Kuehl WM. 2014. Promiscuous rearrangements of the MYC locus hijack enhancers and super-enhancers to dysregulate MYC expression in multiple myeloma. Leukemia 28: 1725–1735 - PMC - PubMed
    1. Ahmadiyeh N, Pomerantz MM, Grisanzio C, Herman P, Jia L, Almendro V, He HH, Brown M, Liu XS, Davis M, et al. 2010. 8q24 prostate, breast, and colon cancer risk loci show tissue-specific long-range interaction with MYC. Proc Natl Acad Sci 107: 9742–9746 - PMC - PubMed
    1. Anderson CA, Soranzo N, Zeggini E, Barrett JC. 2011. Synthetic associations are unlikely to account for many common disease genome-wide association signals. PLoS Biol 9: e1000580. - PMC - PubMed
    1. Bahcall O. 2013. Functional annotation of susceptibility loci identified by COGS. Nat Genet doi: - DOI

Publication types

MeSH terms

Associated data