. 2014 Nov;24(11):1797-807.
doi: 10.1101/gr.176784.114. Epub 2014 Aug 13.

High-resolution mapping of transcriptional dynamics across tissue development reveals a stable mRNA-tRNA interface

Affiliations

High-resolution mapping of transcriptional dynamics across tissue development reveals a stable mRNA-tRNA interface

Bianca M Schmitt et al. Genome Res. 2014 Nov.

Abstract

The genetic code is an abstraction of how mRNA codons and tRNA anticodons molecularly interact during protein synthesis; the stability and regulation of this interaction remains largely unexplored. Here, we characterized the expression of mRNA and tRNA genes quantitatively at multiple time points in two developing mouse tissues. We discovered that mRNA codon pools are highly stable over development and simply reflect the genomic background; in contrast, precise regulation of tRNA gene families is required to create the corresponding tRNA transcriptomes. The dynamic regulation of tRNA genes during development is controlled in order to generate an anticodon pool that closely corresponds to messenger RNAs. Thus, across development, the pools of mRNA codons and tRNA anticodons are invariant and highly correlated, revealing a stable molecular interaction interlocking transcription and translation.


Figures

Figure 1.
Figure 1.
Transcriptome-wide analysis of protein-coding and tRNA genes during mouse organ development. Liver and brain tissues were isolated at eight mouse developmental stages. Tissue samples were flash-frozen for RNA-sequencing (RNA-seq) and cross-linked using formaldehyde to preserve protein–DNA interactions for ChIP-sequencing (ChIP-seq) of Pol III. Using the RNA-seq data, we calculated from all expressed protein-coding genes the frequencies of each triplet codon for all 64 possible codons and 20 amino acids. Similarly, Pol III binding to tRNA genes in the mouse genome was collapsed into 47 anticodon isoacceptor families and 20 amino acid isotypes (Methods). The bars linking RNA- and ChIP-seq data represent the three nucleotide interactions between codon and anticodon. Pol III occupancy was determined also in E9.5 (whole embryo) and E12.5 (head vs. remaining body).
Figure 2.
Figure 2.
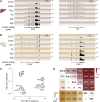
Protein-coding genes are differentially expressed in developing mouse liver and brain. Representative examples of protein-coding gene expression during development are (A) total RNA-seq reads mapping to Apob and Afp genes in liver and (B) Foxp2 and Calm1 genes in brain. The y-axis of each track specifies normalized read density. The scale bar shows length of genomic regions in kilobases (kb). (C) Factorial map of the principal component (PC) analysis of global protein-coding gene expression levels in liver (red) and brain (yellow) tissues. The proportion of variance explained by each principal component is indicated in parentheses. Color gradient indicates developmental stage (light: young; dark: old). (D) The intersection of the row/column for each developmental stage combination shows the number of differentially expressed protein-coding genes between the respective stages in liver (top right triangle) and brain (bottom left triangle) (0.1% FDR).
Figure 3.
Figure 3.
tRNA genes are differentially expressed during mouse development. (A) Stacked bar graph representing total number of expressed tRNA genes in developing mouse liver and brain tissue. Black (no differential expression) and gray (differential expression) represent number of tRNA genes expressed in all stages and tissues. In blue are tRNA genes that are shared between one and 11 stages. (B) Pol III binding to tRNA genes for the same genomic region during mouse liver development. Different colors of tRNA gene identifiers correspond to those used in A. The y-axis of each track specifies normalized read density. Scale bar shows length of genomic regions in kilobases (kb). (C) The intersection of the row/column for each developmental stage combination shows the number of differentially expressed tRNA genes in liver (top right triangle) and brain (bottom left triangle) (0.1% FDR). (D) Factorial map of the principal component (PC) analysis of tRNA gene expression levels in liver (red) and brain (yellow). The proportion of variance explained by each principal component is indicated in parentheses. Color gradient indicates developmental stage (light: young; dark: old).
Figure 4.
Figure 4.
Codon and anticodon usage in transcriptomes across mouse development. Each panel (A–C) consists of three columns: experimentally observed data (left), simulated patterns of transcription randomized among either the expressed genes (middle), or all genomically encoded genes (right). Transcriptomes of each developmental stage were simulated 100 times (Methods). Proportional frequencies weighted by transcript expression are shown for arginine triplet codons as a bar plot (A), where gray shading is by triplet codon. Proportional frequencies weighted by Pol III binding are shown for arginine isoacceptors as a bar plot (B). (C) Plots show Spearman’s rank correlation coefficients (ρ) and P-values (P) of Pol III binding to tRNA isoacceptors (x-axis) and transcriptomic codon frequencies weighted by expression obtained from mRNA-seq data in E15.5 liver (experimentally observed data) and all six developmental stages (simulated data). Anticodon isoacceptors that are not encoded in the mouse genome (gray dots in C) were excluded from calculating the correlation coefficients. Observed correlations across all stages are indicated by black diamonds in plot C, middle and left panels.
Figure 5.
Figure 5.
tRNA gene expression is compensated on the isoacceptor level during mouse development. Anticodon isoacceptor Leu(CAG) (A) and Gly(GCC) (C) illustrate a strong and weak correlation of tRNA gene expression level, respectively. Each row of the heatmap represents relative expression levels of tRNA genes across different developing mouse liver stages (white, low = 0; purple, high = 1). Density plots (B,D) represent the distribution of pairwise correlation coefficients between each tRNA gene’s expression levels during mouse liver development for anticodon isoacceptor (B) Leu(CAG) and (D) Gly(GCC) (blue). Background distributions (gray) are derived by permuting the order of stages when computing the pairwise correlation between tRNA genes. P-values (P, χ2-test) are reported in top right of each panel.

References

    1. Anders S, Pyl PT, Huber W. 2014. HTSeq—a Python framework to work with high-throughput sequencing data. bioRxiv doi: 10.1101/002824 - DOI - PMC - PubMed
    1. Bailey TL, Elkan C. 1994. Fitting a mixture model by expectation maximization to discover motifs in biopolymers. Proc Int Conf Intell Syst Mol Biol 2: 28–36 - PubMed
    1. Barski A, Chepelev I, Liko D, Cuddapah S, Fleming AB, Birch J, Cui K, White RJ, Zhao K. 2010. Pol II and its associated epigenetic marks are present at Pol III-transcribed noncoding RNA genes. Nat Struct Mol Biol 17: 629–634 - PMC - PubMed
    1. Bloom-Ackermann Z, Navon S, Gingold H, Towers R, Pilpel Y, Dahan O. 2014. A comprehensive tRNA deletion library unravels the genetic architecture of the tRNA pool. PLoS Genet 10: e1004084. - PMC - PubMed
    1. Bohme HJ, Sparmann G, Hofmann E. 1983. Biochemistry of liver development in the perinatal period. Experientia 39: 473–483 - PubMed

Publication types

MeSH terms