. 2014 Aug 13;6(249):249ra109.
doi: 10.1126/scitranslmed.3009377.

Lymph node fibroblastic reticular cell transplants show robust therapeutic efficacy in high-mortality murine sepsis

Affiliations

Lymph node fibroblastic reticular cell transplants show robust therapeutic efficacy in high-mortality murine sepsis

Anne L Fletcher et al. Sci Transl Med. .

Abstract

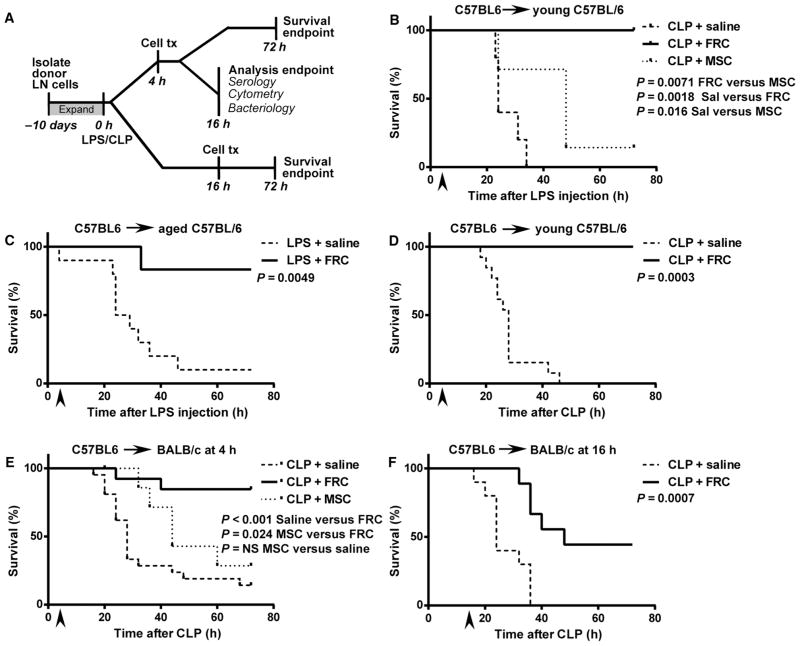
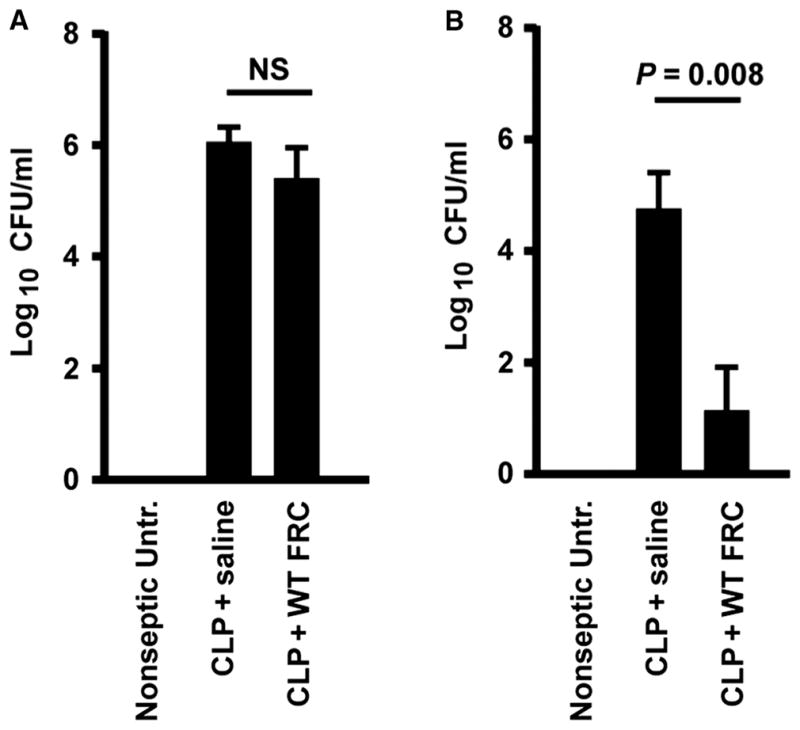
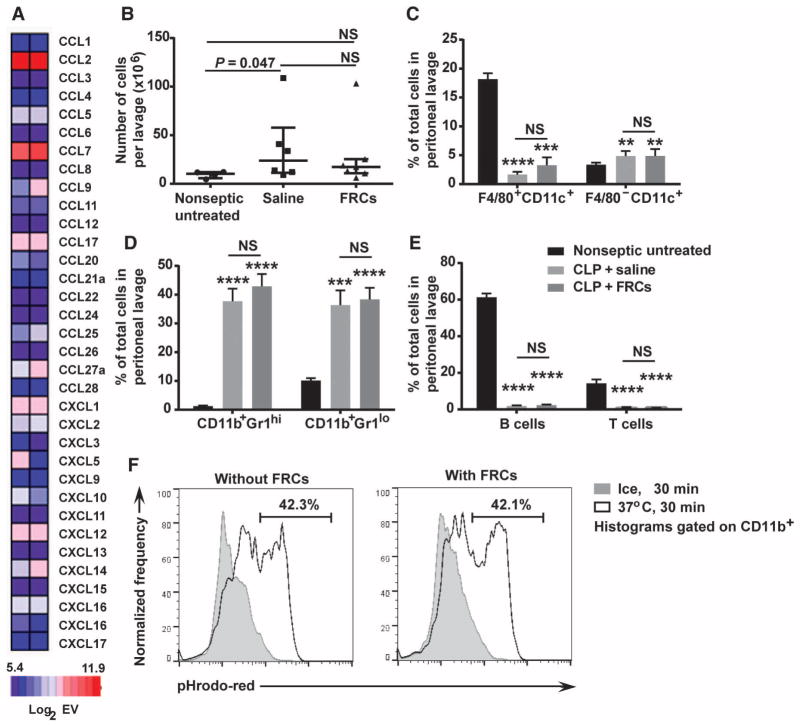
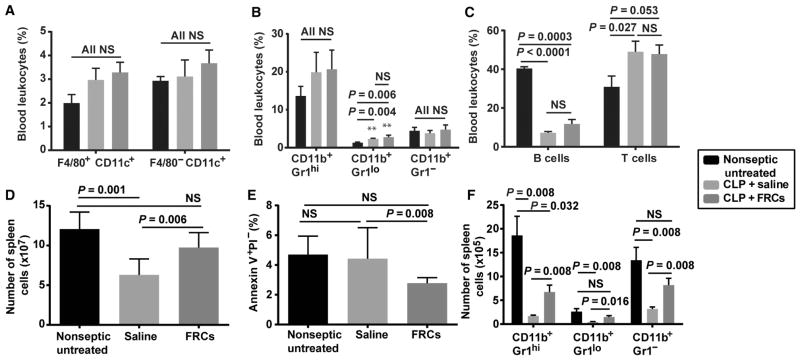
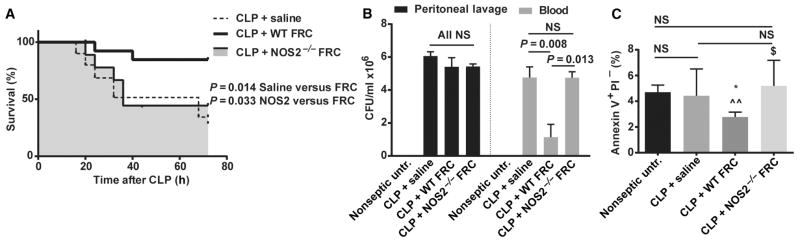
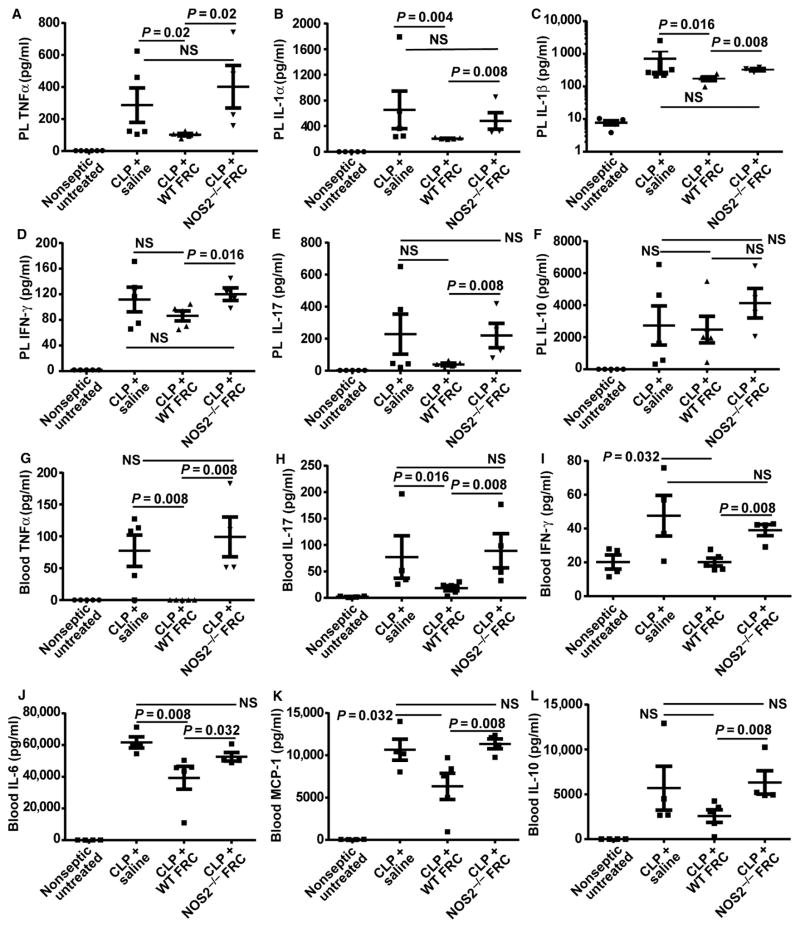
Sepsis is an aggressive inflammatory syndrome and a global health burden estimated to kill 7.3 million people annually. Single-target molecular therapies have not addressed the multiple disease pathways triggered by septic injury. Cell therapies might offer a broader set of mechanisms of action that benefit complex, multifocal disease processes. We describe a population of immune-specialized myofibroblasts derived from lymph node tissue, termed fibroblastic reticular cells (FRCs). Because FRCs have an immunoregulatory function in lymph nodes, we hypothesized that ex vivo-expanded FRCs would control inflammation when administered therapeutically. Indeed, a single injection of ex vivo-expanded allogeneic FRCs reduced mortality in mouse models of sepsis when administered at early or late time points after septic onset. Mice treated with FRCs exhibited lower local and systemic concentrations of proinflammatory cytokines and reduced bacteremia. When administered 4 hours after induction of lipopolysaccharide endotoxemia, or cecal ligation and puncture (CLP) sepsis in mice, FRCs reduced deaths by at least 70%. When administered late in disease (16 hours after CLP), FRCs still conveyed a robust survival advantage (44% survival compared to 0% for controls). FRC therapy was dependent on the metabolic activity of nitric oxide synthase 2 (NOS2) as the primary molecular mechanism of drug action in the mice. Together, these data describe a new anti-inflammatory cell type and provide preclinical evidence for therapeutic efficacy in severe sepsis that warrants further translational study.


Conflict of interest statement

Competing interests: B.P. has an equity interest in Sentien Biotechnologies Inc., which develops cell therapeutics and has an option to license relevant patents generated by B.P. that may lead to financial benefits. A.L.F., S.J.T., and B.P. are inventors on a patent application related to this work.

Figures

Fig. 1
Fig. 1. Therapeutically administered FRCs impart a survival benefit after LPS endotoxemia or CLP sepsis induction
In all experiments, stated groups received a single intraperitoneal dose of FRCs ex vivo expanded from sex-matched mice or saline (vehicle alone control). All CLP mice received standard of care, that is, antibiotics administered from the time of FRC administration and maintained throughout the experiment, and fluid resuscitation at the time of surgery. (A) Schematic timeline of experimental setup and analyses for LPS and CLP sepsis studies. LN, lymph node. (B) C57BL6 mice aged 4 to 6 weeks received 350 μg of LPS in saline intraperitoneally. Four hours later, mice received 1 × 10⁶ syngeneic C57BL6-derived FRCs (n = 5), bone marrow MSCs (n = 7), or vehicle (saline, n = 5) intraperitoneally and were monitored for survival. (C) Aged C57BL6 mice (18 to 24 months age-matched between groups) received 150 μg of LPS intraperitoneally, and 4 hours later, this was followed by a single intraperitoneal injection of 1 × 10⁶ syngeneic FRCs derived from 4- to 6-week-old C57BL6 mice (n = 6) or vehicle (saline, n = 10). Mice were monitored for survival. (D) CLP sepsis was induced in C57BL6 mice aged 4 to 6 weeks. Four hours later, mice received a single dose of 1 × 10⁶ autologous FRCs (n = 5) or vehicle (saline, n = 13) intraperitoneally. (E) CLP sepsis was induced in BALB/c mice aged 4 to 6 weeks. Mice received a single dose of allogeneic C57BL6-derived FRCs (n = 18), bone marrow MSCs (n = 7), or vehicle (saline, n = 21) intraperitoneally at 4 hours and were monitored for survival. (F) BALB/c mice aged 4 to 6 weeks received a single dose of 1 × 10⁶ allogeneic C57BL6-derived FRCs (n = 9) or saline (n = 10) intraperitoneally 16 hours after CLP surgery. Mice were monitored for survival. All data depict a minimum of two independent experiments. The log-rank (Mantel-Cox) test was used to test for significance. Arrows depict the time of cell administration.
Fig. 2
Fig. 2. FRC treatment of CLP sepsis inhibits bacteremia in vivo
BALB/c mice aged 4 to 6 weeks received CLP sepsis, followed 4 hours later by intraperitoneal injection of a single dose (1 × 10⁶) of allogeneic C57BL6-derived FRCs or saline (vehicle alone control). Nonseptic untreated mice are also shown. Septic mice received standard of care, including antibiotics administered from the time of FRC treatment and fluid resuscitation after surgery. (A and B) Peritoneal lavage (A) and blood samples (B) were taken 16 hours after surgery. Bacterial colony-forming units (CFUs) were calculated from serially diluted samples of (A) peritoneal lavage fluid and (B) blood. Mean ± SEM is shown. Peritoneal samples: n = 4 untreated, n = 5 saline-treated, n = 5 FRC-treated. Blood samples: n = 5 untreated, n = 6 saline-treated, n = 10 FRC-treated. Data depict three to five different experiments. Statistical analysis was performed using the Mann-Whitney U test, comparing saline- versus FRC-treated groups. NS, not statistically significant.
Fig. 3
Fig. 3. FRCs are retained in the peritoneum
(A) Mice received 350 μg of LPS 4 hours before intraperitoneal injection of 1 × 10⁶ allogeneic FRCs. Mice then received 4.5 mg of luciferin intraperitoneally and were imaged every 5 min for 45 min or until peak luminescence was reached. The maximum luminescence for each mouse over the imaging period was then recorded. The same maximum and minimum acquisition settings were used for all time points. Images depict FRC luminescence and localization in anesthetized recipient mice over time. Two mice most closely representing the group average are depicted (n = 5 mice per group). (B) Maximum luminescence over the imaging period was recorded for each mouse at each time point. Bars represent mean ± SEM (n = 3 mice per experiment). (C and D) Mice received 350 μg of LPS 4 hours before intraperitoneal injection of 1 × 10⁶ allogeneic antibody-labeled FRCs or saline (no stroma control). Blood (C) and spleen (D) were harvested after 1 h, 8 h, or 24 h. Donor FRCs were identified using flow cytometry. n = 2 (no stroma), n = 3 (1 h time point), n = 3 (8 h time point), n = 3 (24 h time point). Bars represent mean ± SEM.
Fig. 4
Fig. 4. FRCs do not alter peritoneal immune cell migration or effector function
(A) RNA was extracted from two independent purified FRC cultures and sent for cDNA microarray analysis. The heat map measures selected chemokines, depicted as log2 of the mRNA expression value (EV). Log2EV of 6.9 represents the post-normalization threshold for expression. Dark blue represents nonexpression, whereas light blue, pink, and red depict increasing levels of expression. (B) BALB/c mice aged 4 to 6 weeks received CLP sepsis, followed 4 hours later by intraperitoneal injection of a single dose (1 × 10⁶) of allogeneic C57BL6-derived FRCs or saline (vehicle alone control). Results with nonseptic untreated (healthy) mice are also shown. Septic mice received standard of care, including antibiotics administered from the time of FRC treatment and fluid resuscitation after surgery. Peritoneal lavage samples were taken 16 hours after surgery. Peritoneal lavage leukocyte counts are shown along with means (bars) ± SEM (n = 4 untreated, n = 6 saline-treated, and n = 7 FRC-treated mice). (C and D) Two myeloid cell subsets (%) in peritoneal lavage fluid are shown [n = 9 mice for untreated (black), n = 9 mice for saline-treated (light gray), and n = 10 mice for FRC-treated (dark gray) groups]; results are from three to four independent experiments. (E) B and T lymphocyte subsets (%) from peritoneal lavage fluid are shown (n = 9 for untreated, n = 9 for saline-treated, and n = 10 for FRC-treated mice; results are from three to four independent experiments). **P < 0.01, ***P < 0.001, ****P < 0.0001, untreated compared to FRC-treated mice, using the Mann-Whitney U test. (F) Splenocytes and purified mouse FRCs were cocultured with pHrodo Red–labeled E. coli conjugates for 30 min at 37°C (gray) or on ice (white). Cells were analyzed using flow cytometry. Histograms depict the percentage of CD11b+ cells that are pHrodo Red–positive. Histograms represent two independent experiments. NS, not significantly different.
Fig. 5
Fig. 5. FRC treatment prevents sepsis-associated reduction in splenic leukocyte populations
BALB/c mice aged 4 to 6 weeks received CLP sepsis, followed 4 hours later by a single dose (1 × 10⁶) of allogeneic C57BL6-derived FRCs or saline (vehicle alone control). Results for nonseptic untreated (healthy) mice are also shown. Septic mice received standard of care, including antibiotics administered from the time of FRC treatment and fluid resuscitation after surgery. Sixteen hours after CLP, mice were humanely killed, blood and spleens were harvested for flow cytometric assessment, and results were compared to untreated (nonseptic) controls. (A) Percentage of CD11c+ and F4/80+ myeloid subsets from blood [n = 4 mice for untreated (black) and saline-treated (light gray) groups; n = 5 mice for FRC-treated (dark gray) group]. (B) Expression of Gr1 and CD11b on F4/80CD11c leukocytes isolated from blood (n = 9 mice for the untreated, saline-treated, and FRC-treated groups). (C) Percentage of T and B cells in blood (n = 9 untreated, n = 8 saline-treated, and n = 10 FRC-treated groups). (D) Total number of spleen cells (n = 6 mice for untreated and n = 7 mice for saline- and FRC-treated groups). (E) Percentage of apoptotic (annexin V+PI) splenocytes (n = 5 mice for untreated, saline-treated, and FRC-treated groups). (F) Expression of Gr1 and CD11b on F4/80CD11c leukocytes isolated from spleens (n = 4 mice for untreated and saline-treated groups and n = 5 mice for the FRC-treated group). Bars depict means ± SEM and represent at least two independent experiments. Statistical significance was assessed using a two-tailed Mann-Whitney U test for nonparametric data. NS, not statistically significant.
Fig. 6
Fig. 6. Survival effects of FRC therapy are dependent on NOS2
BALB/c mice aged 4 to 6 weeks received CLP sepsis, followed 4 hours later by intraperitoneal injection of a single dose (1 × 10⁶) of allogeneic C57BL6-derived FRCs (n = 18), NOS2−/− FRCs (n = 9), or saline (vehicle alone control, n = 10). Results with untreated (nonseptic) mice are shown for comparison. Septic mice received standard of care, including antibiotics administered from the time of FRC treatment and fluid resuscitation after surgery. (A) Mice were monitored for survival, and the groups were compared for statistically significant differences using the log-rank (Mantel-Cox) test. Data represent a minimum of two independent experiments. (B) Serum and peritoneal lavage samples were taken 16 hours after CLP surgery. Bacterial CFUs were calculated from serially diluted samples of blood and peritoneal lavage. Means ± SEM are shown. Peritoneal samples: n = 4 mice for the untreated group, n = 5 mice for the saline-treated group, n = 5 mice for the FRC-treated group, and n = 4 mice for the NOS2−/− FRC–treated group. Blood samples: n = 5 mice for the untreated group, n = 6 mice for the saline-treated group, n = 10 mice for the FRC-treated group, and n = 4 mice for the NOS2−/− FRC–treated group. Data depict results from two to five experiments. Statistical analysis was performed using the Mann-Whitney U test, comparing saline- versus FRC-treated groups. (C) The percentage of apoptotic splenocytes was calculated from flow cytometric staining of samples taken 16 hours after CLP. *P < 0.05 for FRC-treated mice compared to untreated; ^^P < 0.01 for FRC-treated mice compared to saline-treated mice; $P < 0.05 for NOS2−/− FRC–treated mice compared to FRC-treated mice, all calculated using the Mann-Whitney U test. n = 5 mice for the untreated, saline-treated, and FRC-treated groups; n = 4 mice for the NOS2−/−FRC–treated group. NS, not statistically significant. Data depicted are from two independent experiments. For clarity of comparison, CLP-saline and CLP-FRC data points in this figure are also depicted in Figs. 1E, 2, and 5D. WT, wild type.
Fig. 7
Fig. 7. FRCs reduce expression of proinflammatory cytokines in the peritoneum and blood in a NOS2-dependent manner
BALB/c mice aged 4 to 6 weeks received CLP sepsis, followed 4 hours later by an intraperitoneal injection of a single dose (1 × 10⁶) of allogeneic C57BL6-derived FRCs, NOS2−/− FRCs, or saline (vehicle alone control). Results for untreated (healthy nonseptic) mice are shown for comparison. Septic mice received standard of care, including antibiotics administered from the time of FRC treatment and fluid resuscitation after surgery. (A to L) Peritoneal lavage (PL) and blood samples were obtained 16 hours after CLP and analyzed using the Luminex multiplex platform, examining concentrations of (A) PL TNFα, (B) PL IL-1α, (C) PL IL-1β, (D) IFN-γ, (E) IL-17, (F) IL-10, (G) blood TNFα, (H) blood IL-17, (I) blood IFN-γ, (J) blood IL-6, (K) blood MCP-1, and (L) blood IL-10. Bars represent means ± SEM. PL, all groups: n = 5 mice. Blood: n = 4 mice for untreated, saline-treated, and NOS2−/− FRC–treated groups; n = 5 mice for FRC-treated groups. The data shown are compiled from two independent experiments. Groups were compared using a one-tailed Mann-Whitney U test for nonparametric data. NS, not significantly different.

References

    1. Carney DE, Matsushima K, Frankel HL. Treatment of sepsis in the surgical intensive care unit. Isr Med Assoc J. 2011;13:694–699. - PubMed
    1. Daniels R. Surviving the first hours in sepsis: Getting the basics right (an intensivist’s perspective) J Antimicrob Chemother. 2011;66(Suppl 2):ii11–ii23. - PubMed
    1. Angus DC, Linde-Zwirble WT, Lidicker J, Clermont G, Carcillo J, Pinsky MR. Epidemiology of severe sepsis in the United States: Analysis of incidence, outcome, and associated costs of care. Crit Care Med. 2001;29:1303–1310. - PubMed
    1. Hall MJ, Williams SN, DeFrances CJ, Golosinskiy MS. Inpatient Care for Septicemia or Sepsis: A Challenge for Patients and Hospitals. National Center for Health Statistics; Hyattsville, MD: 2011. - PubMed
    1. Ferlay J, Shin HR, Bray F, Forman D, Mathers C, Parkin DM. GLOBOCAN 2008 v.2.0. Cancer Incidence and Mortality Worldwide: IARC CancerBase No. 10. http://globocan.iarc.fr.

Publication types

MeSH terms

LinkOut - more resources