. 2014 Dec 1;112(11):2756-78.
doi: 10.1152/jn.00350.2014. Epub 2014 Aug 13.

Increased intrinsic excitability of muscle vasoconstrictor preganglionic neurons may contribute to the elevated sympathetic activity in hypertensive rats

Affiliations

Increased intrinsic excitability of muscle vasoconstrictor preganglionic neurons may contribute to the elevated sympathetic activity in hypertensive rats

Linford J B Briant et al. J Neurophysiol. .

Abstract

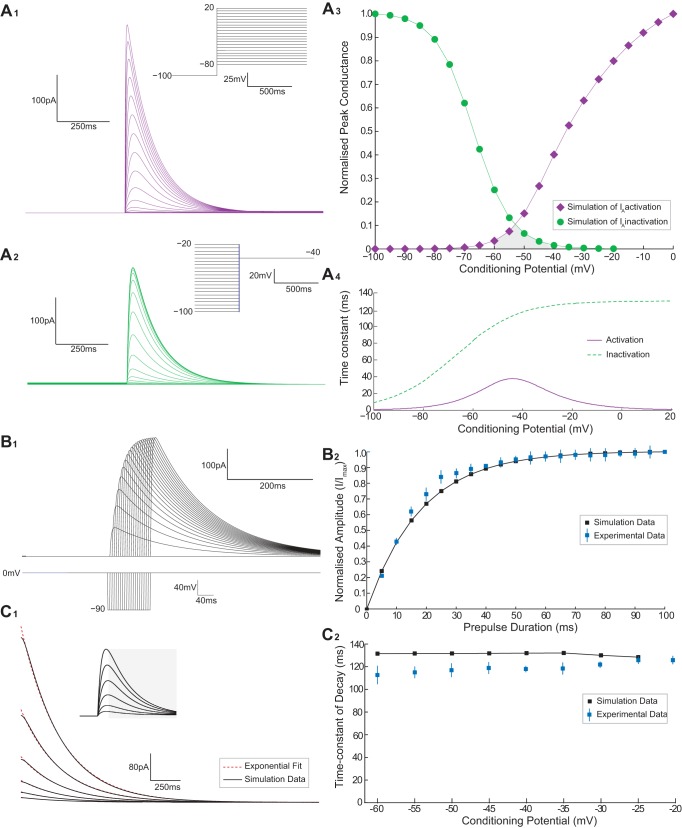
Hypertension is associated with pathologically increased sympathetic drive to the vasculature. This has been attributed to increased excitatory drive to sympathetic preganglionic neurons (SPN) from brainstem cardiovascular control centers. However, there is also evidence supporting increased intrinsic excitability of SPN. To test this hypothesis, we made whole cell recordings of muscle vasoconstrictor-like (MVClike) SPN in the working-heart brainstem preparation of spontaneously hypertensive (SH) and normotensive Wistar-Kyoto (WKY) rats. The MVClike SPN have a higher spontaneous firing frequency in the SH rat (3.85 ± 0.4 vs. 2.44 ± 0.4 Hz in WKY; P = 0.011) with greater respiratory modulation of their activity. The action potentials of SH SPN had smaller, shorter afterhyperpolarizations (AHPs) and showed diminished transient rectification indicating suppression of an A-type potassium conductance (IA). We developed mathematical models of the SPN to establish if changes in their intrinsic properties in SH rats could account for their altered firing. Reduction of the maximal conductance density of IA by 15-30% changed the excitability and output of the model from the WKY to a SH profile, with increased firing frequency, amplified respiratory modulation, and smaller AHPs. This change in output is predominantly a consequence of altered synaptic integration. Consistent with these in silico predictions, we found that intrathecal 4-aminopyridine (4-AP) increased sympathetic nerve activity, elevated perfusion pressure, and augmented Traube-Hering waves. Our findings indicate that IA acts as a powerful filter on incoming synaptic drive to SPN and that its diminution in the SH rat is potentially sufficient to account for the increased sympathetic output underlying hypertension.

Keywords: hypertension; sympathetic preganglionic; transient rectification; vasomotor tone.


Figures

Fig. 1.
Fig. 1.
Increased activity of muscle vasoconstrictor (MVClike) sympathetic preganglionic neurons (SPN) in spontaneously hypertensive (SH) rats. MVClike SPN of Wistar-Kyoto (WKY) (A) and SH rats (B) both exhibited respiratory modulation of discharge entrained to phrenic nerve activity (PNA), but the SH SPN has an increased firing frequency with larger respiratory modulated bursts occurring in the I and PI phase. C: MVClike SPN of the SH rat had a higher mean firing frequency [SH 3.85 ± 0.39 Hz (n = 23) vs. WKY 2.44 ± 0.35 Hz, WKY (n = 22); *P = 0.01, t-test]. D and E: phase histograms of MVClike SPN discharge across strains showed a pattern of respiratory modulation of activity (firing activity over the respiratory cycle apportioned into eight 45° bins; WKY n = 19, SH n = 20 SPN, activity averaged from 10 respiratory cycles for each cell). The grouped WKY MVClike SPN activity had clear respiratory modulation (one-way ANOVA, P = 0.002; n = 19) with a peak of discharge in the 45° bin (I phase; ††P < 0.01) compared with the trough during 225° (ME phase) and also the 135°, 180°, and −45/315° bins (†P < 0.05). E: similarly, the SH MVClike SPN also showed respiratory modulation (one-way ANOVA, P < 0.001; n = 20) with a peak at 45° compared with the trough at 135° (†††P < 0.001). The trough now begins 90° earlier (compared to WKY), and the ramp up in activity to the peak starts earlier in the cycle. Comparison across strains showed both strain and phase were significant sources of variation [phase (P < 0.0001) and strain (P < 0.01) with an interaction P < 0.01, two-way mixed measures ANOVA] with a significant increase in the peak seen particularly in the 45° bin in the SH rat (***P < 0.001, Bonferroni post hoc test). Post hoc testing also showed higher basal firing level (shaded) in the SH rats (trough-to-trough, *P < 0.05, t-test). F: degree of respiratory modulation of MVClike activity as peak-to-trough difference in spike count across the bins was significantly larger in the SH rats [WKY = 0.73 ± 0.11 spikes/bin (n = 19) vs. 1.74 ± 0.32 spikes/bin (n = 20); **P = 0.009, t-test].
Fig. 2.
Fig. 2.
Reduction in afterhyperpolarization (AHP) of MVClike SPN in SH rats. A: action potential waveforms from a representative WKY (blue) and SH (red) MVClike SPN (average of 10 spikes ± SE) showing reduced AHP amplitude and duration. B and C: across the population the SH rat MVClike SPN had shorter [120.8 ± 10.8 (n = 23) vs. 179.6 ± 19.5 ms (n = 22); *P = 0.01], smaller AHPs [14.6 ± 0.34 mV (n = 23) vs. 17.7 ± 0.71 mV (n = 22); ***P = 0.0002].
Fig. 3.
Fig. 3.
Diminished transient rectification in MVClike SPN of SH rats. A: voltage responses of a MVClike SPN of a WKY rat to family of hyperpolarizing current pulses. At the offset of hyperpolarizations greater than −75 mV, a clear repolarization inflection point was seen in the decay trajectory (arrow; VRI). This signaled the activation of the transient rectification (IA), which delayed repolarization and suppressed the firing activity of the cell. B: VRI occurred at a more hyperpolarized level in WKY (B1), than the SH rat (B2). C1: grouped VRI data (measured on repolarization from a potential of < −75 mV) showing it occurred at a more hyperpolarized level in WKY compared with SH rats [WKY = −62.4 ± 1.7 mV (n = 18); SH = −55.3 ± 1.1 mV (n = 12); P = 0.0043]. C2: time-to-first-spike (measured from the release of the hyperpolarizing current pulse) was shorter in the SH rat [WKY 577 ± 132 ms (n = 16) vs. SH 213 ± 53 ms (n = 12); **P < 0.0001].
Fig. 4.
Fig. 4.
Model of an MVClike SPN and comparison of electrophysiology to WKY data. A: schematic morphology of a SPN in the lateral horn of the spinal cord showing its position in the lateral horn, dendritic tree, and axon heading toward the ventral root. B: morphology of the SPN defined in NEURON with the distribution of ion conductances; the dendrites were passive and the axon had 4 voltage-dependent conductances (INa3, IDR, ICaL, and ICaN). C: soma schematic showing conductances, intracellular buffers, and membrane mechanisms. D: membrane potential responses of the model to current pulse injections (1-s duration). Note the delay to firing (†) and the repolarization inflection (VRI) on return to rest after hyperpolarization (*). E: action potential firing was triggered in the model with a small current pulse (5 pA). The model spike threshold, AHP amplitude, AHP duration (arrow), and resting membrane potential (RMP) are all within a standard deviation of the experimental data for MVClike SPN in WKY rats (full comparison in Table 3). F: firing frequency of the model to depolarizing current pulse injection fits the experimental data from MVClike SPN in WKY 10 pA (2.4 ± 0.6 Hz; n = 19), 20 pA (4.8 ± 2 Hz; n = 5), 30 pA (7.2 ± 1 Hz; n = 20), and 50 pA (10.5 ± 10.9 Hz; n = 11); response to current pulse injection for 1 s.
Fig. 5.
Fig. 5.
Influence of IA on membrane excitability of the model. Reducing the maximum conductance density (A) alters the excitability of the model in a manner consistent with the SH data. A: step current pulses (1-s duration) were injected into the model cell from a potential of −50 mV, to hyperpolarize the cell to −100 mV to measure VRI. A1: as A was reduced from 12 to 6 mS/cm2, VRI shifted in a depolarizing direction (∼5 mV). A2: relationship between A and VRI showed that reduction of A moved the level of VRI from the WKY to SH range (shaded regions). B: AHP amplitude and duration in the model was measured from action potential waveforms generated from excitatory input [excitatory postsynaptic currents (EPSCs) recorded experimentally see Fig. 6]. Decreasing A from 10.5 mS/cm2 reduced the AHP amplitude (C) and duration (D) from the range of WKY MVClike SPN to values in the range seen in SH rats (shaded regions).
Fig. 6.
Fig. 6.
IA shapes the output of the model. The model was challenged with a train of EPSCs [recorded in voltage-clamp (−53 mV) from a WKY rat MVClike SPN over 100 s]. The output of the model (firing and pattern) was monitored as the A was reduced. A: for high A (8 mS/cm2), the model produced a low average firing frequency (1.8 Hz) with a degree of respiratory modulation (peak-to-trough = 10 spikes), consistent with the WKY data. B: as A was reduced (to 6 mS/cm2), the average firing frequency (4.7 Hz) and degree of respiratory modulation (14 spikes) increased, as seen in the SH group. Graded reductions of A produced a monotonic increase in the firing frequency (C) and respiratory-coupling (D) of the model into the ranges seen experimentally across the strains (shaded regions).
Fig. 7.
Fig. 7.
SPN output characteristic is reconfigured by A. A: pattern of discharge of the model, in response to a common EPSC drive recorded from a WKY MVClike neuron (top trace), was closely comparable to that of experimentally recorded cells across strains. The frequency and respiratory modulation of firing increased in the model as A was reduced (down the column). BD: experimental recordings of MVClike SPN. With higher values of A, the model exhibited strikingly similar discharge patterns to that seen in WKY MVClike SPN (#1), whereas with low values of A the model output more closely resembled recordings from SH rats (#2 and #3). E: firing frequency of recorded MVClike SPN plotted as a function of VRI for WKY (n = 18) and SH (n = 12). The WKY data were fit with a linear regression (R2 = 0.35) showing a positive correlation between VRI and the spontaneous firing frequency. F: using the model we tested whether the effect of A altered the frequency of threshold crossing synaptic events (generated from the EPSC train in A) by inactivating the sodium conductance to prevent action potential discharge. Comparison of the numbers of action potentials with the number of suprathreshold synaptic events revealed a close linkage across A indicating that the major influence of the A conductance on discharge is through altered synaptic integration rather than by an action on the AHP. We also used the model to investigate the effect of altering A on the number of underlying threshold crossing synaptic events (with sodium spiking inactivated) vs. the number of action potentials discharged to see whether its influence on firing frequency was via an action on synaptic integration or upon the after hyperpolarization (F). The event counts [excitatory postsynaptic potentials (EPSPs) and action potentials] under each condition follow a very similar relationship indicating that it is an increase in the number of threshold crossing events that drives the majority of the change in firing rather than a shortening of the refractory period after an action potential.
Fig. 8.
Fig. 8.
Synaptic input to MVClike SPN in WKY and SH rats. MVClike SPN in WKY (n = 7) and SH (n = 6) rats were voltage clamped close to rest (−53 mV) to record the spontaneously ongoing EPSCs. A: EPSCs incoming to an MVClike SPN in a WKY (A1) and SH rat (A2). Over a 10-s period of recording, putative EPSCs were located using a peak-find algorithm (with a rise time of >1 ms and amplitude >10 pA in spike 2; B). The resultant output was manually validated against the raw data, and individual peaks were verified (shown expanded below with event trains). B1: frequency of incoming EPSCs of magnitude >10 pA was no different across the strains (WKY = 14.6 ± 3.4 Hz; SH = 12.7 ± 3.4 Hz; P = 0.71). B2: proportional amplitude distribution of incoming events was no different across the strains (data from recordings of 6 MVClike SPN per strain, binned into 10- to 20-, 20- to 30-, 30- to 40-, or >40-pA events and expressed as a proportion of the total number of events over a 10-s period, two-way ANOVA with Bonferroni post hoc tests). C: mean holding current over the recording was no different across the strains (WKY = −49.6 ± 12.4 pA; SH = −56.6 ± 13 pA; P = 0.71). D: magnitude of the respiratory modulated burst of synaptics was quantified by integrating the current during inspiration. A greater synaptic charge transfer was apparent in the SH rat but did not reach significance (P = 0.104). E: model was challenged with EPSC traces taken from each strain [50-s duration; 2 WKY (blue), 2 SH (red dashed)]. The output discharge of the model, and its relationship to A, was seen to be relatively independent to the strain of origin of the EPSCs.
Fig. 9.
Fig. 9.
IA functions as a low-pass filter of incoming EPSPs. The influence of IA on synaptic integration in the model was investigated. A: injecting a point synaptic conductance (a double-exponential with rise time of 1.5 ms and decay time of 2 ms) produced an EPSP with a profile typical of those recorded in SPN (Spanswick et al. 1998). As was reduced from 12 to 6 mS/cm2, the time constant of decay increased considerably (A2), whereas EPSP amplitude increased only marginally (<5%; A3); this effect is explained by the relatively slow activation of the A conductance as indicated beneath where the peak conductance change occurs after the peak of the EPSP. B: to assess the influence of A on synaptic summation 2 EPSPs were delivered at varying intervals (B2). For A = 6 mS/cm2, the gain of the 2nd pulse (as a ratio of the single pulse height) increased with frequency (B1). For A = 12 mS/cm2, gain was suppressed (i.e., <1) at high frequencies (10–45 Hz) and was unitary at low frequencies (<10 Hz). This suppression of gain is due to the influence of IA on the decay of the EPSP. C: an experimentally recorded EPSC train (1 respiratory cycle) was injected into the model, and the output generated was converted into a spike train. For high values of A, the model filters out the synaptics incoming at high-frequency during the inspiratory phase. As A was reduced, the model transforms more of the high-frequency events during the I phase into action potentials, and the respiratory-modulated burst increases in amplitude and starts earlier in the cycle.
Fig. 10.
Fig. 10.
Intrathecal 4-aminopyridine (4-AP) increases thoracic sympathetic nerve activity (tSNA) in WKY rats. Recordings of tSNA alongside phrenic and perfusion pressure were made from DAPR of WKY rats (n = 5). A: intrathecal 4-AP (100-mM bolus) increased tSNA by blocking spinal IA. The perfusion pressure was increased due to the increased sympathetic outflow causing vasoconstriction. In addition the respiratory related fluctuation in perfusion pressure (Traube-Hering wave) was also increased in amplitude, as shown in the PNA-triggered average waveforms insets. B: mean tSNA in control conditions (37.7 ± 10.2 μV) increased (49.7 ± 13.5 μV; *P = 0.03) following 4-AP administration. This highlights the importance of the A-current in regulating spinal sympathetic tone. C: Traube-Hering wave amplitude (0.37 ± 0.15 mmHg) also increased (0.99 ± 0.26 mmHg; **P < 0.01), suggesting amplified respiratory-sympathetic coupling.
Fig. A1.
Fig. A1.
Comparison of model A-current kinetics with experimental data. A1: voltage-dependent activation investigated by applying depolarizing voltage steps from a holding potential of −100 mV. A2: steady-state inactivation was investigated with a voltage-step command to −40 mV applied from holding potentials of −100 to −20 mV. A3: plot of the activation (diamonds) and steady-state inactivation (circles) of IA, expressed as the normalized peak conductance, as a function of the conditioning potential. Note the shaded window current with amplitude 0.1 open probability. A4: plot of the time constants of activation and inactivation in the model as a function of conditioning potential. B1: rate of recovery from inactivation of IA was tested by holding at zero to completely inactivate, then applying a hyperpolarizing voltage prepulse to −90 mV of varying duration (2–100 ms) before stepping back to 0 mV. B2: normalized peak conductances (black squares), plotted as a function of recovery interval, fit the experimental data (blue squares). C: decay time course of model IA fits the experimental data. C1: same conductance traces as shown in A2 with single exponential fits (dashed lines) to the decay profile (R2 > 0.95). C2: decay time constant of these single exponential fits, plotted as a function of the conditioning potential. Note the difference between the time constants in the model (black squares) and experimental data (blue squares) is small (≤15%). [Experimental data replotted with permission from Whyment et al. (2011) (Fig. 2) and are expressed as means ± SE.]
Fig. A2.
Fig. A2.
Sensitivity of model to IA parameters. A: summary of experimental data: MVClike SPN in the SH rat exhibited increased firing frequency, a more depolarized repolarization inflection point (VRI) and decreased AHP amplitude and duration. We sought IA parameters that could recapitulate these features. BE: model output (firing frequency) as a function of IA steady-state parameters was investigated by injecting a train of experimentally recorded EPSCs from a WKY rat (Fig. 6). AHP morphology was measured following a brief (0.5 ms) large amplitude (2 nA) current pulse. Altering V½,l (B), V½,n (C), ζl (D), and ζl (E) could not parsimoniously reproduce the pattern of altered SPN excitability recorded across the strains.

References

    1. Abbott SB, Stornetta RL, Socolovsky CS, West GH, Guyenet PG. Photostimulation of channelrhodopsin-2 expressing ventrolateral medullary neurons increases sympathetic nerve activity and blood pressure in rats. J Physiol 587: 5613–5631, 2009. - PMC - PubMed
    1. Barreiro AK, Thilo EL, Shea-Brown E. A-current and type I/type II transition determine collective spiking from common input. J Neurophysiol 108: 1631–1645, 2012. - PMC - PubMed
    1. Belugin S, Mifflin S. Transient voltage-dependent potassium currents are reduced in NTS neurons isolated from renal wrap hypertensive rats. J Neurophysiol 94: 3849–3859, 2005. - PubMed
    1. Bernard C, Anderson A, Becker A, Poolos NP, Beck H, Johnston D. Acquired dendritic channelopathy in temporal lobe epilepsy. Science 305: 532–535, 2004. - PubMed
    1. Bordey A, Feltz P, Trouslard J. Kinetics of A-currents in sympathetic preganglionic neurones and glial cells. Neuroreport 7: 37–40, 1995. - PubMed

Publication types

MeSH terms

Substances

LinkOut - more resources