. 2014 Oct;88(20):12098-111.
doi: 10.1128/JVI.01860-14. Epub 2014 Aug 13.

Increased replicative fitness can lead to decreased drug sensitivity of hepatitis C virus

Affiliations

Increased replicative fitness can lead to decreased drug sensitivity of hepatitis C virus

Julie Sheldon et al. J Virol. 2014 Oct.

Abstract

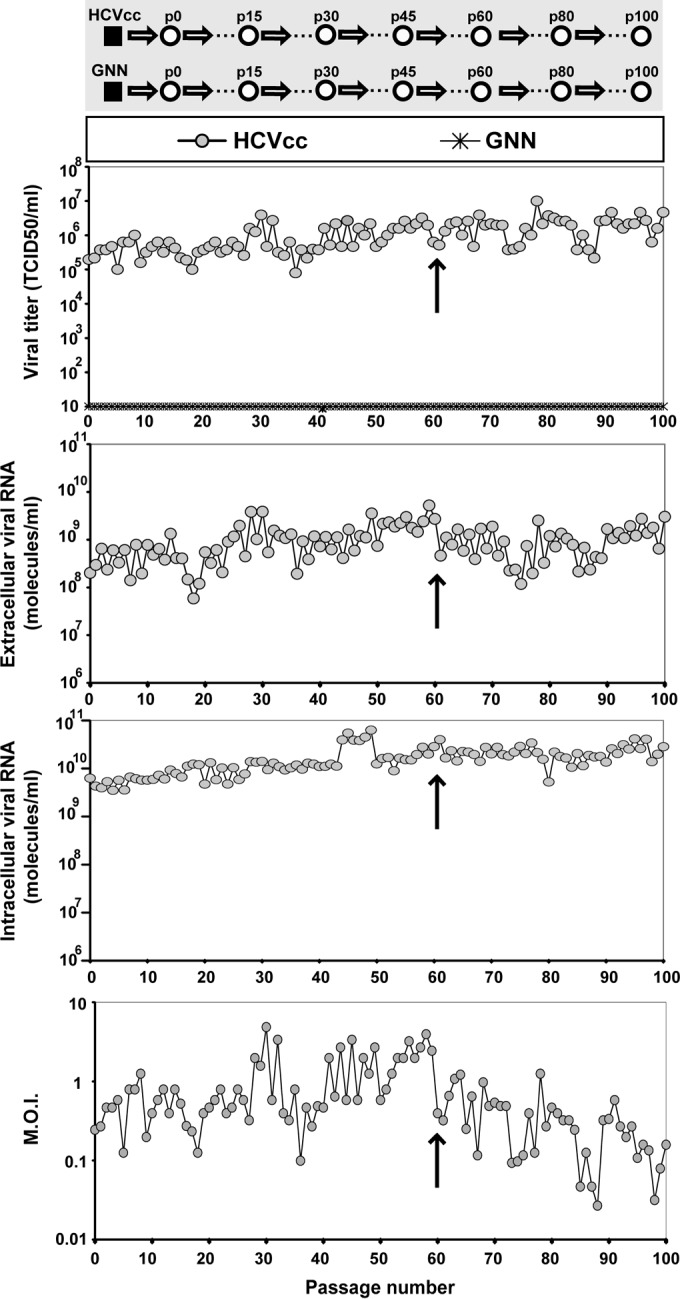
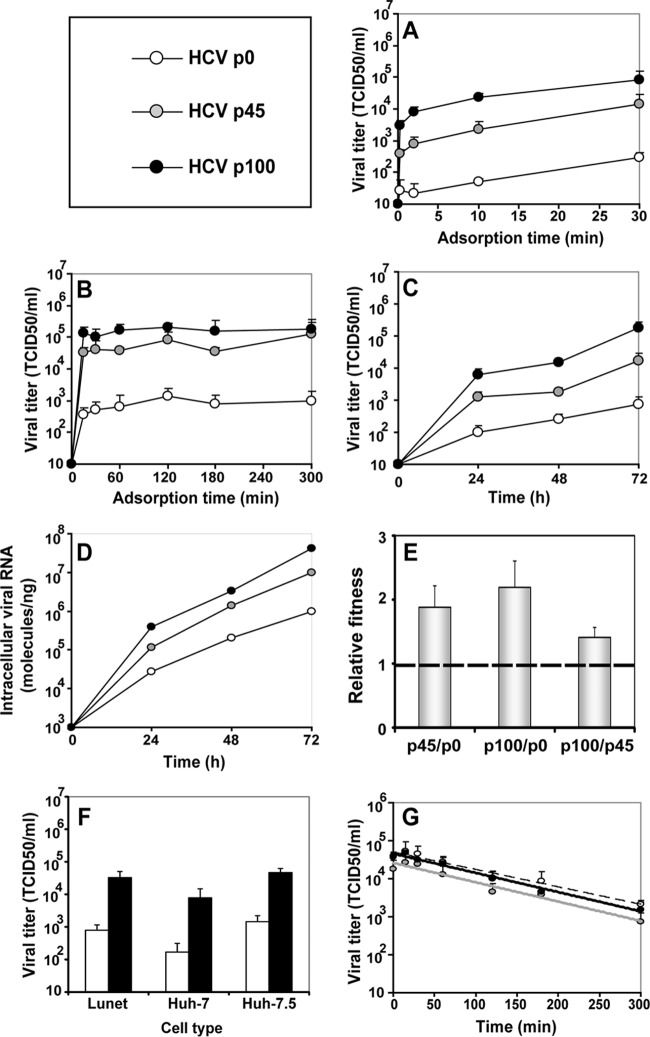
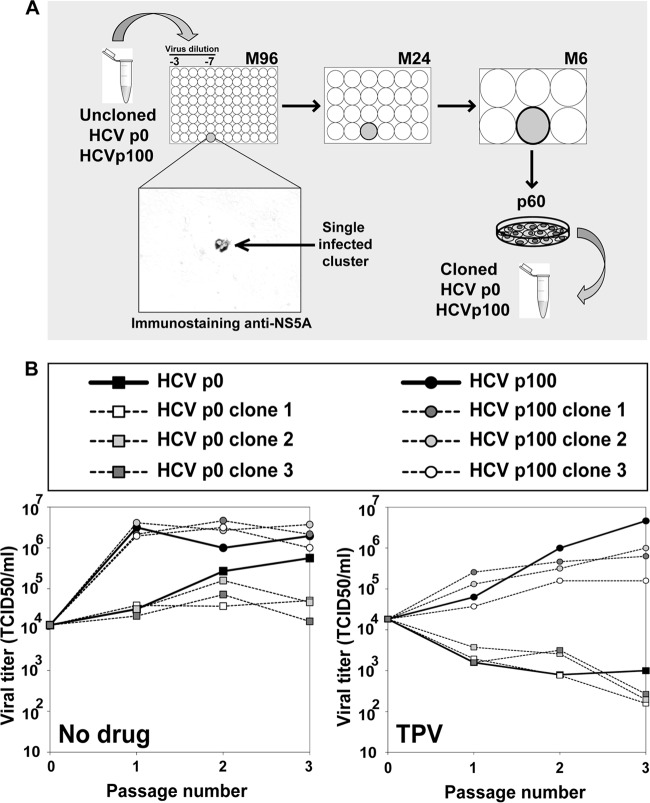
Passage of hepatitis C virus (HCV) in human hepatoma cells resulted in populations that displayed partial resistance to alpha interferon (IFN-α), telaprevir, daclatasvir, cyclosporine, and ribavirin, despite no prior exposure to these drugs. Mutant spectrum analyses and kinetics of virus production in the absence and presence of drugs indicate that resistance is not due to the presence of drug resistance mutations in the mutant spectrum of the initial or passaged populations but to increased replicative fitness acquired during passage. Fitness increases did not alter host factors that lead to shutoff of general host cell protein synthesis and preferential translation of HCV RNA. The results imply that viral replicative fitness is a mechanism of multidrug resistance in HCV. Importance: Viral drug resistance is usually attributed to the presence of amino acid substitutions in the protein targeted by the drug. In the present study with HCV, we show that high viral replicative fitness can confer a general drug resistance phenotype to the virus. The results exclude the possibility that genomes with drug resistance mutations are responsible for the observed phenotype. The fact that replicative fitness can be a determinant of multidrug resistance may explain why the virus is less sensitive to drug treatments in prolonged chronic HCV infections that favor increases in replicative fitness.


Figures

FIG 1
FIG 1
Evolution of HCV infectivity and RNA during 100 passages in cell culture. (Top gray panel) Scheme of the origin of HCV populations. The initial clonal population (HCVcc) obtained by electroporation of Lunet cells by an HCV transcript is depicted as a filled square, and subsequent population passages are represented by empty circles; GNN is a replication defective mutant of HCVcc used as negative control. (White panels) Infectious viral titers of the supernatants, extracellular and intracellular viral RNA levels (quantified by real-time RT-PCR), and multiplicity of infection (M.O.I.) as a function of passage number. The crosses in the abscissae of the first panel indicate measurements upon serial infection with mutant GNN. Arrows indicate the passage number (passage 60) after which the MOI was decreased to prevent cell lysis. The origin of HCV, conditions for infections, determination of HCV infectivity, and quantification of HCV RNA, as well as positive and negative controls included in the assays, are described in Materials and Methods.
FIG 2
FIG 2
Comparison of phenotypic traits of HCV p0, HCV p45, and HCV p100 (symbols in upper left box). (A and B) The effect of adsorption time on the yield of infectious progeny. Huh-7.5 cells were either mock infected or infected with HCV p0, HCV p45, or HCV p100 at an MOI of 0.03 TCID50/cell (4 × 10⁵ Huh-7.5 cells infected with 1.2 × 10⁴ TCID50). The virus was adsorbed to cells for the indicated times, the cells were washed twice with PBS, and DMEM was added to the monolayers. Infectivity levels in the cell culture supernatant were determined at 72 h postinfection. (C and D) HCV p0, HCV p45, and HCV p100 progeny production in Huh-7.5 cells. Infections were performed as described for panels A and B, using a 5-h adsorption period. Infectivity levels in the cell culture supernatant and intracellular viral RNA levels were determined at 72 h postinfection. (E) Relative fitness of HCV p0, HCV p45, and HCV p100. A single growth-competition experiment was performed by infecting Huh-7.5 cells with the viral mixtures indicated in the abscissa (MOI = 0.03 TCID50/cell). The relative amounts of the competing viruses were determined at 24, 48, and 72 h postinfection. Viral RNA present in the initial mixtures and at each passage was sequenced, and the proportions of the two competing populations were estimated and fitness data were calculated as detailed in Materials and Methods. Numerical values are given in Table S2 (http://www2.cbm.uam.es:8080/cv-303/SupplMatSheldon.pdf). (F) Infection of Lunet, Huh-7, and Huh-7.5 cells by HCV p0 and p100. Infections were performed as described for panels A and B, with a 5-h adsorption period. Infectivity levels in the cell culture supernatant were determined at 72 h postinfection. (G) Thermal stability of HCV p0, HCV p45, and HCV p100. Virus samples in DMEM were incubated at 45°C for the indicated amounts of time and titrated. Values are averages of the results of triplicate determinations. Procedures are further detailed in Materials and Methods.
FIG 3
FIG 3
Response of HCV p0, HCV p45, and HCV p100 to several antiviral agents. Huh-7.5 cells were either mock infected or infected with HCV p0, HCV p45, or HCV p100 at an MOI of 0.03 TCID50/cell (4 × 10⁵ Huh-7.5 cells infected with 1.2 × 10⁴ TCID50); the virus was adsorbed to cells for 5 h and the infection allowed to proceed for 72 h. Each of the populations was subjected to 10 passages in the absence or presence of IFN-α (HCV p45 passaged in the presence of 2 IU/ml and HCV p100 with 12 IU/ml, as previously described [45]), ribavirin (Rib) (50 μM), telaprevir (TPV) (600 nM), daclatasvir (DCV) (500 pM), or cyclosporine (CsA) (800 nM). The passages in the presence of IFN-α that had been previously described are included here for comparison. For the successive passages, the same numbers of cells were infected with the virus contained in 0.5 ml of the supernatant from the previous infection, maintaining the same drug concentration, and viral titers in the cell culture supernatants were determined. Parallel infections were carried out with HCV GNN as a negative control. Procedures are described in Materials and Methods.
FIG 4
FIG 4
Effect of MOI on the response of HCV p0 and HCV p100 to several antiviral agents in cell culture. Huh-7.5 cells were either mock infected or infected with HCV p0 or HCV p100 at an MOI of 0.03, 0.003, 0.0003, and 0.00003 TCID50/cell (top boxes) (4 × 10⁵ Huh-7.5 cells infected with 1.2 × 10⁴, 1.2 × 10³, 1.2 × 10², and 1.2 × 101 TCID50, respectively); the virus was adsorbed to cells for 5 h and the infection allowed to proceed for 72 h. Each of the populations was subjected to 3 passages in the absence or presence of telaprevir (TPV) (600 nM), cyclosporine (CsA) (800 nM), or ribavirin (Rib) (50 μM). For the successive passages, the same numbers of cells were infected with the virus contained in 0.5 ml of the supernatant from the previous infection, maintaining the same drug concentration. Viral titers in the cell culture supernatants were determined. Parallel infections were carried out with HCV GNN as a negative control. Procedures are described in Materials and Methods.
FIG 5
FIG 5
Replication of biological clones derived from HCV p0 and HCV p100 in the absence and presence of telaprevir. (A) Scheme of the procedure to obtain clonal preparations from populations of HCV p0 and HCV p100. Mild-detergent-treated virus was diluted and applied to M96 wells with a Huh-7.5 cell monolayer. Cell culture supernatant from wells with a single cluster of infected cells was used to infect Huh-7.5 cells in M24 wells, and the supernatant was again transferred to a M6 dish with Huh-7.5 cells. The final round of amplification consisted of infecting 5.2 × 10⁵ Huh-7.5 cells in a p60 dish under the standard conditions detailed in Materials and Methods. (B) Huh-7.5 cells were either mock infected or infected with uncloned populations HCV p0 and HCV p100, and with three biological clones from each population, at an MOI of 0.03 TCID50/cell (4 × 10⁵ Huh-7.5 cells infected with 1.2 × 10⁴ TCID50); the virus was adsorbed to cells for 5 h and the infection allowed to proceed for 72 h in the absence and presence of telaprevir (TPV; 600 nM). For the successive passages, the same numbers of cells were infected with the virus contained in 0.5 ml of the supernatant from the previous infection, maintaining the same drug concentration. Viral titers in the cell culture supernatants were determined. Parallel infections were carried out with HCV GNN as a negative control. Procedures are described in Materials and Methods.
FIG 6
FIG 6
Effect of HCV p0, HCV p45, and HCV p100 infection on host cell protein synthesis and translation initiation factors. (A) Huh-7.5 cell were either mock infected or infected with HCV p0, HCV p45, or HCV p100 at an MOI of 0.03 TCID50/cell (4 × 10⁵ Huh-7.5 cells infected with 1.2 × 10⁴ TCID50), and the virus was allowed to adsorb to cells for 5 h. At 24, 48, and 72 h postinfection (h.p.i), cells were labeled with [35S]Met-Cys for 1 h, and cell extracts were subjected to SDS-PAGE and visualized by autoradiography. The total amount of labeled protein was calculated by densitometry measurements of the corresponding autoradiograms and is expressed as a percentage of the amount of actin protein taken as 100%. (B) HCV protein expression at 24, 48, and 72 h postinfection. Infected Huh-7.5 protein extracts were those of the experiment described for panel A. HCV NS5A and core were stained by Western blotting using monoclonal antibodies specific for the proteins indicated on the right side of the panel. The amount of cellular proteins was normalized to the amount of actin, visualized by Western blotting (Actin panel). (C) Viral titers in the cell culture supernatants determined at 24, 48, and 72 h postinfection. (D) Effect of HCV infection (top of each lane) on some host factors involved in translation control. Huh-7.5 cells were infected as indicated for panel A, and at 48 and 72 h postinfection, cell extracts were analyzed by Western blotting using specific antibodies against eIF4G, eIF3a, eIF3b, eIF4B, PABP, and PTB proteins (as indicated to the right of each panel). (E) Phosphorylation levels of PKR and eIF2-α determined in the same protein extracts used as described for panels A, B, C, and D. Procedures are detailed in Materials and Methods.

References

    1. Suzuki F, Akuta N, Suzuki Y, Yatsuji H, Sezaki H, Arase Y, Kawamura Y, Hosaka T, Kobayashi M, Ikeda K, Kobayashi M, Watahiki S, Kumada H. 2007. Selection of a virus strain resistant to entecavir in a nucleoside-naive patient with hepatitis B of genotype H. J. Clin. Virol. 39:149–152. 10.1016/j.jcv.2007.03.004 - DOI - PubMed
    1. Domingo E. 1989. RNA virus evolution and the control of viral disease. Prog. Drug Res. 33:93–133 - PubMed
    1. Domingo E, Holland JJ. 1992. Complications of RNA heterogeneity for the engineering of virus vaccines and antiviral agents. Genet. Eng. (N Y) 14:13–31 - PubMed
    1. Le Moing V, Chene G, Carrieri MP, Alioum A, Brun-Vezinet F, Piroth L, Cassuto JP, Moatti JP, Raffi F, Leport C. 2002. Predictors of virological rebound in HIV-1-infected patients initiating a protease inhibitor-containing regimen. AIDS 16:21–29. 10.1097/00002030-200201040-00004 - DOI - PubMed
    1. Ribeiro RM, Bonhoeffer S. 2000. Production of resistant HIV mutants during antiretroviral therapy. Proc. Natl. Acad. Sci. U. S. A. 97:7681–7686. 10.1073/pnas.97.14.7681 - DOI - PMC - PubMed

Publication types

Substances