. 2014 Aug 13;34(33):10870-83.
doi: 10.1523/JNEUROSCI.4539-13.2014.

Sensory-evoked and spontaneous gamma and spindle bursts in neonatal rat motor cortex

Affiliations

Sensory-evoked and spontaneous gamma and spindle bursts in neonatal rat motor cortex

Shuming An et al. J Neurosci. .

Abstract

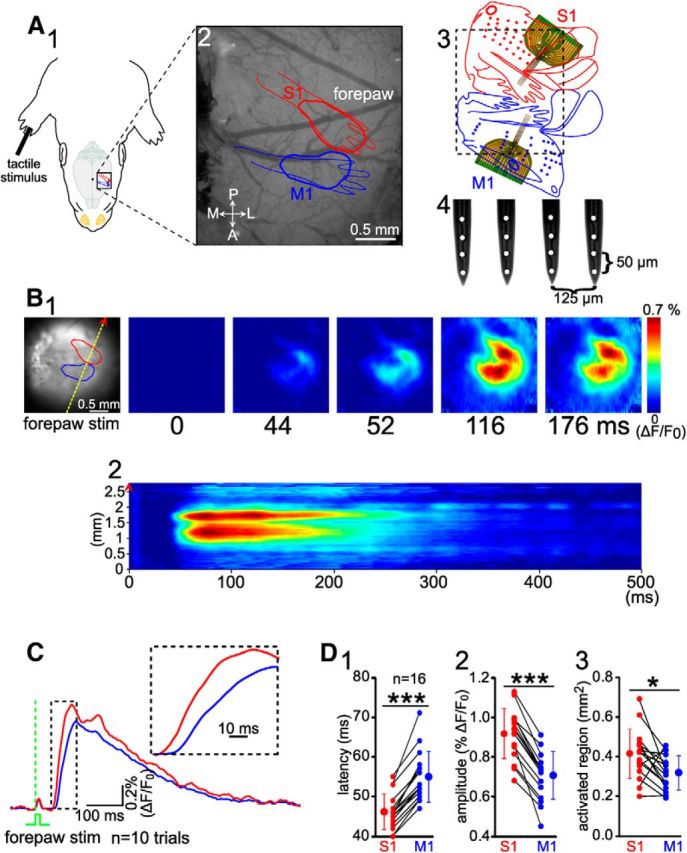
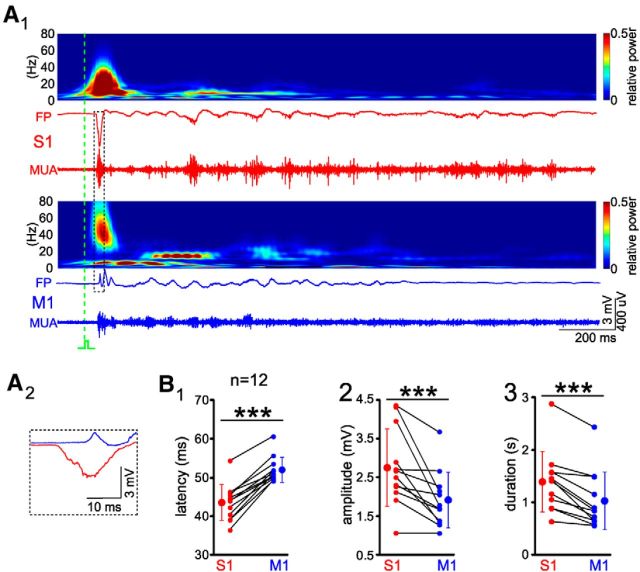
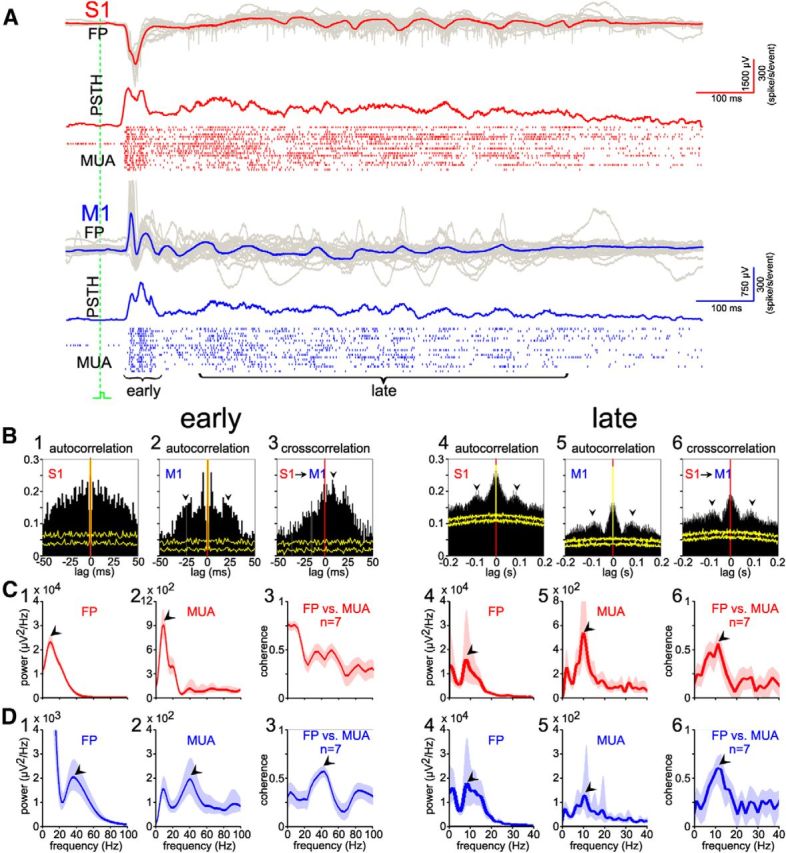
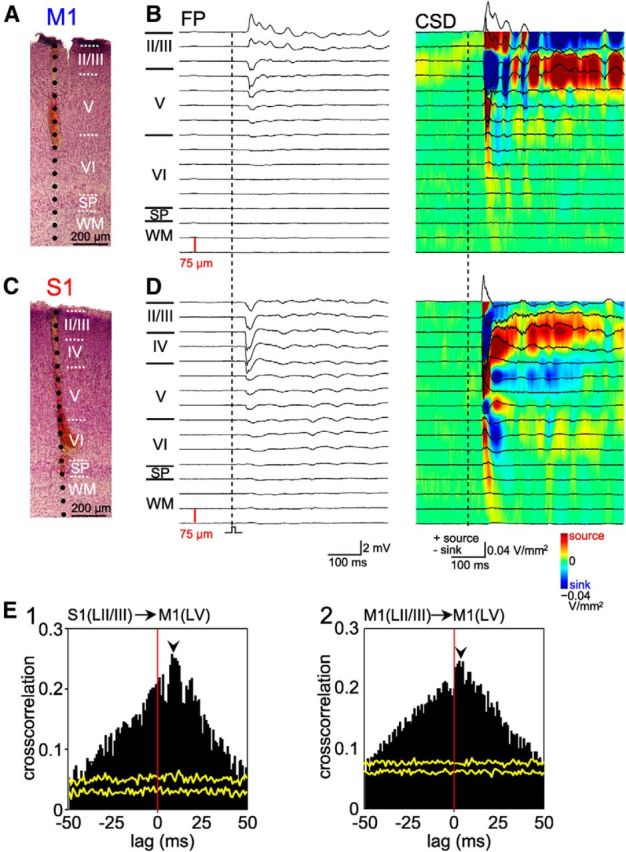
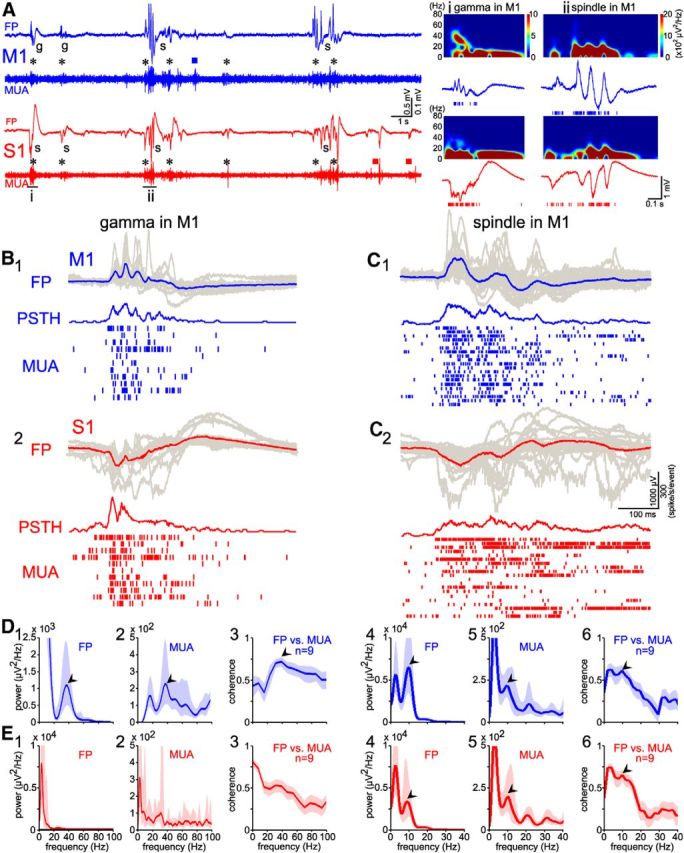
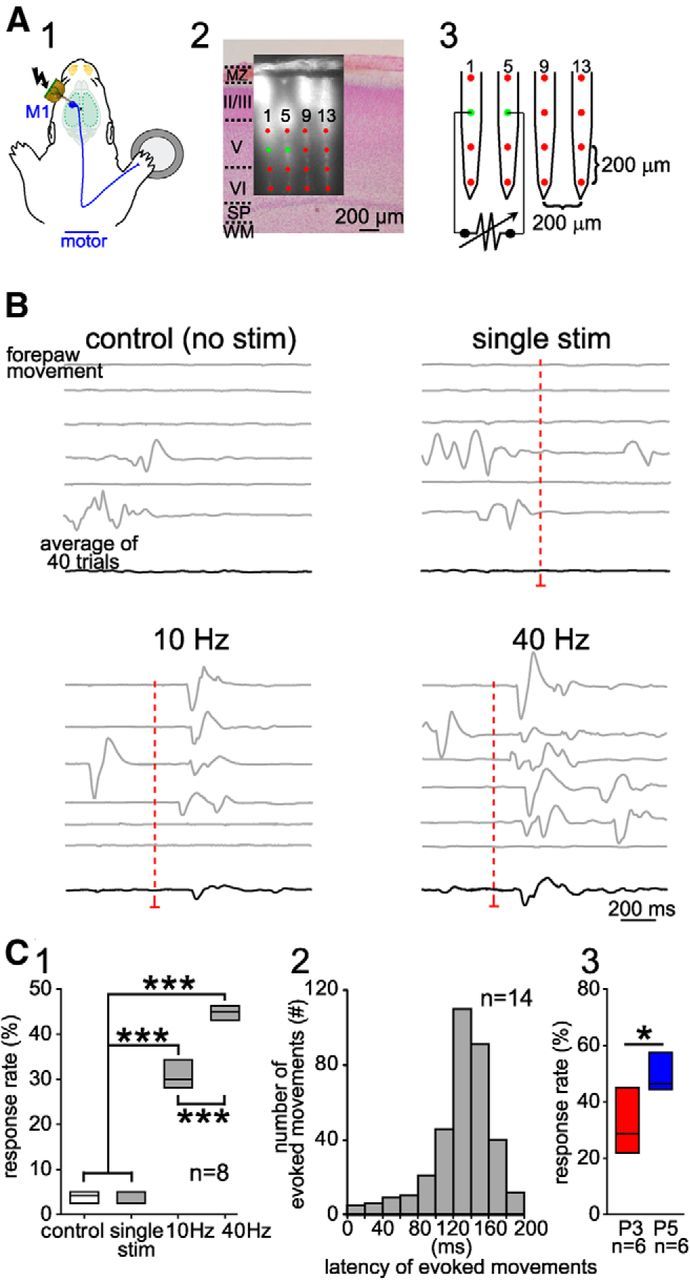
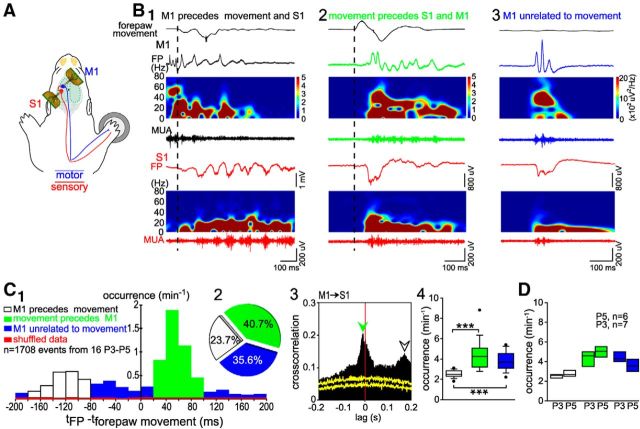
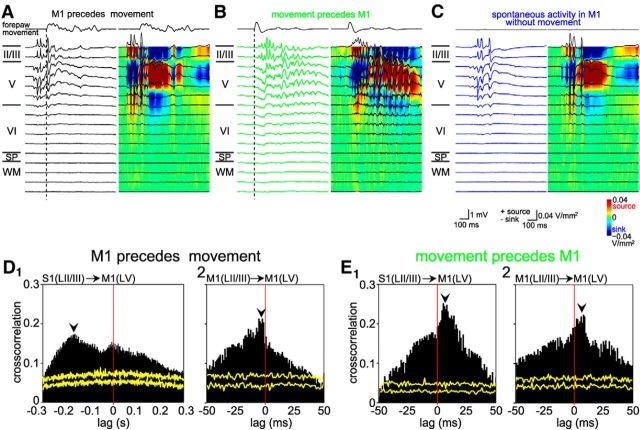
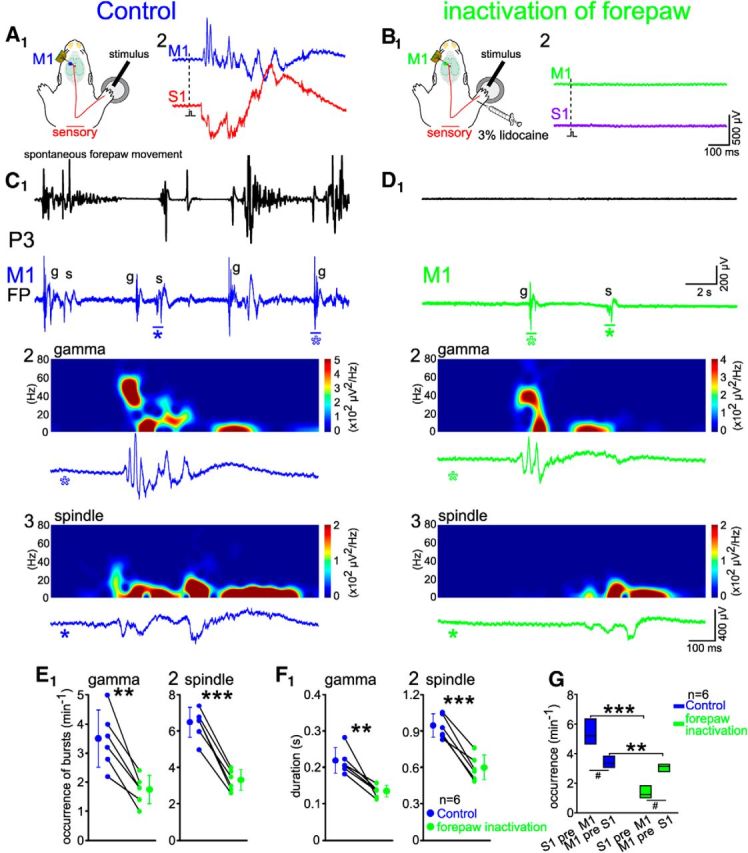
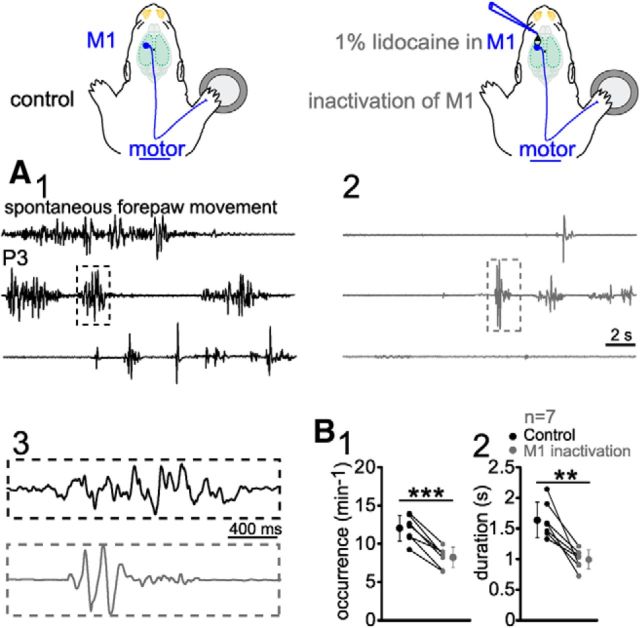
Self-generated neuronal activity originating from subcortical regions drives early spontaneous motor activity, which is a hallmark of the developing sensorimotor system. However, the neural activity patterns and role of primary motor cortex (M1) in these early movements are still unknown. Combining voltage-sensitive dye imaging (VSDI) with simultaneous extracellular multielectrode recordings in postnatal day 3 (P3)-P5 rat primary somatosensory cortex (S1) and M1 in vivo, we observed that tactile forepaw stimulation induced spindle bursts in S1 and gamma and spindle bursts in M1. Approximately 40% of the spontaneous gamma and spindle bursts in M1 were driven by early motor activity, whereas 23.7% of the M1 bursts triggered forepaw movements. Approximately 35% of the M1 bursts were uncorrelated to movements and these bursts had significantly fewer spikes and shorter burst duration. Focal electrical stimulation of layer V neurons in M1 mimicking physiologically relevant 40 Hz gamma or 10 Hz spindle burst activity reliably elicited forepaw movements. We conclude that M1 is already involved in somatosensory information processing during early development. M1 is mainly activated by tactile stimuli triggered by preceding spontaneous movements, which reach M1 via S1. Only a fraction of M1 activity transients trigger motor responses directly. We suggest that both spontaneously occurring and sensory-evoked gamma and spindle bursts in M1 contribute to the maturation of corticospinal and sensorimotor networks required for the refinement of sensorimotor coordination.

Keywords: development; in vivo; motor; neocortex; rat; somatosensory.


Figures

Figure 1.
Figure 1.
A single mechanical stimulus of the forepaw induces in the newborn rat a VSDI response in both S1 and M1. A, Schematic diagram of the experimental setup illustrating selective mechanical stimulation of the forepaw (A1) and simultaneous VSDI recordings in S1 and M1 (A2). The exposed cortex includes the forepaw representation in S1 (red) and M1 (blue) as identified by the VSDI response after mechanical stimulation of the forepaw in a P5 rat. The red and blue diagrams are superimposed on the cortex based on previously published data (Brecht et al., 2004a; Brecht et al., 2004b). A, Anterior; L, lateral; P, posterior; M, medial. A3, Flattened maps of S1 and M1 cortex (Brecht et al., 2004b; modified from Brecht et al., 2004a). Schematic illustration marked by dashed black square indicates the same cortical region as shown in A2. Two 4-shank/16-channel electrodes were inserted into the area of VSDI evoked responses in S1 (red) and M1 (blue), respectively. A4, Schematic illustration of a 4-shank/16-channel Michigan electrode array. B1, Left, Same cortex as in A2 stained with the voltage-sensitive dye RH1691. Shown are VSDI responses in S1 and M1 from 0 to 176 ms poststimulation of the right forepaw. B2, Line scan of the VSDI response along the yellow dashed line (indicated on the left image of B1) from 0 to 500 ms after stimulation from the same recording as B1. Note two clear separate responses in S1 and M1. C, Average of 10 VSDI responses in S1 (red trace) and M1 (blue trace) to single forepaw stimulation. Green dashed line indicates the time point of mechanical stimulation. Same experiment as in B. Inset shows a representative response at an expanded time scale. Note that VSDI response appears first in S1 and several milliseconds later in M1. D, Statistical analyses of onset latency (D1) and maximal amplitude (D2) of forepaw evoked VSDI responses and size of activated regions (D3) obtained in 16 P3–P5 rats. Note that sensory-evoked responses in M1 have a larger latency and smaller amplitude than responses in S1. The averaged data (bigger symbols) are expressed as mean ± SD. Small symbols connected by black lines represent individual animals. Significant differences between S1 and M1 were tested with Mann–Whitney–Wilcoxon test. ***p < 0.001; *p < 0.05.
Figure 2.
Figure 2.
Sensory-evoked response in S1 and M1 by mechanical forepaw stimulation. A1, Forepaw stimulation evoked spindle bursts in contralateral S1 (red) and gamma/spindle bursts in contralateral M1 of a P4 rat. The wavelet analyses above the FP traces are calculated from the unfiltered raw data. The FPs are from unfiltered raw data and MUA traces are high-pass filtered (>200 Hz). Green dashed line indicates the time point of mechanical stimulation. A2, Initial response in S1 and M1 as marked in A1 by dashed box. B, Statistical analyses of the onset latency (B1), maximal amplitude (B2), and duration (B3) of forepaw evoked FPs obtained from 12 P3–P5 rats. Note that sensory-evoked responses in M1 have a longer latency, smaller amplitude, and shorter duration than responses in S1. The averaged data (larger symbols) are expressed as mean ± SD. Small symbols connected by black lines represent individual animals. Significant differences between S1 and M1 were tested with Mann–Whitney–Wilcoxon test. ***p < 0.001.
Figure 3.
Figure 3.
Properties of sensory-evoked gamma and spindle bursts in immature S1 and M1. A, FP recordings (top), multiunit activity (bottom), and corresponding PSTH (middle) in contralateral S1 and M1 upon mechanical forepaw stimulation in a P4 rat. Shown are averaged (red and blue traces) and superimposed 20 single (gray traces) cortical FP responses to forepaw stimulation. Note that gamma bursts are induced in the early component of the M1 responses and spindle bursts are present in the late components of the S1 and M1 responses. B, Auto- and cross-correlation analyses of early (B1B3) and late (B4B6) MUA in S1 and M1 from the data marked in A. In the early component, obvious peaks (black arrowheads) occurred in the autocorrelation of M1 MUA at ∼25 ms (B2), but not in S1 MUA (B1), and S1 MUA precedes M1 MUA (black arrowhead) in the cross-correlation (B3). In the late response, peaks (black arrowheads) are evident at ∼100 ms in both autocorrelation (B4B5) and cross-correlation (B6) of S1 and M1 MUA. Yellow traces indicate results of shuffled dataset. C, Average FP and MUA spectrum analyses of the early (C1C2) and late (C4C5) components recorded in S1. Average coherence of FP versus MUA in the early (C3) and late (C6) component of 187 forepaw stimulation evoked responses recorded in seven P3–P5 rats. Red traces show averages; shaded area, 95% confidence interval. Note the ∼10 Hz peaks (black arrowheads) in the spectra of FP, MUA in both early and late evoked responses, and that coherence of FP versus MUA shows a peak only for the late component. D, Similar analyses as in C, but from simultaneous recordings in M1 (blue). Note that spectrum and coherences of FP and MUA show ∼40 Hz peaks (black arrowheads) in the early component (D1D3) and ∼10 Hz peak (black arrowheads) in the late component (D4D6) of evoked responses in M1.
Figure 4.
Figure 4.
Representative FP response depth profile with corresponding CSD and cross-correlation analyses in a P5 rat. A, Digital photomontage reconstructing the location of the electrode (one shank of 8 × 128-channel Michigan electrode array) in coronal Nissl-stained M1 section. WM, White matter; SP, subplate. B, Depth profiles of FP responses in M1 after a single mechanical stimulus of the forepaw and corresponding CSD analyses (right). Note the appearance of current sources in superficial layers during early response. C, Digital photomontage reconstructing the location of the electrode in coronal Nissl-stained S1 section. D, Evoked FP responses in S1 and corresponding CSD. Note the appearance of current sinks in layer IV and Vb during initial responses. E1, In the early component, MUA in S1 layer II/III precedes MUA in M1 layer V (indicated by black arrowhead). E2, In the early component, MUA in M1 layer II/III precedes MUA in layer V (indicated by black arrowhead). Yellow traces indicate results of the shuffled dataset.
Figure 5.
Figure 5.
Coupling of spontaneous activity between S1 and M1. A, A 20 s simultaneous recording of spontaneous activity in M1 (blue) and S1 (red) from a P3 rat. Note the high incidence of simultaneously occurring (black asterisks) gamma and spindle bursts in M1 and S1, as well as the presence of a few events restricted to M1 (blue square) or to S1 (red squares). The events marked by iii are shown at higher resolution with corresponding spectrograms on the right. B, Summarized FP recordings (top), MUA (bottom), and corresponding PSTH (middle) of spontaneous gamma activity in M1 and corresponding S1 activity from the experiment shown in A. Averaged (blue trace) FP from 11 superimposed single (gray traces) spontaneous gamma bursts in M1 (B1) and simultaneous recording activity in S1 (B2). The recordings from M1 and S1 were aligned to the onset of the M1 FP events. Note gamma bursts in M1 FP and PSTH, but not in S1. C, Same display as in B, showing spontaneous spindle bursts in M1 and corresponding activity in S1. Note spindle bursts in both M1 and S1. D, Average spectrum of FP and MUA analyses of gamma (D1,D2) and spindle bursts (D4,D5) recorded in M1 (blue) from events shown in B1C1. An averaged coherence analyses of 195 spontaneous gamma (D3) and 253 spindle (D6) bursts (FP events vs MUA) recorded in M1 from nine P3–P5 rats. Blue traces show averages and the shaded area represents the 95% confidence interval. Note ∼40 Hz peak (black arrowheads) in the averaged gamma bursts and the ∼10 Hz peak (black arrowheads) in the averaged spindle burst response. E, Similar analyses as in D, but from simultaneous recording in S1 (red). Note the ∼10 Hz peak (black arrowheads) in the averaged spindle burst response.
Figure 6.
Figure 6.
Microstimulation of layer V in M1 evokes movements in newborn rats. A1, Schematic diagram of the experimental setup illustrating local stimulation of the forepaw representation in M1 using a Michigan electrode. A2, Digital photomontage reconstructing the location of the DiI-covered electrode in coronal Nissl-stained section from a P5 rat. MZ, Marginal zone; WM, white matter; SP, subplate. A3, Schematic illustration of the 4-shank/16-channel Michigan electrode array with interelectrode distance of 200 μm. Points indicate the 16 channels as in A2. Bipolar electrical stimulation of layer V was applied between channel 2 and 6 (green dots). B, Spontaneous and stimulus-evoked forepaw movements in newborn rat. A single biphasic current pulse (150 μA, 100 μs duration) did not elicit a response. Stimulation with 10 or 40 Hz (10 pulses) evoked a forepaw movement. Red dashed lines indicate the time point of stimulation. Gray traces are single trials and the lower black ones are averaged traces of 40 trials. C1, Box plots of response rate to different stimulations recorded in eight P3–P5 rats. Note that the highest response rate was observed with 40 Hz burst stimulation. C2, Bar diagram illustrating the response rate at different latencies using a 40 Hz stimulation (n = 325 responses in eight P3–P5 rats). Significant differences among different parameters, stimulations, and control conditions were tested with one-way ANOVA, followed by multiple-comparisons with Bonferroni's correction. C3, Box plots of response rate to a 40 Hz stimulation recorded in six P3 and six P5 rats. Significant differences between P3 and P5 were tested with the Mann–Whitney–Wilcoxon test. ***p < 0.001; *p < 0.05.
Figure 7.
Figure 7.
Spontaneous activity in S1 and M1 correlates with forepaw movement. A, Schematic illustration of the experimental setup with 2 4-shank/16-channel electrodes as in Figure 1, A3–A4, located in S1 (red), M1 (blue), and a movement detector attached to the contralateral forepaw. Blue line indicates the motor pathway, red line the sensory pathway. B, Relationship between forepaw movements and cortical activity in S1 and M1 in a P4 rat. B1, Gamma burst in M1 (black) elicited forepaw movement and preceded spindle burst in S1 (red). Black dashed line indicates time point of forepaw movement. Top black trace shows forepaw movement. B2, Spontaneous forepaw movement preceded gamma burst in M1 (green) and spindle burst in S1 (red). B3, Spontaneous activity in M1 (blue) and S1 (red) unrelated to forepaw movement. C1, Bar diagram illustrating the occurrence of FP activity, which preceded forepaw movements (blank box), followed forepaw movements (green) and were unrelated to movement (blue) in 16 P3–P5 rats. Red bars represent results from the shuffled dataset. C2, Pie diagram showing the percentages of the three patterns (n = 1708 events from 16 P3–P5 rats during 10 min unstimulated recordings). C3, Cross-correlation of MUA between S1 and M1 from the same rat as in B. Note that S1 MUA precedes M1 MUA (green arrowhead) and M1 MUA precedes S1 MUA (blank arrowhead). Yellow traces represent results from the shuffled dataset. C4, Statistical analysis of the occurrence of the three patterns of activity. Significant differences were tested with one-way ANOVA. ***p < 0.001. D, Box plots of the occurrence of the three patterns of activity between six P5 and 7 P3 rats. Note the absence of significant differences between them.
Figure 8.
Figure 8.
Depth profiles and CSD analyses of the three spontaneous response patterns in a P5 rat. A, Gamma burst in M1 (black) preceded forepaw movement. Black dashed line indicates onset of forepaw movement. Top black trace shows forepaw movement. B, FP registration and CSD for M1 activity preceded by movement events (green). C, FP registration and CSD for M1 activity uncorrelated to forepaw movement (dark blue). D, Cross-correlograms of M1 MUA activity preceding forepaw movements between S1 layer II/III and M1 layer V (D1) and between M1 layer II/III and layer V (D2). Yellow traces indicate results of the shuffled dataset. E, Cross-correlograms of M1 MUA activity preceded by movements between layer II/III in S1 (E1) or M1 (E2) and layer V in M1.
Figure 9.
Figure 9.
Effect of blocking peripheral sensory input on spontaneous activity in M1. A1, Schematic illustration of the experimental setup with mechanical stimulation of the controlateral forepaw. A2, Gamma and spindle bursts could be induced in M1 and S1 of a P3 rat under control conditions. B, Same experiment as in A, but 20 min after 3% lidocaine injection in the forepaw. C, D, Twenty-second-long recordings in the M1 forepaw representation before (C1, blue) and 20 min after (D1, green) lidocaine injection. C2, C3, D2, D3, Examples of gamma bursts (C2, D2) and spindle bursts (C3, D3) displayed at an expanded time scale and marked by asterisks in C1 and D1. Note decrease in the occurrence and duration of gamma (g) and spindle bursts (s) in M1 after inactivation of the forepaw. E, F, Forepaw inactivation reduced the occurrence (E) and duration (F) of spindle and gamma bursts in M1 of six P3–P5 rats. Significant differences were tested with paired t test from six P3–P5 rats. G, Forepaw inactivation changed the relationship between spontaneous activity in M1 and S1 in the S1-preceding M1 activities (S1 pre M1) and M1-preceding S1 activities (M1 pre S1) patterns. Significant differences between before and after forepaw inactivation were tested with paired t test. Significant differences between S1 pre M1 and M1 pre S1 were tested with the Mann–Whitney–Wilcoxon test. ***p < 0.001, *p < 0.01 by paired t test; #p < 0.05 by Mann–Whitney–Wilcoxon test.
Figure 10.
Figure 10.
Role of M1 in controlling forepaw movements. A, One-minute continuous recording of spontaneous forepaw movements in a P3 rat under control conditions (A1, black) and 20 min after lidocaine application (A2, gray). A3, Examples of forepaw movements displayed at expanded time scale (dashed boxes in A1 and A2). B, Inactivation of M1 by lidocaine reduced the occurrence (B1) and duration (B2) of spontaneous forepaw movements. Averaged data (larger symbols) show mean ± SD. Significant differences were tested with paired t test from seven P3–P5 rats. ***p < 0.001; **p < 0.01.

References

    1. An S, Yang JW, Sun H, Kilb W, Luhmann HJ. Long-term potentiation in the neonatal rat barrel cortex in vivo. J Neurosci. 2012;32:9511–9516. doi: 10.1523/JNEUROSCI.1212-12.2012. - DOI - PMC - PubMed
    1. Armstrong-James M. The functional status and columnar organization of single cells responding to cutaneous stimulation in neonatal rat somatosensory cortex S1. J Physiol. 1975;246:501–538. - PMC - PubMed
    1. Aronoff R, Matyas F, Mateo C, Ciron C, Schneider B, Petersen CC. Long-range connectivity of mouse primary somatosensory barrel cortex. Eur J Neurosci. 2010;31:2221–2233. doi: 10.1111/j.1460-9568.2010.07264.x. - DOI - PubMed
    1. Bates CA, Killackey HP. The emergence of a discretely distributed pattern of corticospinal projection neurons. Brain Res. 1984;315:265–273. doi: 10.1016/0165-3806(84)90161-5. - DOI - PubMed
    1. Berger T, Borgdorff A, Crochet S, Neubauer FB, Lefort S, Fauvet B, Ferezou I, Carleton A, Lüscher HR, Petersen CC. Combined voltage and calcium epifluorescence Imaging in vitro and in vivo reveals subthreshold and suprathreshold dynamics of mouse barrel cortex. J Neurophysiol. 2007;97:3751–3762. doi: 10.1152/jn.01178.2006. - DOI - PubMed

Publication types

LinkOut - more resources