. 2014 Aug 13;34(33):10892-905.
doi: 10.1523/JNEUROSCI.1205-13.2014.

NMDA spike/plateau potentials in dendrites of thalamocortical neurons

Affiliations

NMDA spike/plateau potentials in dendrites of thalamocortical neurons

Sigita Augustinaite et al. J Neurosci. .

Abstract

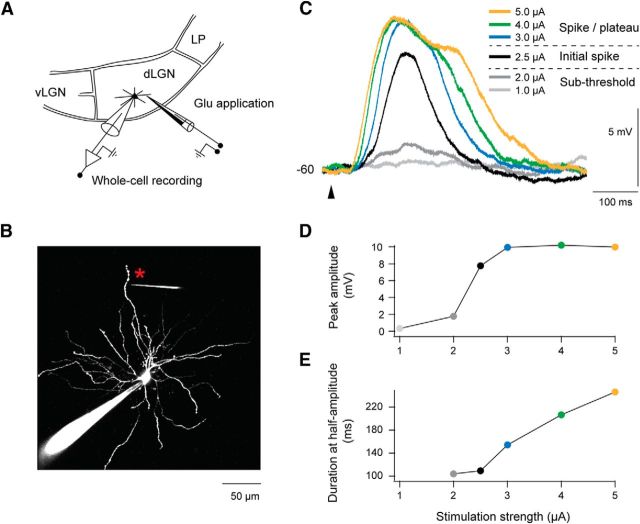
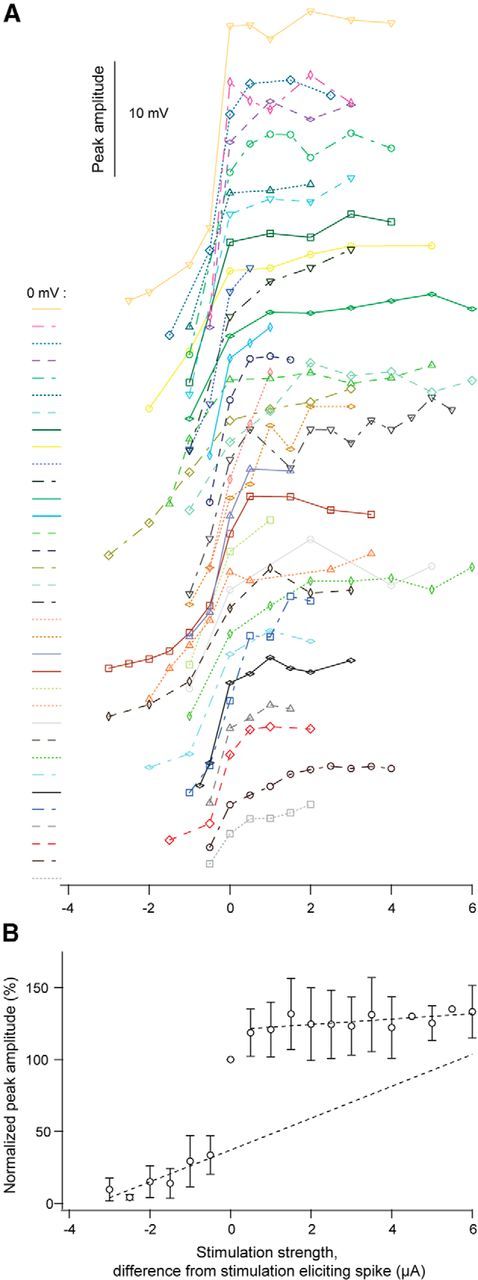
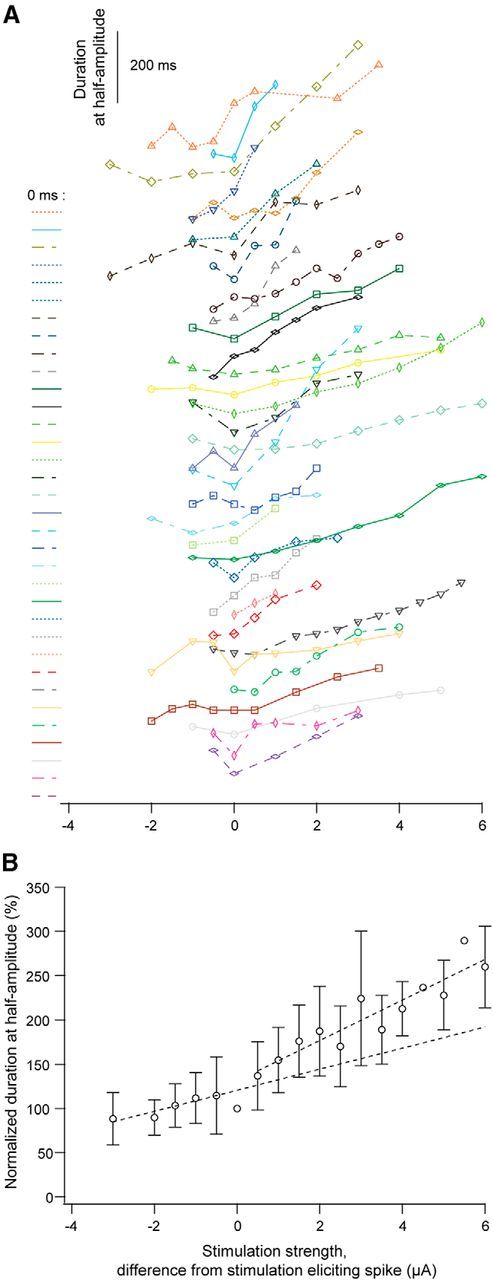
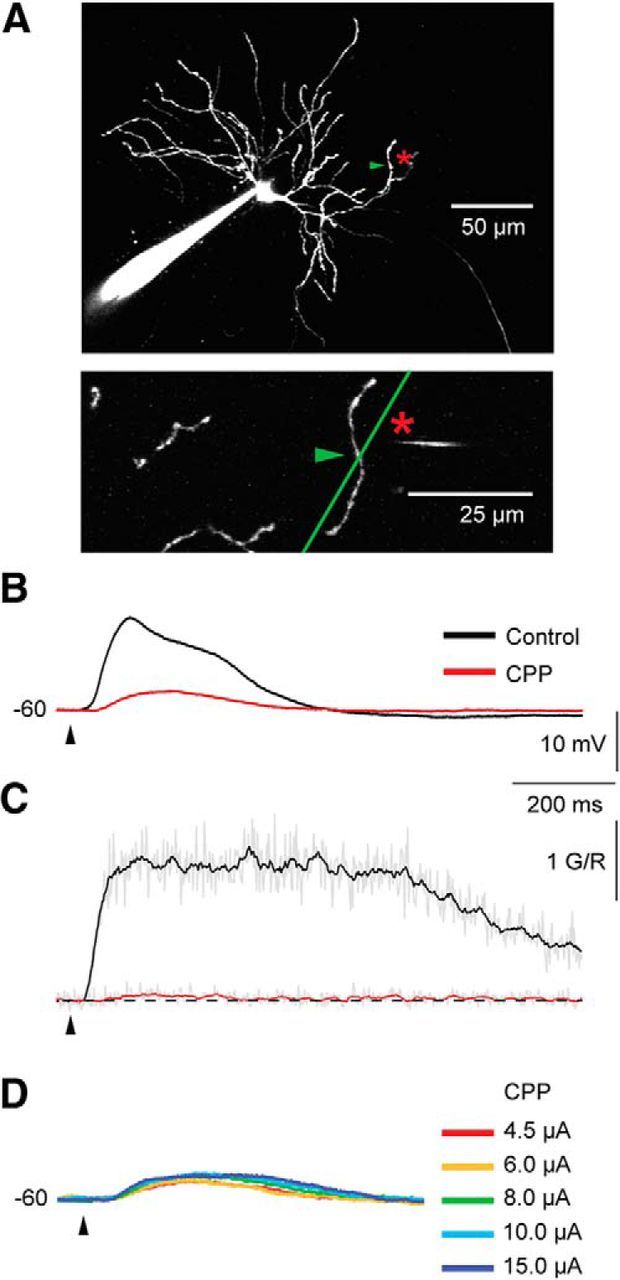
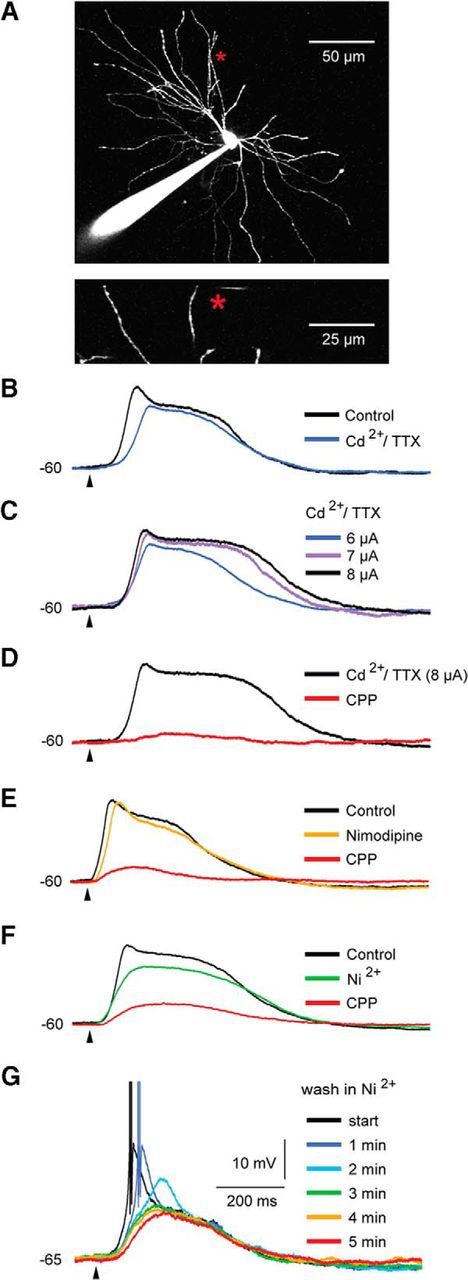
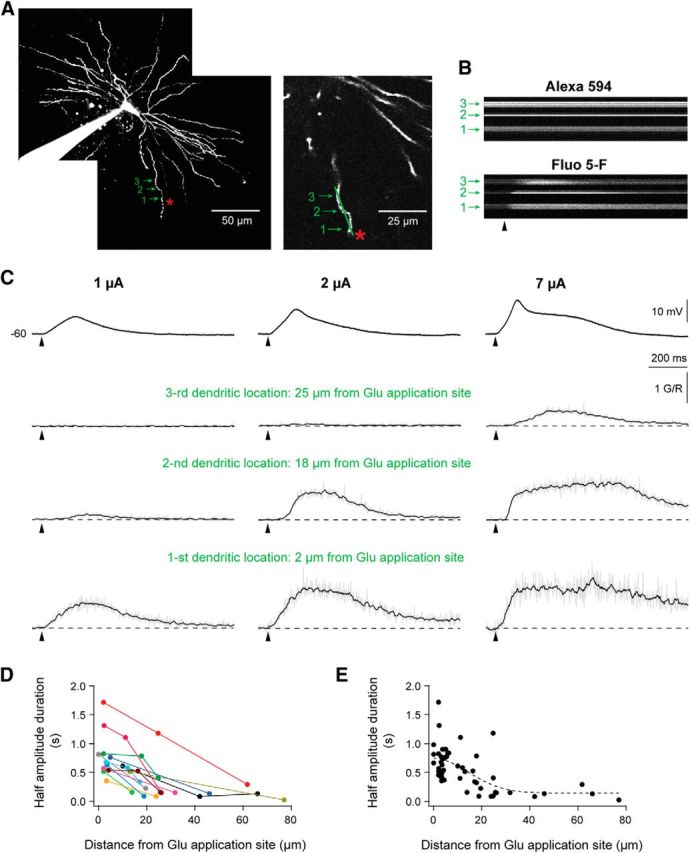
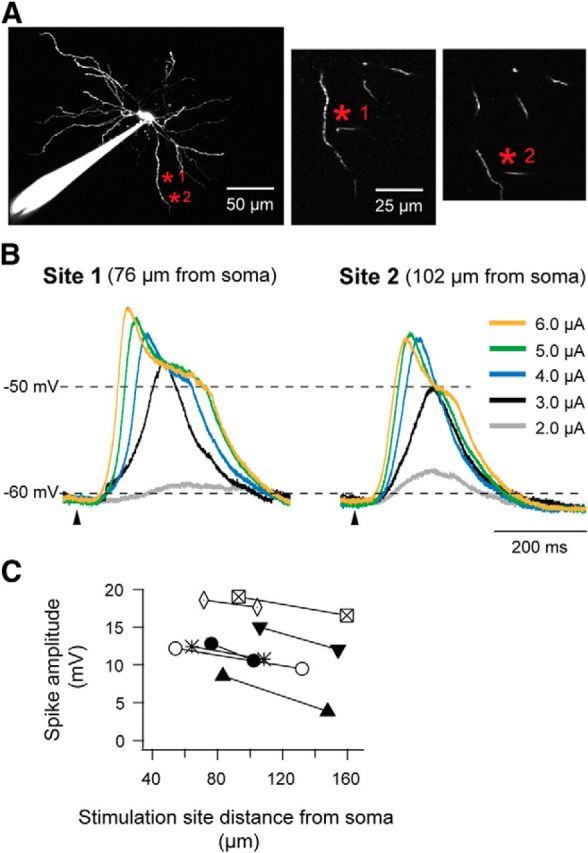
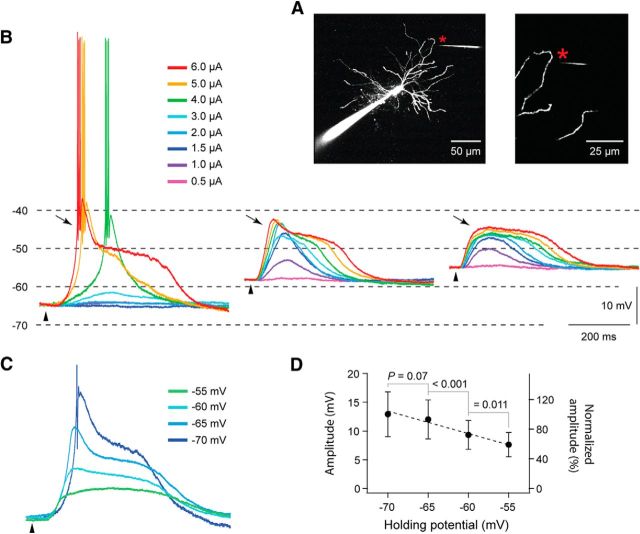
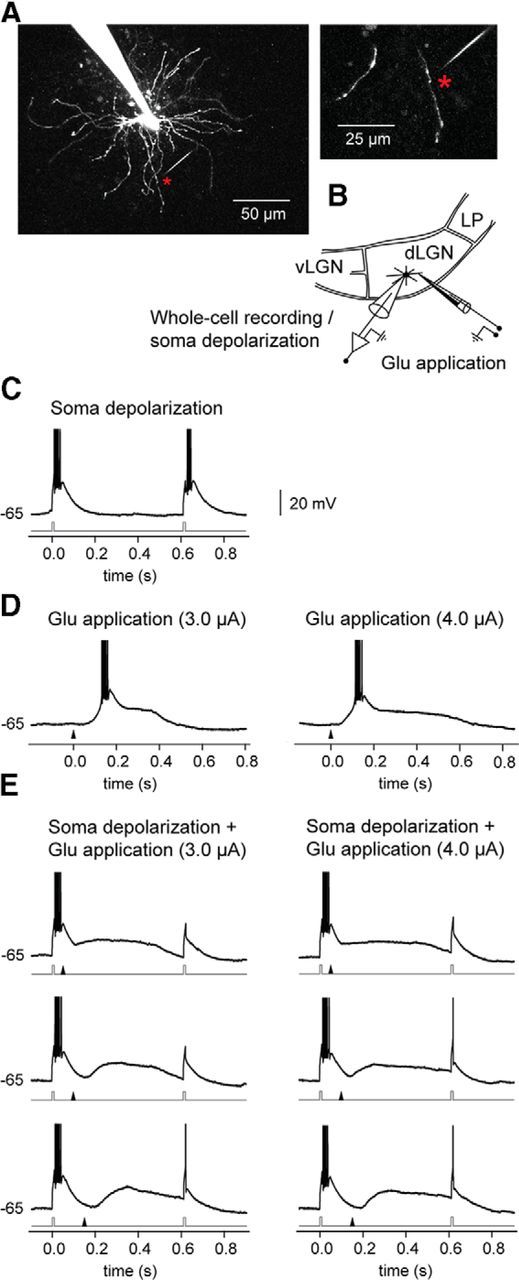
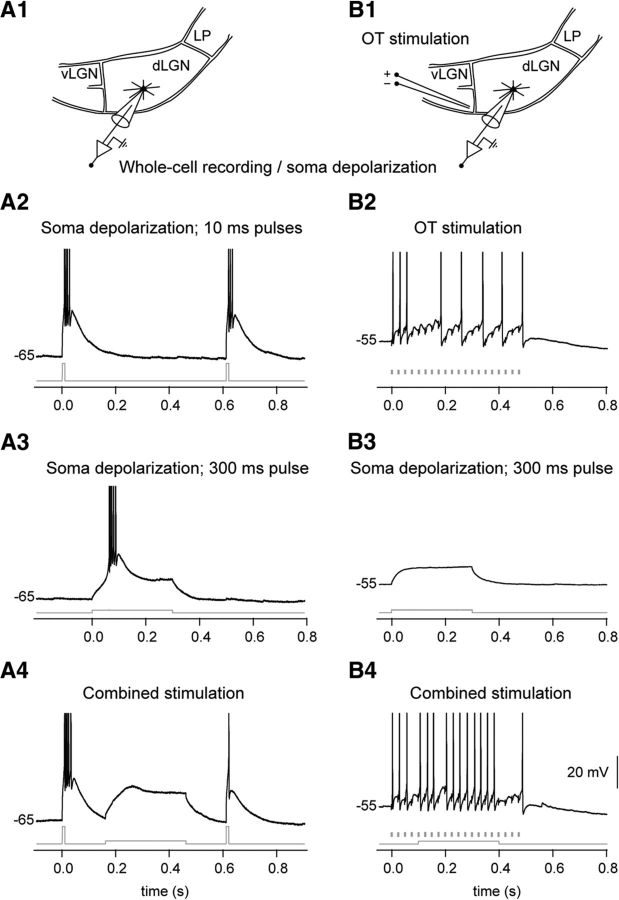
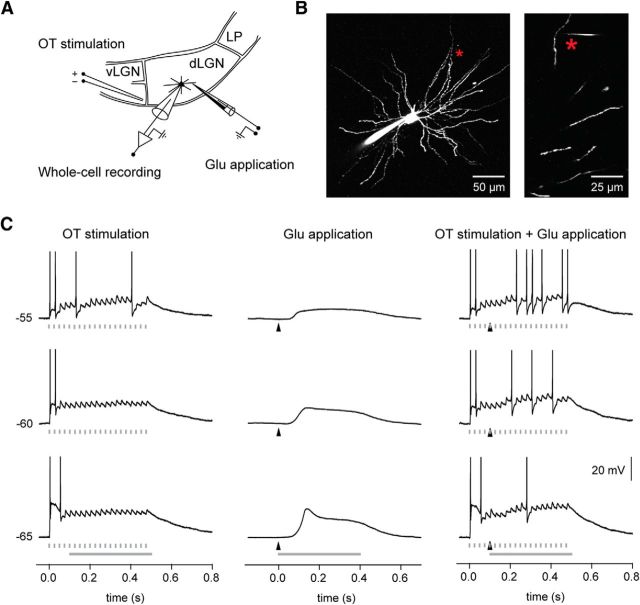
Dendritic NMDA spike/plateau potentials, first discovered in cortical pyramidal neurons, provide supralinear integration of synaptic inputs on thin and distal dendrites, thereby increasing the impact of these inputs on the soma. The more specific functional role of these potentials has been difficult to clarify, partly due to the complex circuitry of cortical neurons. Thalamocortical (TC) neurons in the dorsal lateral geniculate nucleus participate in simpler circuits. They receive their primary afferent input from retina and send their output to visual cortex. Cortex, in turn, regulates this output through massive feedback to distal dendrites of the TC neurons. The TC neurons can operate in two modes related to behavioral states: burst mode prevailing during sleep, when T-type calcium bursts largely disrupt the transfer of signals from retina to cortex, and tonic mode, which provides reliable transfer of retinal signals to cortex during wakefulness. We studied dendritic potentials in TC neurons with combined two-photon calcium imaging and whole-cell recording of responses to local dendritic glutamate iontophoresis in acute brain slices from mice. We found that NMDA spike/plateaus can be elicited locally at distal dendrites of TC neurons. We suggest that these dendritic potentials have important functions in the cortical regulation of thalamocortical transmission. NMDA spike/plateaus can induce shifts in the functional mode from burst to tonic by blockade of T-type calcium conductances. Moreover, in tonic mode, they can facilitate the transfer of retinal signals to cortex by depolarization of TC neurons.

Keywords: LGN; NMDA spike; NMDA spike/plateau potential; cortical feedback; dendritic integration; thalamocortical.


Figures

Figure 1.
Figure 1.
Local dendritic glutamate application elicited spike/plateau potentials in TC neurons. A, Scheme of experiment: simultaneous two-photon imaging of dendritic activity and somatic whole-cell recording was made from TC neurons in dLGN in vitro. Responses were elicited by local dendritic glutamate application. vLGN, ventral lateral geniculate nucleus; LP, lateral posterior nucleus. B, Image of a TC neuron. The neuron was filled with Alexa Fluor 594 (50 μm in pipette) via the recording electrode. Glutamate stimulation was applied at a dendritic site (marked by an asterisk) via a high-resistance (0.5–0.6 GΩ) theta electrode with glutamate (300 mm) in one chamber and Alexa Fluor 594 (100 μm) in the other. In this example the glutamate application site was 126 μm from the soma and 5 μm from the selected dendrite. Notice the lack of prominent spines. C, Somatically recorded potentials elicited by the local glutamate stimulation. The strength of the stimulation current, indicated by the color code, reflects the amount of the released glutamate. The responses, elicited by a particular current strength, were quite stable (amplitudes varied only by 0.4 ± 0.6 mV). Here, and in all the other figures, each trace in color is an average of three trials obtained with at least 10 s intertrial intervals. The start of the glutamate application is indicated by an arrowhead below the traces. In all experiments GABAergic synaptic inputs were blocked by gabazine and CGP52432 or CGP55845. D, The peak response amplitude of this neuron plotted against stimulation strength. Color of the dots corresponds to the color scale in C. E, The duration of the potential, measured at half-maximum amplitude, plotted against stimulation strength. Dots colored according to color scale in C.
Figure 2.
Figure 2.
Changes of the amplitude of the potential by increasing strength of glutamate stimulation. A, Individual curves showing the peak amplitude with increasing strength of glutamate stimulation for all neurons. To the left of each curve the baseline (0 mV) is indicated together with a curve identifier (color and line type) for the specific curve. B, Normalized response amplitudes plotted against the glutamate stimulation strength for all neurons (mean ± SD; n = 34). Dotted lines: linear regression line fitted to the mean values below the spike threshold and to the mean values above the spike threshold.
Figure 3.
Figure 3.
Changes of the duration of the potential by increasing intensity of glutamate stimulation. A, The duration of the potential at the half-maximum amplitude plotted against stimulus strength for each of the studied neurons. To the left of each curve the baseline (0 ms) is indicated together with a curve identifier (color and line type). For a given neuron the color and line style is the same as in Figure 2A. B, Values of normalized half-amplitude duration plotted against stimulus strength for all neurons (mean ± SD; n = 34). Dotted lines: linear regression line fitted to the values below spike threshold and to the values above the threshold.
Figure 4.
Figure 4.
CPP eliminated the calcium signal as well as the somatic spike/plateau potential. A, Image of the recorded TC neuron. The glutamate application site (indicated by asterisk) was 106 μm from the soma and 8 μm from the selected dendrite. The green arrowhead marks the dendritic site where the calcium signal was recorded during the line scans. B, The somatically recorded spike/plateau potential. Notice the marked reduction of the response during CPP. C, The corresponding Ca2+ transient. Notice that the Ca2+ transient was nearly eliminated by CPP (15 μm). D, In the presence of CPP, the response could not be recovered by stronger stimulation current.
Figure 5.
Figure 5.
Conductances mediated by NMDA receptors are necessary for the generation of the spike/plateau potentials, whereas Ca2+ and Na+ conductances have only minor contributions. A, Image of the recorded TC neuron in B–D. The glutamate application site (indicated by asterisk) was 79 μm from the soma and 13 μm from the selected dendrite. B, Application of Cd2+ (100 μm) and TTX (1 μm) reduced the glutamate elicited spike/plateau potential by about 20%. C, The spike/plateau potential could be re-initiated by means of stronger glutamate stimulation in the presence of Cd2+ and TTX. D, The re-initiated spike/plateau was almost eliminated by 15 μm CPP. E, The application of nimodipine (50 μm) reduced the potential by about 9%, while the addition of CPP removed about 80% of the response obtained in the control condition. F, The application of Ni2+ (0.4 mm) reduced the response by about 16%, while the addition of CPP removed about 74% of the response obtained in the control condition. G, At −65 mV, the application of Ni2+ (0.4 mm) removed the T-type Ca2+ burst without affecting the plateau part of the glutamate elicited response. The data in A–D and in E–G are from different neurons.
Figure 6.
Figure 6.
Glutamate-elicited Ca2+ transients were restricted to a small dendritic region near the stimulation site. A, Image of the recorded TC neuron in B and C. Glutamate was applied at 110 μm from the soma and 7 μm from the dendrite. The green arrowheads mark the dendritic sites where the line scans of the Ca2+ transients were recorded. B, Single line scans, which demonstrate that the signal of the Ca2-insensitive Alexa 594 was constant, while the fluorescence intensity of the calcium indicator Fluo-5F, changed after the stimulation. In this case, calcium signals were recorded by line scans with identical scanning parameters at three dendritic locations. C, The uppermost row of traces shows somatically recorded potentials elicited at three different glutamate stimulation strengths. The remaining three rows of traces show the corresponding Ca2+ transients (ΔG/R), measured at three different positions indicated in A. D, Half-amplitude duration of the Ca2+ signals plotted as a function of distance from the glutamate application site. These data were collected from the neurons (n = 15) where the Ca2+ transients were recorded at different sites along the same dendritic arbor. Points from the same dendrite have the same color. The calcium signals were elicited by the plateau potentials. E, Population data (n = 28) showing the decay of the Ca2+ signal duration as a function of increasing distance from the glutamate application site. Dataset in D included. The dashed line shows a Gaussian function fitted to the data.
Figure 7.
Figure 7.
Attenuation of the potential along the dendrite. Comparisons of response amplitudes at the soma elicited by glutamate stimulation at two different distances from soma along the same dendrite. A, Image of the TC neuron recorded in B. Two stimulation sites along the same dendrite are marked by asterisks in red. Glutamate application Site 1 was 76 μm from the soma and 7 μm from the dendrite; Site 2 was 102 μm from the soma and 9 μm from the dendrite. B, Traces recorded by different stimulus strength at two distances from soma. Stimulation strength is indicated by the color scale. C, Amplitudes of initial spikes elicited at two glutamate stimulation sites (n = 7).
Figure 8.
Figure 8.
Spike/plateaus at different membrane potentials. A, Image of the recorded TC neuron in B. The glutamate application site (indicated by an asterisk) was 99 μm from the soma and 7 μm from the dendrite. B, Somatically recorded potentials elicited by local dendritic application of glutamate at different membrane potentials: −65 (left), −58 (middle), and −55 mV (right). The color code indicates the strength of the stimulation current. Notice that the T-type Ca2+ potential (indicated by an arrow) was reduced or disappeared at more depolarized membrane potentials. C, Superimposed spike/plateau potentials recorded at different membrane potentials. The stimulation strength (3 μA) was the same in all cases. The action potentials are truncated. The color code indicates the holding membrane potential. The neuron in C is different from the one in A and B. D, The average amplitude of the spike/plateau potential plotted as a function of the membrane potential (n = 8).
Figure 9.
Figure 9.
A spike/plateau potential elicited at a single distal dendrite can inactivate T-type Ca2+ conductance in TC neurons thereby preventing burst firing. A, Image of the recorded TC neuron. The glutamate application site (indicated by an asterisk) was 67 μm from the soma and 5 μm from the dendrite. B, Scheme of experiment: simultaneous two-photon imaging and somatic whole-cell recording. vLGN, ventral lateral geniculate nucleus; LP, lateral posterior nucleus. C, T-type Ca2+ bursts were elicited by two depolarizing pulses (each 10 ms, 150 pA) to the soma of a hyperpolarized (−65 mV) TC neuron. The timing of the pulses is indicated by the current trace (gray) below the trace of the response. D, Responses, elicited by local dendritic glutamate stimulation (left, 3 μA; right, 4 μA). The time of the application of the glutamate pulse is indicated by the arrowhead below each trace. E, Responses elicited by combined somatic depolarizing pulses and dendritic glutamate stimulation. Due to the NMDA spike/plateau, a T-type calcium burst in response to the second somatic pulse was not elicited. The glutamate stimulation started 50 ms (top), 100 ms (middle), or 150 ms (bottom) after the first depolarizing pulse. Action potentials are truncated at 0 mV.
Figure 10.
Figure 10.
A depolarizing current injection to the soma of a TC neuron can inactivate T-type Ca2+ conductance (A) and facilitate the retinogeniculate signal transmission (B). A1, Scheme of experiment: somatic whole-cell recording and depolarizing current injection through the recording electrode. A2, T-type Ca2+ bursts were elicited by two depolarizing pulses (each 10 ms, 200 pA) to the soma of a hyperpolarized (−65 mV) TC neuron. The timing of the pulses is indicated by the current trace (gray) below the response trace. A3, Response elicited by a 300 ms depolarizing current injection (50 pA). A4, Responses elicited by combined somatic depolarizing current injection and somatic depolarizing pulses. Due to the long somatic depolarization step, the second somatic pulse did not elicit a T-type calcium burst. The current injection (300 ms) started 150 ms after the first 10 ms pulse. B1, Scheme of experiment: somatic whole-cell recording and depolarizing current injection through the recording electrode; optic tract (OT) fibers were stimulated electrically. B2, Response to OT stimulation (20 pulses at 40 Hz) elicited at −55 mV membrane potential. The timing of each pulse is indicated by a marker below the trace. B3, Response elicited by a depolarizing current injection (300 ms, 25 pA). B4, Response to the combined OT stimulation and a 300 ms somatic depolarizing current injection. Due to the long somatic depolarization step, more action potentials were generated by the EPSPs, which were elicited through the retinal input. The depolarizing current injection started 100 ms after the beginning of the electrical train stimulation.
Figure 11.
Figure 11.
NMDA spike/plateaus potentials facilitate the retinogeniculate signal transmission. A, Scheme of experiment: simultaneous two-photon imaging and somatic whole-cell recording from a TC neuron in vitro. Responses were elicited by electric stimulation of optic tract (OT) fibers, combined with local dendritic glutamate application. vLGN, ventral lateral geniculate nucleus; LP, lateral posterior nucleus. B, Image of the recorded neuron. The glutamate application site (indicated by an asterisk) was 123 μm from the soma and 7 μm from the dendrite. C, Responses elicited at three different membrane potentials. Left column, Responses to OT stimulation (20 pulses at 40 Hz). The timing of each pulse is indicated by a marker below each trace. Center column, NMDA spike/plateau potentials elicited by local dendritic glutamate stimulation (stimulation site marked by the asterisk in B). The timing of the glutamate pulse is indicated by the arrowhead below each trace. Right column, Responses to the combined OT and dendritic glutamate stimulation. Due to the long-lasting NMDA spike/plateau, more action potentials were elicited by the EPSPs generated through the retinal input. Notice that the electrical train stimulation started 100 ms before the glutamate application. Response period used for comparison of the transfer ratio (see Results) is indicated by the thick gray line.

References

    1. Antic SD, Zhou WL, Moore AR, Short SM, Ikonomu KD. The decade of the dendritic NMDA spike. J Neurosci Res. 2010;88:2991–3001. doi: 10.1002/jnr.22444. - DOI - PMC - PubMed
    1. Augustinaite S, Heggelund P. Changes in firing pattern of lateral geniculate neurons caused by membrane potential dependent modulation of retinal input through NMDA receptors. J Physiol. 2007;582:297–315. doi: 10.1113/jphysiol.2007.131540. - DOI - PMC - PubMed
    1. Augustinaite S, Yanagawa Y, Heggelund P. Cortical feedback regulation of input to visual cortex: role of intrageniculate interneurons. J Physiol. 2011;589:2963–2977. doi: 10.1113/jphysiol.2011.205542. - DOI - PMC - PubMed
    1. Behabadi BF, Polsky A, Jadi M, Schiller J, Mel BW. Location-dependent excitatory synaptic interactions in pyramidal neuron dendrites. PLoS Comput Biol. 2012;8:e1002599. doi: 10.1371/journal.pcbi.1002599. - DOI - PMC - PubMed
    1. Blitz DM, Regehr WG. Retinogeniculate synaptic properties controlling spike number and timing in relay neurons. J Neurophysiol. 2003;90:2438–2450. doi: 10.1152/jn.00562.2003. - DOI - PubMed

Publication types

MeSH terms

Substances

LinkOut - more resources