. 2014 Aug 13;34(33):10924-36.
doi: 10.1523/JNEUROSCI.0084-14.2014.

Ribosome profiling reveals a cell-type-specific translational landscape in brain tumors

Affiliations

Ribosome profiling reveals a cell-type-specific translational landscape in brain tumors

Christian Gonzalez et al. J Neurosci. .

Abstract

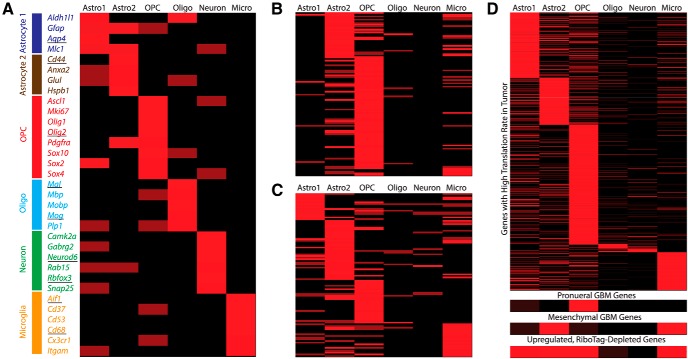
Glioma growth is driven by signaling that ultimately regulates protein synthesis. Gliomas are also complex at the cellular level and involve multiple cell types, including transformed and reactive cells in the brain tumor microenvironment. The distinct functions of the various cell types likely lead to different requirements and regulatory paradigms for protein synthesis. Proneural gliomas can arise from transformation of glial progenitors that are driven to proliferate via mitogenic signaling that affects translation. To investigate translational regulation in this system, we developed a RiboTag glioma mouse model that enables cell-type-specific, genome-wide ribosome profiling of tumor tissue. Infecting glial progenitors with Cre-recombinant retrovirus simultaneously activates expression of tagged ribosomes and delivers a tumor-initiating mutation. Remarkably, we find that although genes specific to transformed cells are highly translated, their translation efficiencies are low compared with normal brain. Ribosome positioning reveals sequence-dependent regulation of ribosomal activity in 5'-leaders upstream of annotated start codons, leading to differential translation in glioma compared with normal brain. Additionally, although transformed cells express a proneural signature, untransformed tumor-associated cells, including reactive astrocytes and microglia, express a mesenchymal signature. Finally, we observe the same phenomena in human disease by combining ribosome profiling of human proneural tumor and non-neoplastic brain tissue with computational deconvolution to assess cell-type-specific translational regulation.

Keywords: cell-type-specific expression; glioblastoma; glioma; ribosome profiling; translational regulation.


Figures

Figure 1.
Figure 1.
RiboTag mouse glioma model and cell-type-specific ribosome profiling. A, Schematic of the RiboTag glioma mouse model and experimental workflow. Cells infected by a retrovirus that expresses Cre recombinase and PDGF-B express the RiboTag (Rpl22-HA) and harbor a transforming genetic lesion- loss of Trp53. Polysomes are extracted from homogenate tumor tissue. Poly(A) RNA is selected from a portion of this for RNA-Seq. The remaining polysomes are digested to monosomes and purified on a sucrose gradient. The purified monosome sample is split in half. One-half is converted into a ribosome-profiling library. HA-tagged (RiboTag) monosomes originating from the transformed cells are immunoprecipitated from the other half and converted into a ribosome-profiling library. Translation rates from the homogenate and RiboTag ribosome profiles are compared in order to identify genes that are enriched or depleted in the transformed population. B, Immunofluorescence staining of tissue sections from an end-stage RiboTag glioma mouse showing the diversity of cell types present in the tumor. Cells expressing HA (the RiboTag epitope) overlap significantly with OLIG2- and PDGFRA-expressing cells. However, there is essentially no overlap between cells expressing HA and cells expressing GFAP (astrocytes), RBFOX3 (neurons), AIF1 (microglia), or CD44 (reactive astrocytes). C, Survival curves for Trp53flox/flox and wild-type mice after injection with PDGF-B-IRES-Cre virus indicating a median survival time of 47 ± 7 d postinjection for our mouse glioma model. D, Power spectrum of the 5′-end read positions along CDSs for the first 500 bases of the CDS for all genes with a CDS length of at least 500 bases. This power spectrum was computed from the RiboTag profile of Mouse A, demonstrating that RiboTag immunoprecipitation preserves the expected three-base periodicity arising from codons as indicated by the clear peak at a frequency of ∼0.33 nt−1. E, Heat map displaying the translation rate enrichment scores (plotted as score −1 where a score >1 indicates enrichment in the RiboTag profile and a score <1 indicates depletion) for several canonical markers of different cell types across three mice. The enrichment score is calculated by dividing the translation rate in the RiboTag profile by that in the homogenate profile.
Figure 2.
Figure 2.
Differential translation rate analysis. A, Information theory-based iPAGE analysis of over- and under-represented gene ontologies in genes with statistically significant (p < 0.05) high- and low-translation rate fold-changes indicating high translational output in the RiboTag sample and normal brain, respectively. Chromatin, DNA replication, cell division, and ribosomal pathways are over-represented among genes highly translated in the RiboTag sample, whereas coated pit, synapse, and cation-channel activity pathways are over-represented in the normal brain profile. B, Heat map displaying the translation rate fold-change and translation efficiency fold-change from differential translation rate analysis between the tumor homogenate and normal brain ribosome profiles. The genes in this heat map show statistically significant increased translation in the tumor homogenate relative to normal brain but are consistently depleted in the RiboTag profile, indicating expression in tumor associated cells. A subset of these genes, all but one of which exhibited higher translation efficiency in tumor tissue, was not found to have a statistically significant change in RNA abundance. C, Gene ontology analysis of upregulated, depleted genes from B with heat map of the odds ratio. Pathways in red and blue indicate overlap with mesenchymal and classical glioblastoma pathways, respectively. Pathways in purple indicate overlap with both mesenchymal and classical pathways.
Figure 3.
Figure 3.
Computational deconvolution of cell-type-specific gene expression. A, Cell-type distribution heat map of canonical neural marker genes based on computational deconvolution of 10 RNA-Seq profiles from 10 murine proneural gliomas. The columns are the cell types used for deconvolution and the values are normalized across rows. Genes used to seed the deconvolution algorithm are underlined. B, Cell-type distribution heat map of RiboTag-enriched genes based on deconvolution of the profiles in A showing a strong enrichment in the OPC lineage, consistent with the glial progenitor origin of the tumor. C, Cell-type distribution heat map of RiboTag-depleted genes based on deconvolution of the profiles in A showing the expected, significant representation of all six cell types for genes that are not tumor-specific.
Figure 4.
Figure 4.
Computational deconvolution in human and murine glioma. A, Cell-type distribution heat map of canonical lineage marker genes based on computational deconvolution of 39 RNA-Seq profiles from 39 human proneural gliomas from TCGA. The columns are the cell types used for deconvolution and the values are normalized across rows. Genes used to seed the deconvolution algorithm are underlined. B, Cell-type distribution heat map of the upregulated, RiboTag-depleted genes from Figure 2B based on computational deconvolution of the murine RNA-Seq profiles from Figure 3A. C, Cell-type distribution heat map of these same genes, as determined by deconvolution of the human RNA-Seq profiles. D, Cell-type distribution heat map of genes with high-translation rates (>2-fold across both specimens) in human proneural gliomas relative to non-neoplastic human brain tissue based on ribosome profiling. Cell type assignments for each gene are based on computational deconvolution of the proneural TCGA profiles (as in C). Below this heat map, we show three small heat maps showing the cell-type distribution of proneural classifier genes, mesenchymal classifier genes, and upregulated, RiboTag-depleted genes that also exhibit increased translation rates in human proneural glioma based on ribosome profiling. These small heat maps were constructed by summing the number of genes in each category with increased translation rate in the human glioma tissue that are predominantly deconvolved in each cell type.
Figure 5.
Figure 5.
Translation efficiency analysis from mouse and human ribosome profiling. A, Histograms of the mean translation efficiency for genes that are either enriched (red) or depleted (green) computed from ribosome profiles and RNA-Seq of the homogenate murine tumor samples. The tumor-specific, RiboTag-enriched genes show a statistically significant tendency toward lower translation efficiency. B, Histograms of the mean translation efficiency for genes that are either enriched (red) or depleted (green) computed from the ribosome profiles and RNA-Seq of the murine normal brain samples. There is no statistically significant difference between the two gene sets in normal brain. C, Histogram of the translation efficiency fold-change between tumor homogenate and normal brain for the RiboTag-enriched and RiboTag-depleted genes showing that ∼90% of RiboTag-enriched genes are translationally downregulated in the murine tumors. D, Histograms of the mean translation efficiency for genes that are predominantly expressed in Olig2+ (red) or Olig2 (green) cells (based on proneural TCGA deconvolution) computed from ribosome profiles and RNA-Seq of the human proneural tumor samples. Genes deconvolved in Olig2+ cells show a statistically significant tendency toward lower translation efficiency, similar to the RiboTag-enriched genes in the mouse model. E, Histograms of the mean translation efficiency for genes that are predominantly expressed in Olig2+ (red) or Olig2 (green) cells (same genes as in D) computed from the ribosome profiles and RNA-Seq of the human non-neoplastic brain tissue. There is a significantly smaller shift in translation efficiency compared with the tumor tissue in D. F, Histogram of the translation efficiency fold-change between tumor and non-neoplastic brain tissue for genes deconvolved in the Olig2+ (red) or Olig2 (green) cells showing that >70% of genes associated with Olig2+ cells are translationally downregulated in the human proneural tumors.
Figure 6.
Figure 6.
Translation efficiency in reactive cell types in the mouse model. A, Cell-type-specific translation efficiency histograms for all RiboTag-depleted genes based on the homogenate ribosome profiling and deconvolution. B, Grouping the cell types into reactive (astro2, OPC, microglia) and unreactive (astro1, oligodendrocyte, neuron) reveals a significant shift toward lower translation efficiency for reactive cells.
Figure 7.
Figure 7.
Analysis of noncanonical translation in murine and human glioma. A, Histograms of the translation efficiency of genes with 5′-leader density across all three RiboTag profiles that either contain (red) or lack (green) uAUG. B, Histograms of the translation efficiency of genes with 5′-leader density across all three normal brain profiles that either contain (red) or lack (green) uAUG. C, Histogram of the ratio of 5′-leader efficiency fold-change to CDS translation efficiency fold-change for genes with 5′-leader density in all three RiboTag mice and either contain (red) or lack (green) uAUG. Fold-change in 5′-leader and CDS translation efficiencies are calculated between the tumor homogenate and normal brain samples. D, Histograms of the translation efficiency of genes with 5′-leader density across both human proneural glioma ribosome profiles that either contain (red) or lack (green) uAUG. E, Histograms of the translation efficiency of genes with 5′-leader density across all three human non-neoplastic brain ribosome profiles that either contain (red) or lack (green) uAUG. F, Histogram of the ratio of 5′-leader efficiency fold-change to CDS translation efficiency fold-change for genes with 5′-leader density in both human proneural glioma ribosome profiles and either contain (red) or lack (green) uAUG. Fold-change in 5′-leader and CDS translation efficiencies are calculated between the human tumor and non-neoplastic brain samples.

Similar articles

Cited by

References

    1. Anders S, Huber W. Differential expression analysis for sequence count data. Genome Biol. 2010;11:R106. doi: 10.1186/gb-2010-11-10-r106. - DOI - PMC - PubMed
    1. Arribere JA, Gilbert WV. Roles for transcript leaders in translation and mRNA decay revealed by transcript leader sequencing. Genome Res. 2013;23:977–987. doi: 10.1101/gr.150342.112. - DOI - PMC - PubMed
    1. Assanah M, Lochhead R, Ogden A, Bruce J, Goldman J, Canoll P. Glial progenitors in adult white matter are driven to form malignant gliomas by platelet-derived growth factor-expressing retroviruses. J Neurosci. 2006;26:6781–6790. doi: 10.1523/JNEUROSCI.0514-06.2006. - DOI - PMC - PubMed
    1. Barbosa C, Peixeiro I, Romão L. Gene expression regulation by upstream open reading frames and human disease. PLoS Genet. 2013;9:e1003529. doi: 10.1371/journal.pgen.1003529. - DOI - PMC - PubMed
    1. Bédard A, Tremblay P, Chernomoretz A, Vallières L. Identification of genes preferentially expressed by microglia and upregulated during cuprizone-induced inflammation. Glia. 2007;55:777–789. doi: 10.1002/glia.20477. - DOI - PubMed

Publication types