. 2014 Aug 13;34(33):11119-30.
doi: 10.1523/JNEUROSCI.4767-13.2014.

Multisensory training improves auditory spatial processing following bilateral cochlear implantation

Affiliations

Multisensory training improves auditory spatial processing following bilateral cochlear implantation

Amal Isaiah et al. J Neurosci. .

Abstract

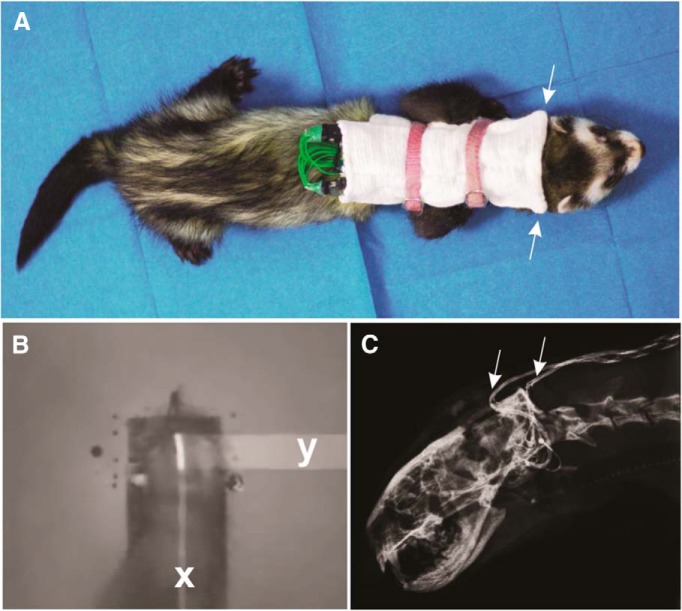
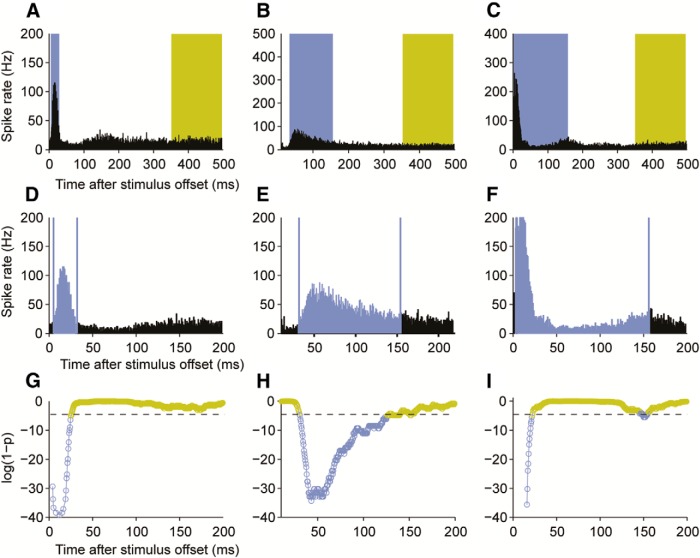
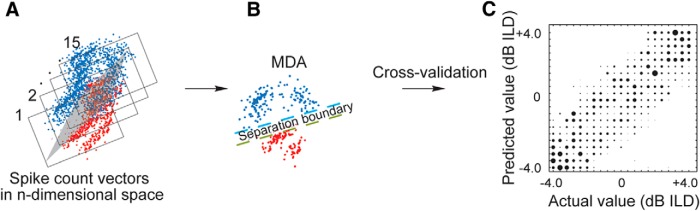
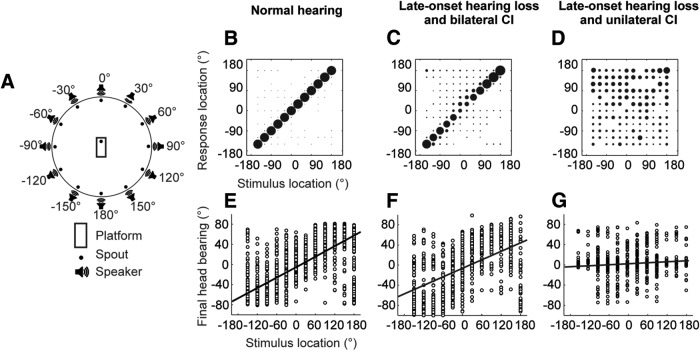
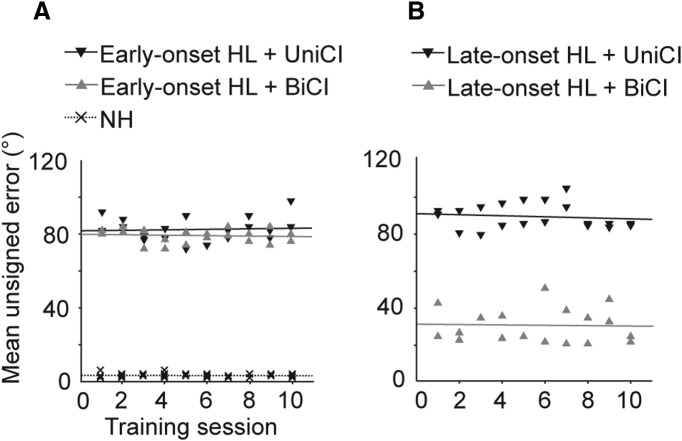
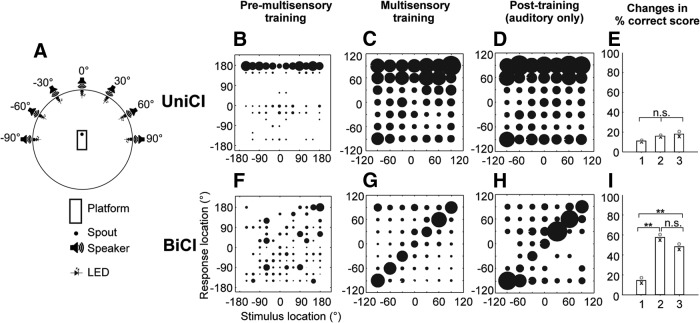
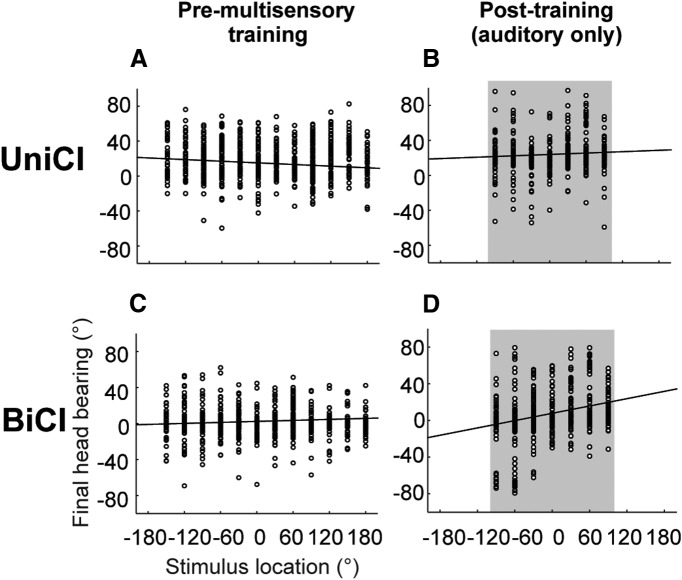
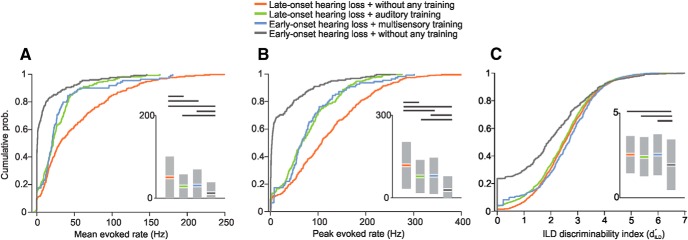
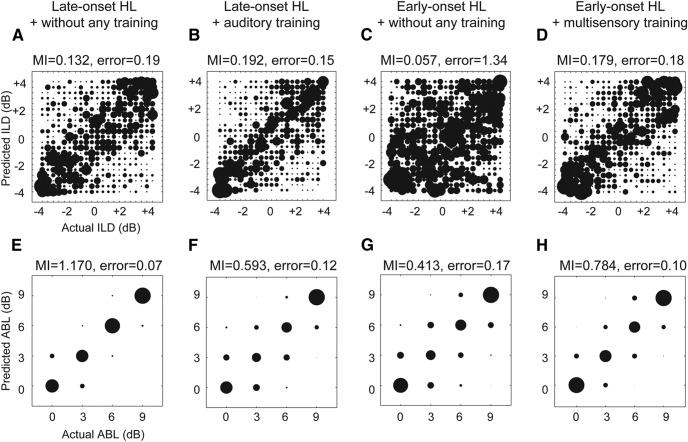
Cochlear implants (CIs) partially restore hearing to the deaf by directly stimulating the inner ear. In individuals fitted with CIs, lack of auditory experience due to loss of hearing before language acquisition can adversely impact outcomes. For example, adults with early-onset hearing loss generally do not integrate inputs from both ears effectively when fitted with bilateral CIs (BiCIs). Here, we used an animal model to investigate the effects of long-term deafness on auditory localization with BiCIs and approaches for promoting the use of binaural spatial cues. Ferrets were deafened either at the age of hearing onset or as adults. All animals were implanted in adulthood, either unilaterally or bilaterally, and were subsequently assessed for their ability to localize sound in the horizontal plane. The unilaterally implanted animals were unable to perform this task, regardless of the duration of deafness. Among animals with BiCIs, early-onset hearing loss was associated with poor auditory localization performance, compared with late-onset hearing loss. However, performance in the early-deafened group with BiCIs improved significantly after multisensory training with interleaved auditory and visual stimuli. We demonstrate a possible neural substrate for this by showing a training-induced improvement in the responsiveness of auditory cortical neurons and in their sensitivity to interaural level differences, the principal localization cue available to BiCI users. Importantly, our behavioral and physiological evidence demonstrates a facilitative role for vision in restoring auditory spatial processing following potential cross-modal reorganization. These findings support investigation of a similar training paradigm in human CI users.

Keywords: auditory cortex; cochlear implant; cross-modal plasticity; hearing loss; multisensory; sound localization.


Figures

Figure 1.
Figure 1.
Behavioral training methods and cochlear implantation in ferrets. A, A ferret fitted with BiCIs and speech processors carried within a backpack. Arrows point to the location of microphones. Backpacks were secured by harnesses that did not hinder the mobility of the animal. B, Measurement of head-orienting accuracy. A strip of adhesive reflective tape was placed on the animal's head (white strip), and changes in the x-y coordinates of the tape were captured at a rate of 50 Hz by an infrared camera mounted directly overhead. C, x-ray illustrating the position of the implant lead wires (arrows) that were tunneled subcutaneously to reach the bulla, behind the ear.
Figure 2.
Figure 2.
Representative response patterns observed in three different A1 units after intracochlear stimulation via a CI. A–C, Peristimulus time histograms, over which response periods (blue) and periods of spontaneous activity (yellow) have been superimposed. The start and end times of the response window were determined for each unit using a binless algorithm in which a sliding window was moved forward in time in 1 ms steps, comparing the firing rate within that window with that in a preset spontaneous window. The algorithm automatically resizes the response window based on a trail of activity, and this is terminated when the firing rate that is no longer significantly different from that in the spontaneous window. D–F, To demonstrate algorithm performance, higher-resolution peristimulus time histograms are plotted for these same units, with the estimated response window indicated by the blue vertical lines. Significant responses were most commonly restricted to the first 50 ms (D), although longer latency (E) and more prolonged (F) responses were also observed. G–I, Log(1-probability) of responses for these units as a function of time, where the threshold of significance is indicated by the horizontal broken line. Blue circles represent significant evoked activity. Yellow circles represent activity that is no different from spontaneous levels. Because evoked activity was rarely observed beyond 100 ms, initial bounds of 5–105 ms were set for all units within which the response window was optimized using this procedure.
Figure 3.
Figure 3.
Schematic showing the steps taken in the MDA used in this study. A, After subtracting the spontaneous rates and z-scoring, a principal components analysis was performed on the spike count vectors (represented by the dots) for each unit at each ILD-ABL combination (21 ILDs × 4 ABLs) for each of 15 stimulus repetitions (indicated by incremental counts from 1 to 15). In this case, the data are shown projected along the first (PC1, blue) and second (PC2, red) principal components. A feature space was then constructed composed of the 10 principal components that account for a substantial portion of the variance within the dataset. The MDA estimates the probability with which each response vector was assigned to the correct ILD/ABL value according to the similarity between the responses to each of the 15 stimulus repetitions. The centroid of each vector was calculated; and for every subsequent repeat, this was compared with the centroid of a previous (random) repeat of the stimulus. The data were then projected on to a reduced-dimension space (B), and the spike count vectors were separated into discrete and dissimilar clusters (dashed lines, also represented by the gray region in A). Once the classifier was “trained” in this fashion, a random spike count vector was removed from the dataset and the classifier run to estimate the value of this missing stimulus. The probability of assigning a spike count vector to its unique stimulus was then estimated by this cross-validation process. C, The performance of this classifier was evaluated by comparing the actual ILD or ABL value (x-axis) with the predicted value (y-axis), where perfect performance is indicated by the 45° diagonal, and quantified by estimating the mutual information between the actual and predicted values for both ILD and ABL.
Figure 4.
Figure 4.
Sound localization after unilateral or bilateral cochlear implantation in ferrets that were deafened in adulthood. A, Testing chamber with 12 loudspeakers arranged circumferentially. A trial was initiated when the animal mounted the central platform and licked the start spout; a fluid reward was provided if the animal then approached and licked the spout adjacent to the loudspeaker from which the stimulus had been presented. B–D, Stimulus–response plots for ferrets with NH (B, n = 4), and in animals with late-onset hearing loss and either BiCIs (C, n = 2) or a UniCI (D, n = 2). The stimuli were broadband noise bursts with a duration of 2000 ms. The size of the dots indicates the proportion of responses made to each loudspeaker location. Although a clear correlation between the stimulus and response locations was observed for the control and bilaterally implanted ferrets, this was not the case for the animals with a CI in one ear only (F(2,72) = 47.24, p < 0.001, ANOVA; post hoc comparisons revealed significant differences between each group, p < 0.001). E–G, Stimulus–response plots showing the distribution of final head bearings as a function of stimulus location, for NH animals (E) and those with late-onset hearing loss and BiCIs (F) or a UniCI (G). Significant group differences in the slopes of the best-fitting linear regressions were found for these head-orienting data (F(2,5693) = 8.03, p < 0.001; ANOVA). Post hoc comparisons showed that all slopes were significantly different from each other (p < 0.001) and, importantly, that the slope of the regression line fitted to the head-orienting data from the UniCI animals was not significantly different from zero (p = 0.16), indicating that these animals were unable to localize these sounds.
Figure 5.
Figure 5.
Effect of training on auditory localization accuracy. A, Magnitude of the unsigned errors averaged for all incorrect trials and speaker locations over 10 consecutive training sessions for NH ferrets, and for ferrets with early-onset deafness that were fitted with a UniCI (n = 2) or BiCIs (n = 2) as adults. Each symbol represents a different animal. HL, Hearing loss. B, Equivalent data for ferrets with late-onset deafness and a UniCI (n = 2) or BiCIs (n = 2). In each case, the slopes of the fitted regression lines did not differ either between the groups (ANCOVA, p = 0.6) or from zero (t tests, p = 0.59).
Figure 6.
Figure 6.
Effect of multisensory training on sound localization accuracy in ferrets with early-onset hearing loss. A, Testing chamber with seven loudspeakers and light-emitting diodes arranged at 30° intervals in the frontal hemifield. Auditory performance of the ferrets with a UniCI (B–E) or BiCIs (F–I) are grouped by training experience. B, F, Stimulus-response plots using all 12 loudspeakers covering the full 360° of azimuth (as in Fig. 4A) before the start of multisensory training with the multisensory setup. At this stage, no difference was found between the performance of animals with a UniCI and those with BiCIs. C, G, Stimulus-response plots for the final session of multisensory training. Subsequently, the visual stimuli were discontinued and animals were trained with auditory stimuli only for another 10 sessions. D, H, Stimulus-response plots for the last of these sound-only sessions. E, I, Mean percentage correct scores before, during, and after multisensory training. No change in auditory localization performance (proportion of correct trials) was found in the ferrets with a single CI, whereas multisensory training resulted in a significant improvement in the bilaterally implanted animals, which persisted after removal of the visual cues. Statistical comparisons are provided in text.
Figure 7.
Figure 7.
Effect of multisensory training on the relationship between final head bearing and auditory target location in implanted animals with early-onset hearing loss. A–D, Stimulus-response plots showing the distribution of final head bearings as a function of stimulus location for animals fitted with a UniCI (A, B) or BiCIs (C, D). Data are shown before (A, C) and after multisensory training (B, D), and linear regression lines have been fitted in each case. The slopes of these lines increased for both groups of early-deafened ferrets, but post hoc comparisons showed that the slope was significantly higher after multisensory training (D) in the bilaterally implanted animals than before training (C) and at either stage in the UniCI group, whereas no significant differences were found for any of the other pairwise comparisons. B, D, Gray shaded area represents the frontal hemifield within which the multisensory training was provided.
Figure 8.
Figure 8.
Cumulative probability functions showing the relative magnitude of the stimulus-evoked responses of A1 neurons, grouped by age of onset of hearing loss and training history in animals with BiCIs. A, Mean sound-evoked firing rates. B, Peak sound-evoked firing rates. C, ILD discriminability index computed from rate-level functions. Insets, Modified box-plots showing the means and 95% confidence intervals of each spike rate measure, grouped in the same fashion as the probability functions. The probability functions and bars indicating that the means have been color-coded to identify the different groups. The horizontal lines indicate significant intergroup differences, as revealed by Tukey HSD tests for post-ANOVA pairwise comparisons.
Figure 9.
Figure 9.
Results of the MDA of ILD and ABL coding by auditory cortical neurons in ferrets with BiCIs, grouped by age at onset of hearing loss and training history. The size of each circle in the bubble plots is proportional to the number of classifications made for a given stimulus value. The x- and y-axes in each plot represent the true and classifier-assigned identities, respectively. A–D, ILD coding in acutely deafened and implanted adult animals that did not receive behavioral training (A), and in animals with late-onset hearing loss followed by cochlear implantation and auditory training (B). Early-onset hearing loss followed by cochlear implantation in adulthood without any training (C), and early-onset hearing loss followed by cochlear implantation in adulthood with auditory alone and then multisensory training (D). In the untrained animals with early-onset hearing loss (C), the ILD sensitivity of cortical units was poor, as indicated by the relatively large number and magnitude of classification errors, whereas training produced a significant increase in classification accuracy (D). The MI between model-predicted and actual ILD is shown above each confusion matrix. The mean absolute error associated with each classification is also indicated above each plot. EH, ABL coding by auditory cortical neurons for the same four groups. MI for ABL coding is also indicated above each panel.

Similar articles

Cited by

References

    1. Allman BL, Keniston LP, Meredith MA. Adult deafness induces somatosensory conversion of ferret auditory cortex. Proc Natl Acad Sci U S A. 2009;106:5925–5930. doi: 10.1073/pnas.0809483106. - DOI - PMC - PubMed
    1. Bavelier D, Neville HJ. Cross-modal plasticity: where and how? Nat Rev Neurosci. 2002;3:443–452. doi: 10.1093/cercor/bhs340. - DOI - PubMed
    1. Bavelier D, Dye MW, Hauser PC. Do deaf individuals see better? Trends Cogn Sci. 2006;10:512–518. doi: 10.1016/j.tics.2006.09.006. - DOI - PMC - PubMed
    1. Bernstein LE, Auer ET, Jr, Eberhardt SP, Jiang J. Auditory perceptual learning for speech perception can be enhanced by audiovisual training. Front Neurosci. 2013;7:34. doi: 10.3389/fnins.2013.00034. - DOI - PMC - PubMed
    1. Berrettini S, Baggiani A, Bruschini L, Cassandro E, Cuda D, Filipo R, Palla I, Quaranta N, Forli F. Systematic review of the literature on the clinical effectiveness of the cochlear implant procedure in adult patients. Acta Otorhinolaryngol Ital. 2011;31:299–310. - PMC - PubMed

Publication types