

The natural product phyllanthusmin C enhances IFN-γ production by human NK cells through upregulation of TLR-mediated NF-κB signaling
- PMID: 25122922
- PMCID: PMC4162489
- DOI: 10.4049/jimmunol.1302600
The natural product phyllanthusmin C enhances IFN-γ production by human NK cells through upregulation of TLR-mediated NF-κB signaling
Abstract
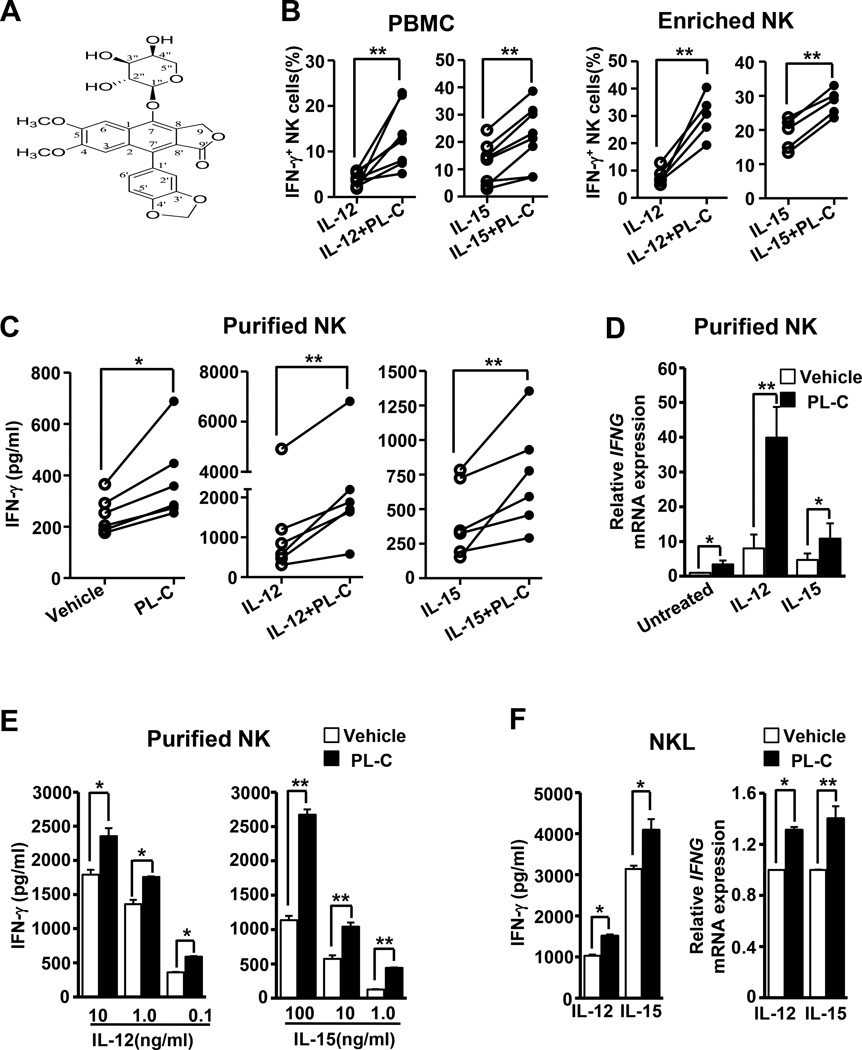
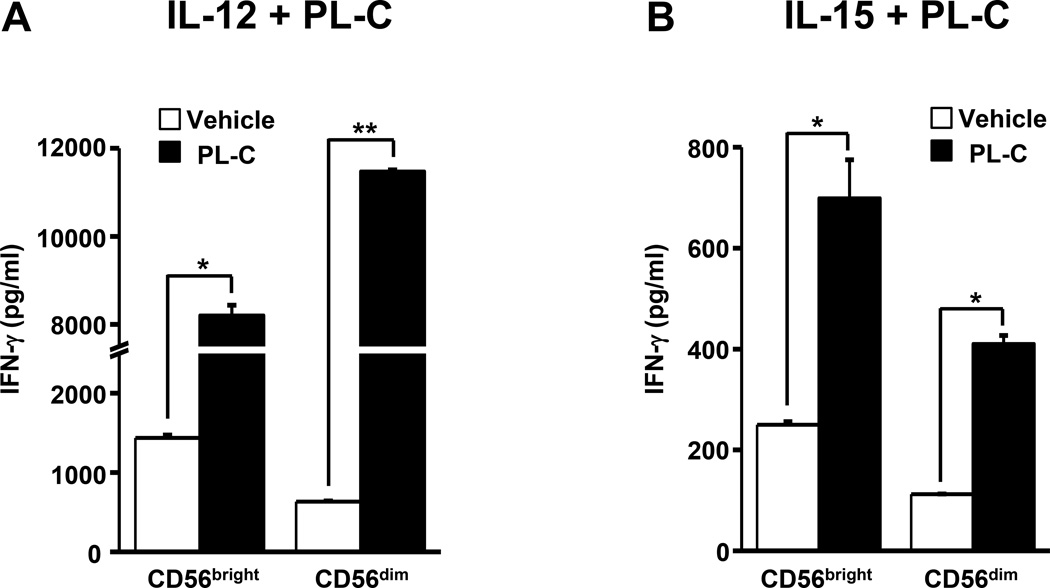
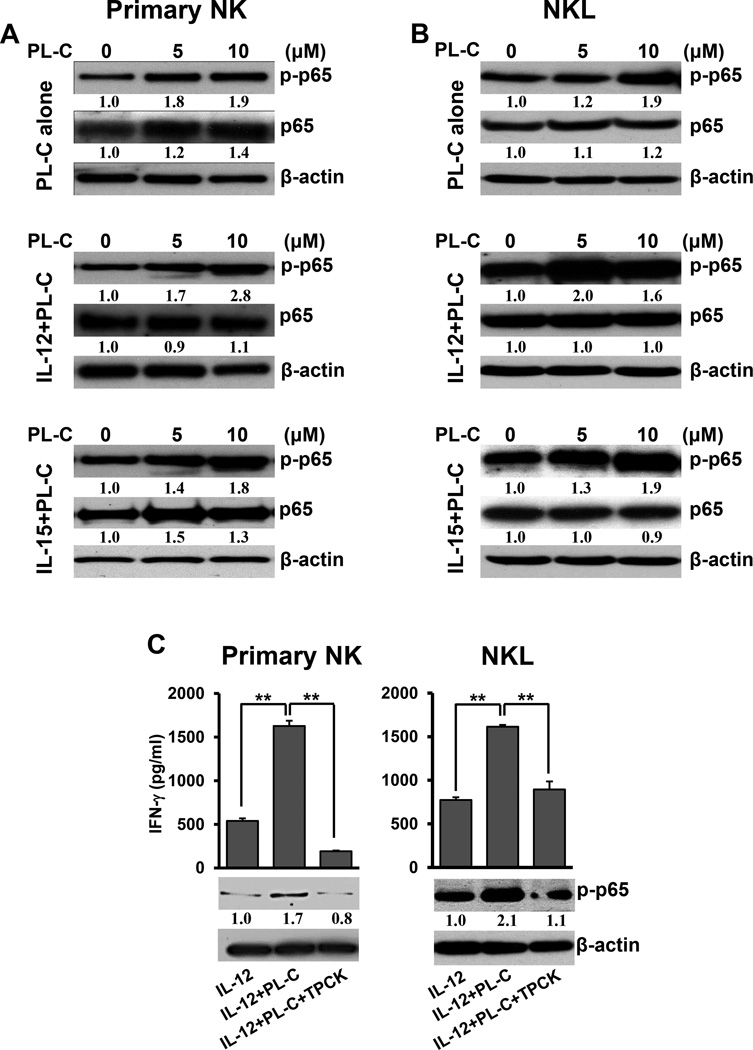
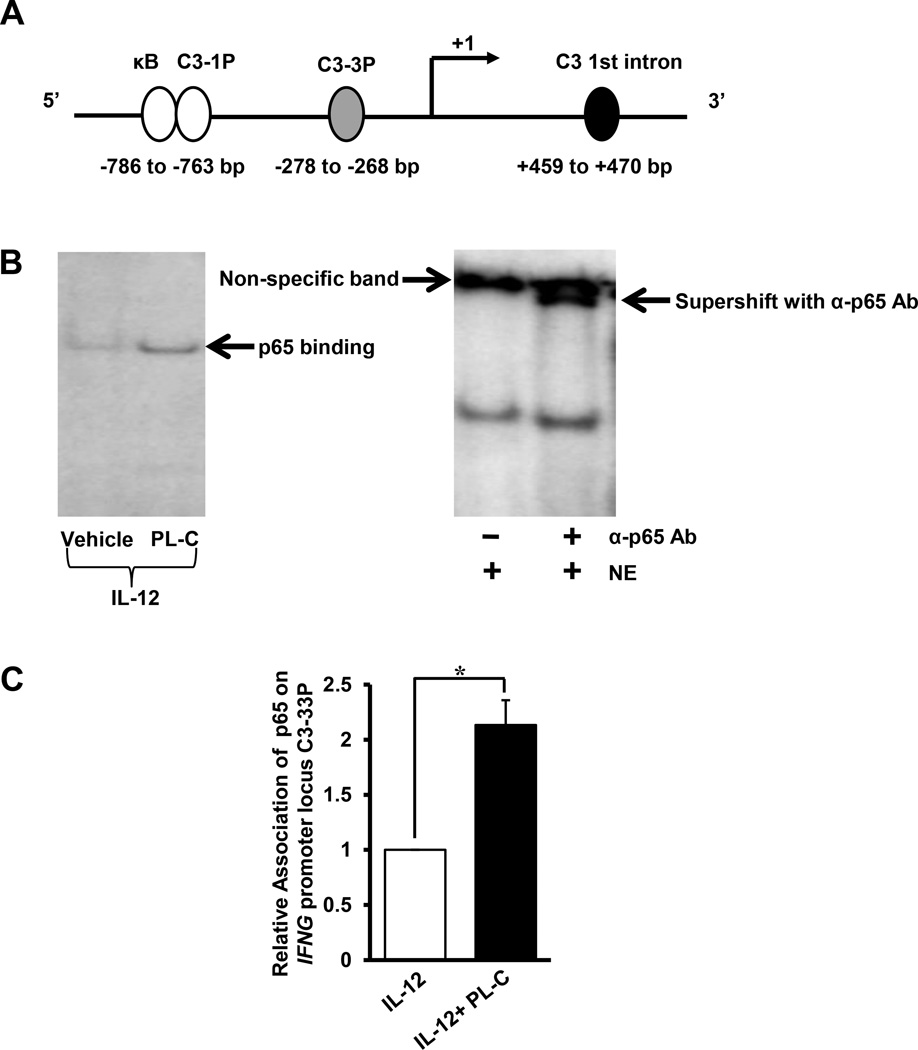
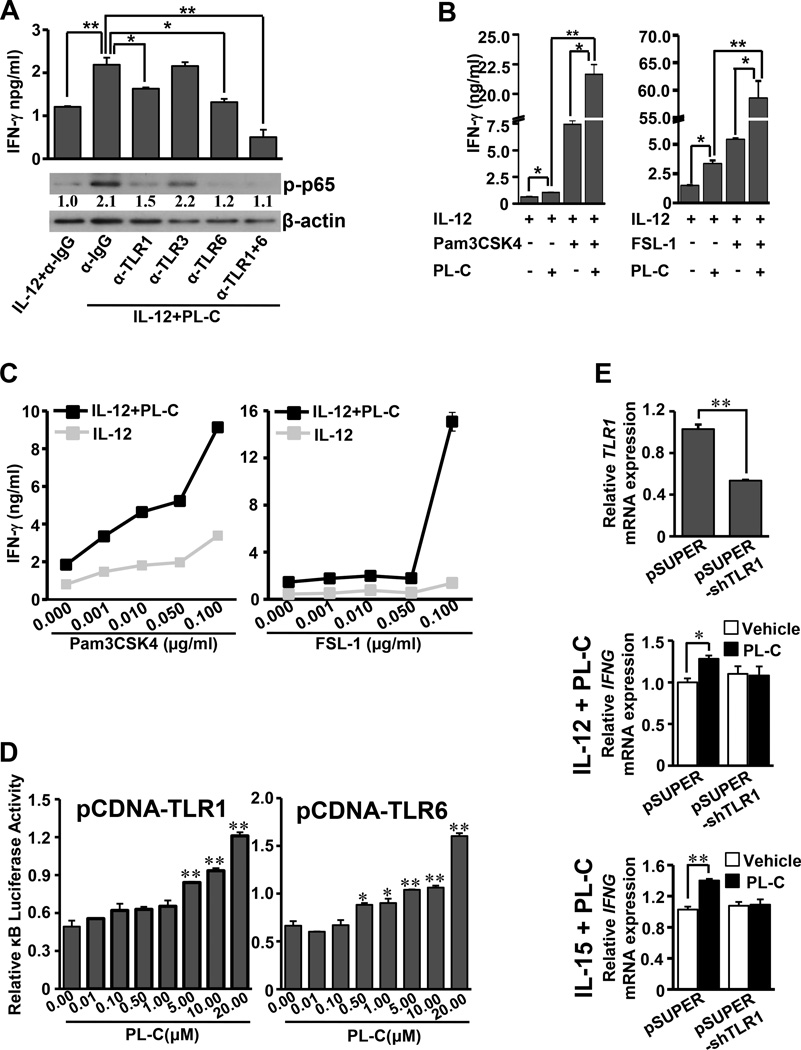
Natural products are a major source for cancer drug development. NK cells are a critical component of innate immunity with the capacity to destroy cancer cells, cancer-initiating cells, and clear viral infections. However, few reports describe a natural product that stimulates NK cell IFN-γ production and unravel a mechanism of action. In this study, through screening, we found that a natural product, phyllanthusmin C (PL-C), alone enhanced IFN-γ production by human NK cells. PL-C also synergized with IL-12, even at the low cytokine concentration of 0.1 ng/ml, and stimulated IFN-γ production in both human CD56(bright) and CD56(dim) NK cell subsets. Mechanistically, TLR1 and/or TLR6 mediated PL-C's activation of the NF-κB p65 subunit that in turn bound to the proximal promoter of IFNG and subsequently resulted in increased IFN-γ production in NK cells. However, IL-12 and IL-15Rs and their related STAT signaling pathways were not responsible for the enhanced IFN-γ secretion by PL-C. PL-C induced little or no T cell IFN-γ production or NK cell cytotoxicity. Collectively, we identify a natural product with the capacity to selectively enhance human NK cell IFN-γ production. Given the role of IFN-γ in immune surveillance, additional studies to understand the role of this natural product in prevention of cancer or infection in select populations are warranted.
Copyright © 2014 by The American Association of Immunologists, Inc.
Conflict of interest statement
The authors declare no competing financial interests.
Figures
Similar articles
-
Interleukin-1beta costimulates interferon-gamma production by human natural killer cells.Eur J Immunol. 2001 Mar;31(3):792-801. doi: 10.1002/1521-4141(200103)31:3<792::aid-immu792>3.0.co;2-u. Eur J Immunol. 2001. PMID: 11241284
-
Regulation of Human Natural Killer Cell IFN-γ Production by MicroRNA-146a via Targeting the NF-κB Signaling Pathway.Front Immunol. 2018 Mar 9;9:293. doi: 10.3389/fimmu.2018.00293. eCollection 2018. Front Immunol. 2018. PMID: 29593706 Free PMC article.
-
IL-18/IL-15/IL-12 synergy induces elevated and prolonged IFN-γ production by ex vivo expanded NK cells which is not due to enhanced STAT4 activation.Mol Immunol. 2017 Aug;88:138-147. doi: 10.1016/j.molimm.2017.06.025. Epub 2017 Jun 20. Mol Immunol. 2017. PMID: 28644973
-
TLR7/8-mediated activation of human NK cells results in accessory cell-dependent IFN-gamma production.J Immunol. 2005 Aug 1;175(3):1636-42. doi: 10.4049/jimmunol.175.3.1636. J Immunol. 2005. PMID: 16034103
-
Differential IFN-γ production by adult and neonatal blood CD56+ natural killer (NK) and NK-like-T cells in response to Trypanosoma cruzi and IL-15.Parasite Immunol. 2014 Jan;36(1):43-52. doi: 10.1111/pim.12077. Parasite Immunol. 2014. PMID: 24102464 Free PMC article.
Cited by
-
B7H6 Serves as a Negative Prognostic Marker and an Immune Modulator in Human Pancreatic Cancer.Front Oncol. 2022 Mar 3;12:814312. doi: 10.3389/fonc.2022.814312. eCollection 2022. Front Oncol. 2022. PMID: 35311080 Free PMC article.
-
Advances in plant-derived natural products for antitumor immunotherapy.Arch Pharm Res. 2021 Nov;44(11):987-1011. doi: 10.1007/s12272-021-01355-1. Epub 2021 Nov 9. Arch Pharm Res. 2021. PMID: 34751930 Review.
-
LNGFR targets the Wnt/β-catenin pathway and promotes the osteogenic differentiation in rat ectomesenchymal stem cells.Sci Rep. 2017 Sep 8;7(1):11021. doi: 10.1038/s41598-017-11555-9. Sci Rep. 2017. PMID: 28887537 Free PMC article.
-
The immunostimulatory activity of Epimedium flavonoids involves toll-like receptor 7/8.Front Pharmacol. 2025 Apr 25;16:1514284. doi: 10.3389/fphar.2025.1514284. eCollection 2025. Front Pharmacol. 2025. PMID: 40351409 Free PMC article.
-
Cytotoxic and natural killer cell stimulatory constituents of Phyllanthus songboiensis.Phytochemistry. 2015 Mar;111:132-40. doi: 10.1016/j.phytochem.2014.12.014. Epub 2015 Jan 14. Phytochemistry. 2015. PMID: 25596805 Free PMC article.
References
-
- Smyth MJ, Hayakawa Y, Takeda K, Yagita H. New aspects of natural-killer-cell surveillance and therapy of cancer. Nat Rev Cancer. 2002;2:850–861. - PubMed
-
- Vivier E, Tomasello E, Baratin M, Walzer T, Ugolini S. Functions of natural killer cells. Nat Immunol. 2008;9:503–510. - PubMed
-
- Lee SH, Miyagi T, Biron CA. Keeping NK cells in highly regulated antiviral warfare. Trends Immunol. 2007;28:252–259. - PubMed
Publication types
MeSH terms
Substances
Grants and funding
- CA163205/CA/NCI NIH HHS/United States
- R01 CA185301/CA/NCI NIH HHS/United States
- CA155521/CA/NCI NIH HHS/United States
- R01 CA155521/CA/NCI NIH HHS/United States
- R01 CA068458/CA/NCI NIH HHS/United States
- P01 CA125066/CA/NCI NIH HHS/United States
- CA125066/CA/NCI NIH HHS/United States
- T32 CA090223/CA/NCI NIH HHS/United States
- OD018403/OD/NIH HHS/United States
- R37 CA068458/CA/NCI NIH HHS/United States
- P01 CA163205/CA/NCI NIH HHS/United States
- T32 CA009338/CA/NCI NIH HHS/United States
- R41 OD018403/OD/NIH HHS/United States
- CA068458/CA/NCI NIH HHS/United States
LinkOut - more resources
Full Text Sources
Other Literature Sources
Research Materials
Miscellaneous
