. 2015 Aug;90(3):891-926.
doi: 10.1111/brv.12137. Epub 2014 Aug 15.

Daily torpor and hibernation in birds and mammals

Affiliations

Daily torpor and hibernation in birds and mammals

Thomas Ruf et al. Biol Rev Camb Philos Soc. 2015 Aug.

Abstract

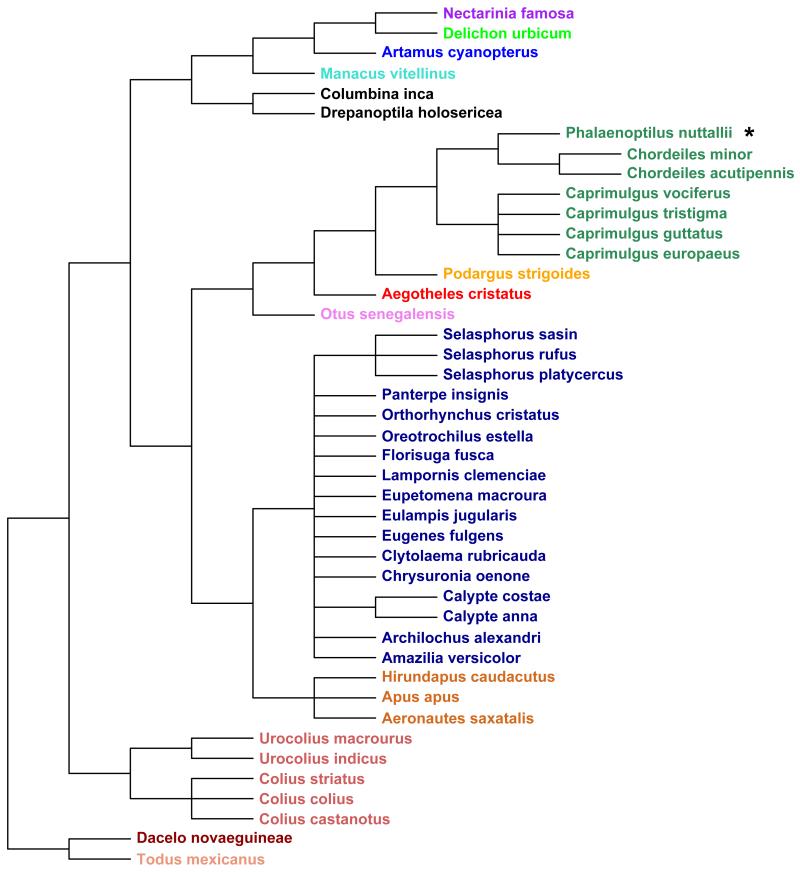
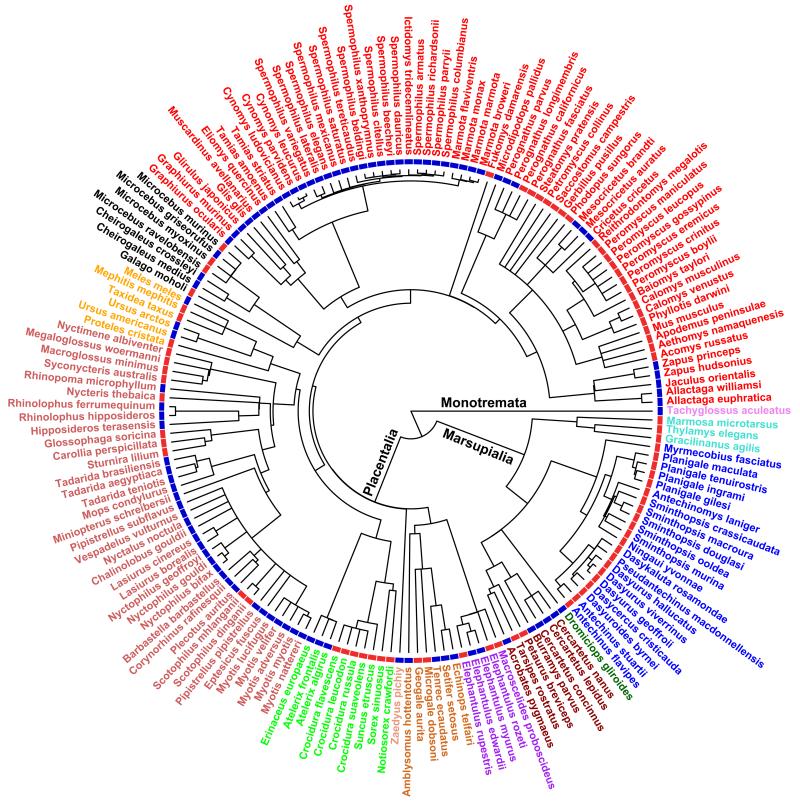
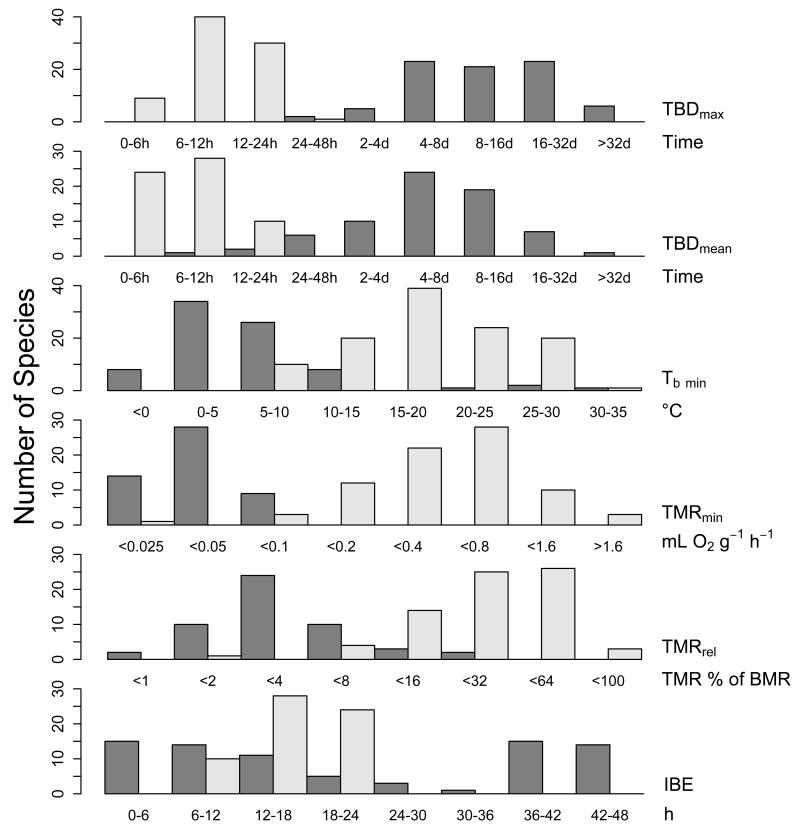
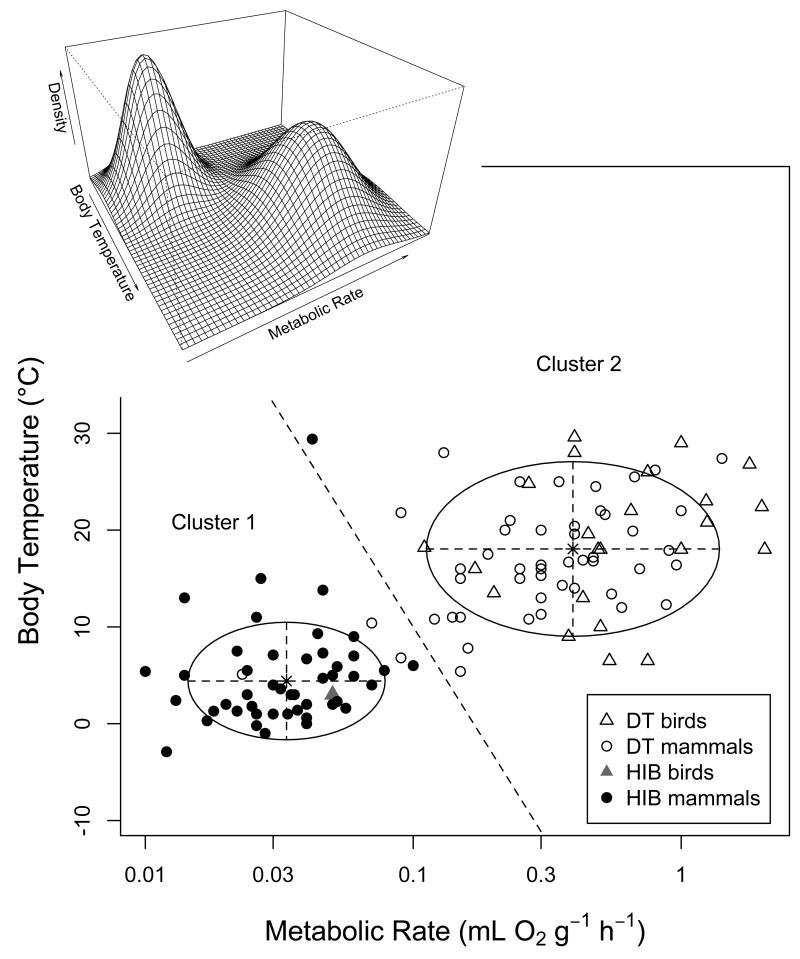
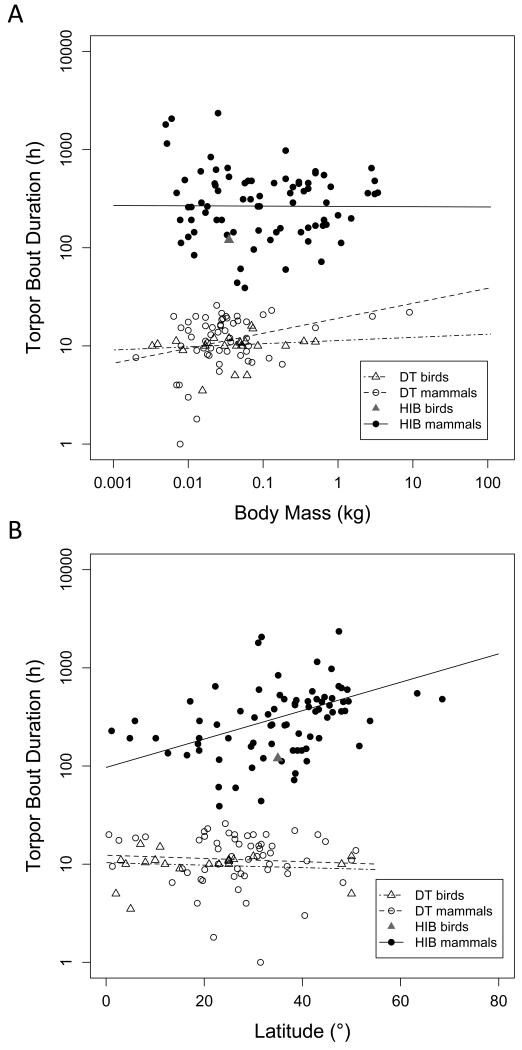
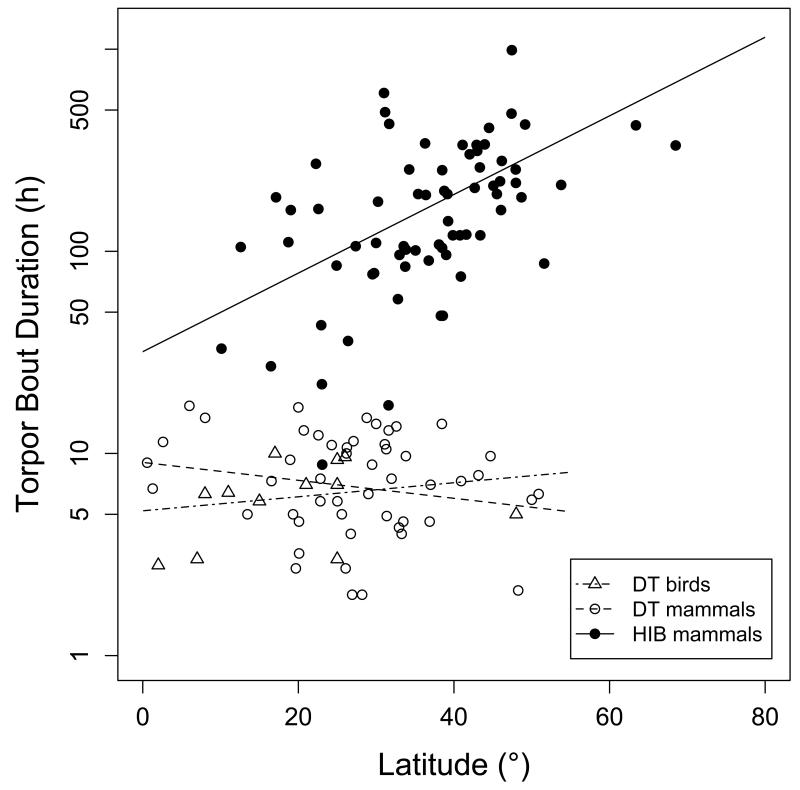
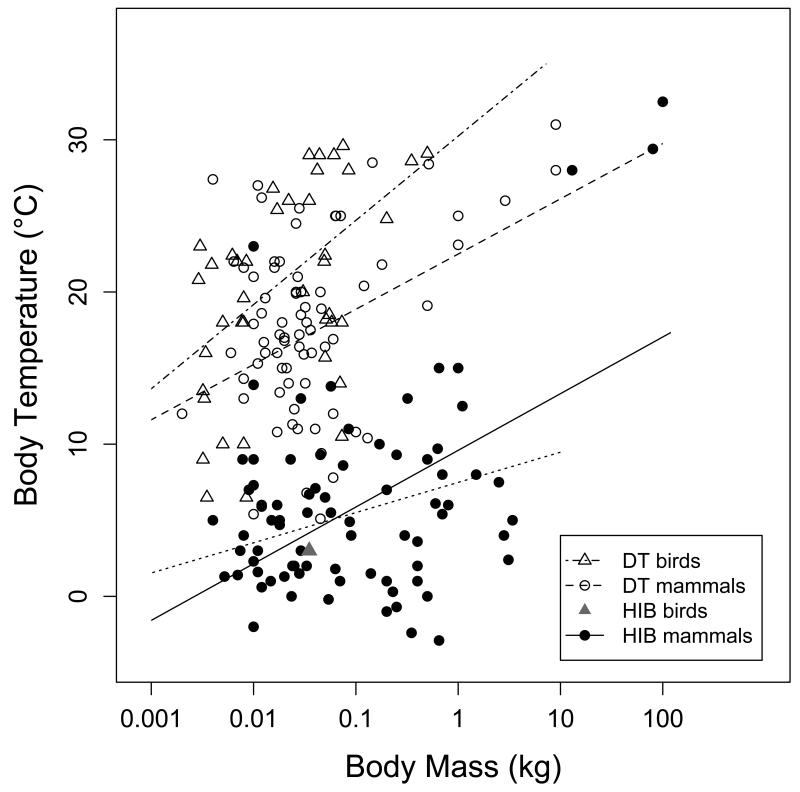
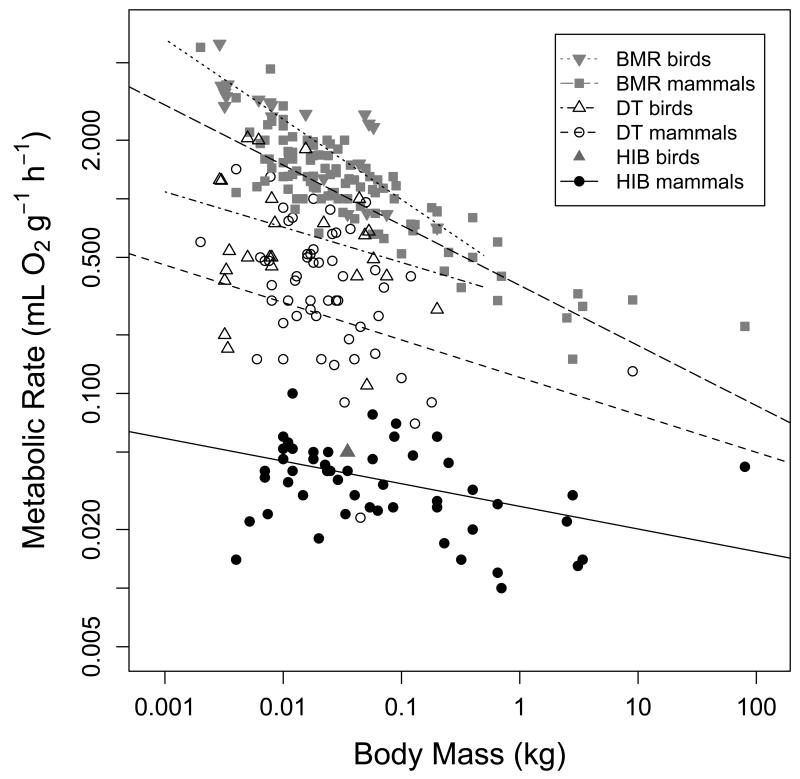
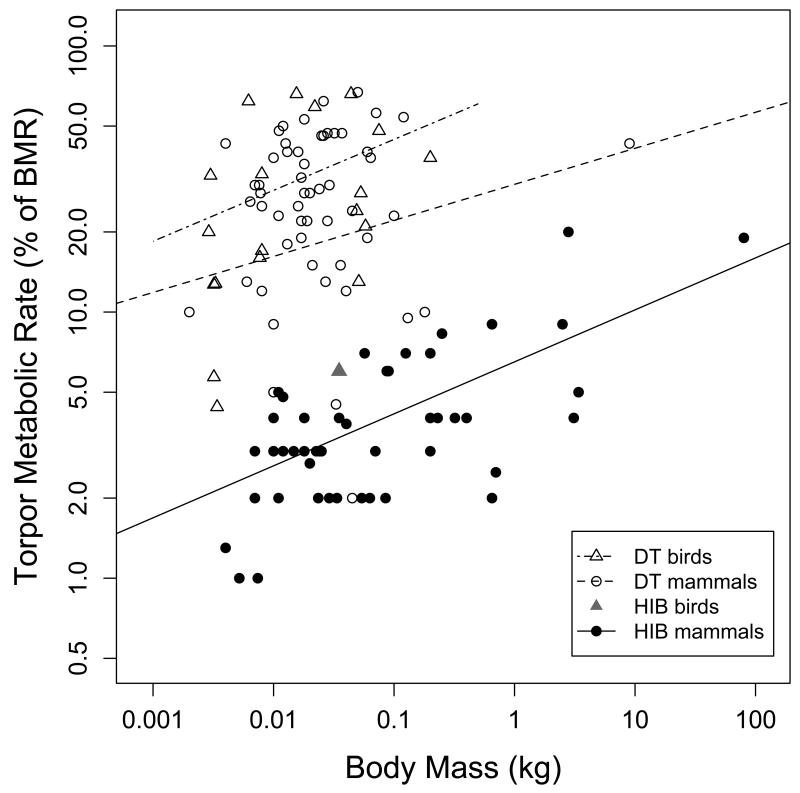
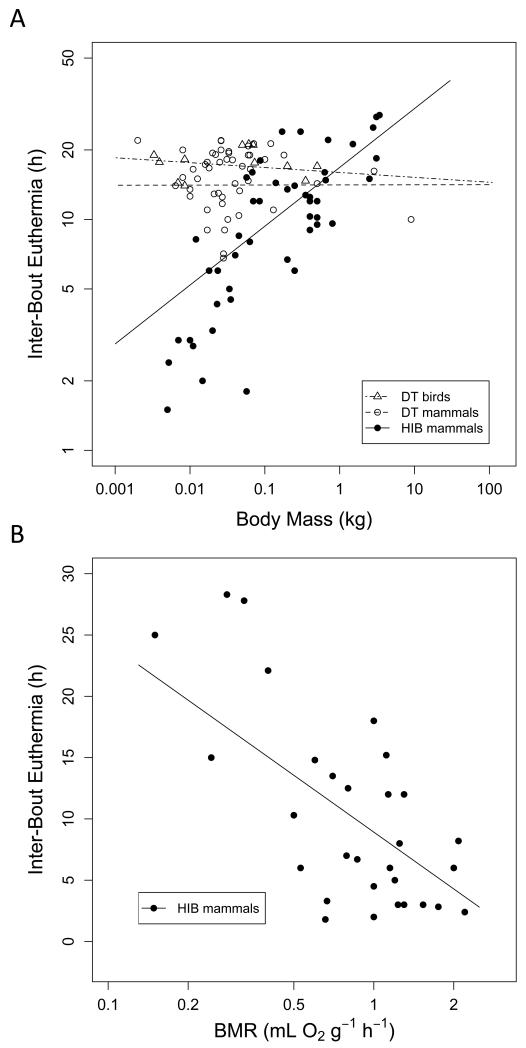
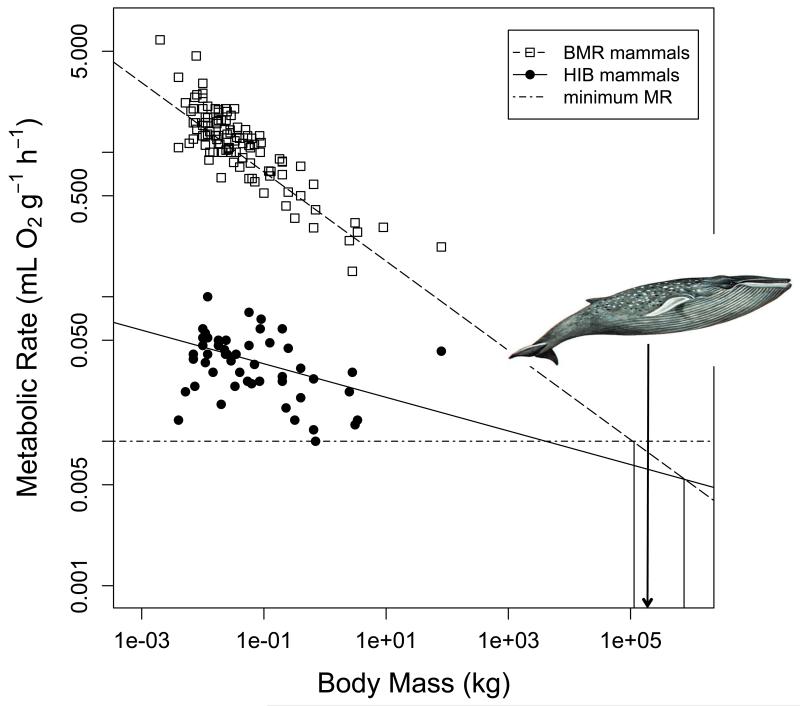
Many birds and mammals drastically reduce their energy expenditure during times of cold exposure, food shortage, or drought, by temporarily abandoning euthermia, i.e. the maintenance of high body temperatures. Traditionally, two different types of heterothermy, i.e. hypometabolic states associated with low body temperature (torpor), have been distinguished: daily torpor, which lasts less than 24 h and is accompanied by continued foraging, versus hibernation, with torpor bouts lasting consecutive days to several weeks in animals that usually do not forage but rely on energy stores, either food caches or body energy reserves. This classification of torpor types has been challenged, suggesting that these phenotypes may merely represent extremes in a continuum of traits. Here, we investigate whether variables of torpor in 214 species (43 birds and 171 mammals) form a continuum or a bimodal distribution. We use Gaussian-mixture cluster analysis as well as phylogenetically informed regressions to quantitatively assess the distinction between hibernation and daily torpor and to evaluate the impact of body mass and geographical distribution of species on torpor traits. Cluster analysis clearly confirmed the classical distinction between daily torpor and hibernation. Overall, heterothermic endotherms tend to be small; hibernators are significantly heavier than daily heterotherms and also are distributed at higher average latitudes (∼35°) than daily heterotherms (∼25°). Variables of torpor for an average 30 g heterotherm differed significantly between daily heterotherms and hibernators. Average maximum torpor bout duration was >30-fold longer, and mean torpor bout duration >25-fold longer in hibernators. Mean minimum body temperature differed by ∼13°C, and the mean minimum torpor metabolic rate was ∼35% of the basal metabolic rate (BMR) in daily heterotherms but only 6% of BMR in hibernators. Consequently, our analysis strongly supports the view that hibernators and daily heterotherms are functionally distinct groups that probably have been subject to disruptive selection. Arguably, the primary physiological difference between daily torpor and hibernation, which leads to a variety of derived further distinct characteristics, is the temporal control of entry into and arousal from torpor, which is governed by the circadian clock in daily heterotherms, but apparently not in hibernators.

Keywords: daily torpor; endotherms; energy savings; heterothermy; hibernation; hypometabolism; hypothermia; over‐wintering; thermoregulation.


Figures

Fig. 1
Fig. 1
Phylogenetic tree of the bird species investigated. Different colours indicate the following families (from top to bottom): Nectariniidae, Hirundinidae, Artamidae, Pipridae, Columbidae, Podargidae, Aegothelidae, Strigidae, Trochilidae, Apodidae, Coliidae, Alcedinidae, Todidae. * The single hibernating species among birds was the Common Poorwill, Phalaenoptilus nuttallii.
Fig. 2
Fig. 2
Phylogenetic tree of the mammal species investigated. Species names in different colours indicate different orders. The coloured blocks next to species names indicate the use of hibernation (blue) or daily torpor (red), according to the traditional definition of heterothermy types.
Fig. 3
Fig. 3
Frequency distributions of maximum torpor bout duration (TBDmax), mean torpor bout duration (TBDmean), minimum Tb in torpor (Tb min), inter-bout euthermia duration (IBE), minimum MR in torpor (TMRmin), and metabolic reduction below BMR (TMRrel). Dark bars show species traditionally classified (TBDmax<24 h) as hibernators, light bars show daily heterotherms (TBDmax>24 h). Sample size varied for different variables (see Table 2). Data from mammals and birds were combined.
Fig. 4
Fig. 4
Results from a cluster analysis based on the traits TMRmin and Tb min indicating the existence of two clusters within heterotherms. Circles represent 95% confidence ellipses for the estimated cluster centres (indicated by asterisks). All species on left of the dashed line were classified as belonging to cluster 1, which was identical to our initial category “hibernators” except for three species (Elephantulus rozeti, Microcebus myoxinus, Petaurus breviceps). Species on the right of the dashed line assigned to cluster 2, which was identical to the traditonal category “daily heterotherms” except for 1 species (Ursus americanus). Overall there was a high degree of agreement (117 of 121 species) between this cluster analysis and classical categories. The inset graph shows the density surface computed from the parameters of the Gaussian mixture model.
Fig. 5
Fig. 5
A) Maximum torpor bout duration in relation to body mass. In mammalian daily heterotherms TBD slightly increased with body mass (log10duration=1.28+0.152 log10BM, t=2.56, P=0.013, R2=0.10). In mammalian hibernators maximum TBD was independent of body mass (P=0.968) and this was also the case for avian daily heterotherms (P=0.55). B) Maximum torpor bout duration in relation to absolute latitude of the species distribution centre. For mammalian daily heterotherms the regression was not significant (t=−0.49, P=0.621). Among mammalian hibernators maximum torpor bout duration increased with latitude (log10duration=1.985+0.0144 Latitude, t=5.05, P<0.0001, R2=0.12). There was no significant relationship in avian daily heterotherms (t=−0.73, P=0.471).
Fig. 6
Fig. 6
Mean torpor bout duration in relation to absolute latitude of the species distribution centre. There were no significant relationships in avian (t=0.73, P=0.487) or mammalian daily heterotherms (t=−1.49, P=0.140). Mean torpor bout duration increased with latitude in mammalian hibernators (log10duration=1.503+0.019 × Latitude, t=5.36, P<0.0001, R2=0.26).
Fig. 7
Fig. 7
Tb min as a function of body mass. Tb min increased with mass among mammalian daily heterotherms (Tb min=22.5+3.63 log10BM, t=3.56, P<0.001, R2=0.14) and avian daily heterotherms (Tb min = 21.8 + 5.53 log10BM, t=2.84, P=0.007,R2=0.26). Tb min also increased with body mass among mammalian hibernators (Tb min=9.6+3.72 log10BM, t=3.98, P<0.001, R2=0.20). After removing data from hibernators with Tb min >20°C (n=4) the regression equation was Tb min= 7.5+1.98 log10BM, t=2.18, P=0.032, R2=0.02 (dotted line).
Fig. 8
Fig. 8
A) Basal and minimum metabolic rate as a function of body mass. Regression equations for mass specific BMR were log10BMR= −0.444 – 0.308 log10BM (t= −13.9, P<0.0001,R2=0.73) among mammals and log10BMR= −0.415 – 0.412 log10BM (t= −4.33, P<0.001,R2=0.66) among birds. Minimum MR also decreased as body mass increased in mammalian daily heterotherms (log10MR= −0.917-0.192 log10BM, t=−2.30, P=0.025, R2=0.19). In avian daily heterotherms the slope of this regression was not significantly different from zero (t=−1.17, P=0.25). Among hibernating mammals the decrease of minimum metabolic rate with body mass was not pronounced but statistically significant (log10MR= −1.579 – 0.116 log10BM, t= −4.41, P=0.0001, R2=0.13). B) The relationship between minimum torpor metabolic rate and maximum torpor bout duration. TBDmax decreased with increasing TMRmin among mammalian hibernators (log10TBDmax=1.22-0.862 log10MR, t=−4.56, P<0.0001, R2=0.20). A weaker relationship in the same direction was also detectable among mammalian daily heterotherms (log10TBDmax=0.76-0.475 log10MR, t=−3.92, P<0.001, R2=0.27), but not in avian daily heterotherms (t=−1.37, P=0.205).
Fig. 9
Fig. 9
Metabolic reduction (TMRrel) as a function of body mass. Slight increases of TMRrel among daily heterothems were non-significant (birds: t= 1.12, P=0.275; mammals: t=1.59, P=0.117). Among hibernating mammals there was a significant relationship between TMRrel and body mass (log10TMRrel=0.81+0.20 log10BM, t=5.40, P<0.0001, R2=0.42).
Fig. 10
Fig. 10
A) Duration of inter-bout euthermia as a function of body mass. There was no significant relationship to body mass in avian (t=−0.59, P=0.562) or mammalian (t=0.01, P=0.987) daily heterotherms, but the duration of euthermia episodes increased with body mass among mammalian hibernators (log10IBE=1.22+0.255 log10BM, t=4.59, P<0.0001, R2=0.66). B) The relationship between basal metabolic rate (BMR) and the duration of interbout euthermia in mammalian hibernators (IBE=8.92-15.39 log10BMR, t=−3.80, P<0.001, R2=0.50). There was no such relationship in daily heterotherms (data not shown for clarity).
Fig. 11
Fig. 11
Basal and hibernation metabolic rates among mammals intersect at a body mass close to that of the largest animal known to have ever existed, the blue whale. Body mass of endotherms may in fact reach an upper limit due to excess heat production if BMR cannot be reduced below minimum MR as reached during hibernation.

References

    1. Anderson MD. Aardwolf adaptations: a review. Transactions of the Royal Society of South Africa. 2004;59:99–104. DOI: 10.1080/00359190409519168.
    1. Arlettaz R, Ruchet C, Aeschimann J, Brun E, Genoud M, Vogel P. Physiological traits affecting the distribution and wintering strategy of the bat Tadarida teniotis. Ecology. 2000;81:1004–1014. DOI: 10.1890/0012-9658(2000)081[1004:PTATDA]2.0.CO;2.
    1. Armitage KB, Woods BC, Salsbury CM. In: Heldmaier G, Klingenspor M, editors. Energetics of hibernation in woodchucks (Marmota monax); Life in the Cold. 11th International Hibernation Symposium; Springer, Berlin Heidelberg New York. 2000.pp. 73–80.
    1. Arnold JM. Dasyurus geoffroii. University of Western Australia; 1976. Growth and bioenergetics of the Chuditch.
    1. Arnold W. Energetics of social hibernation. In: Carey C, Florant GL, Wunder BA, Horwitz B, editors. Life in the Cold: Ecological, Physiological, and Molecular Mechanisms. Westview Press; Boulder: 1993. pp. 65–80.

LinkOut - more resources