. 2015 Jan;84(1):21-34.
doi: 10.1111/1365-2656.12282. Epub 2014 Oct 3.

Long-term phenological trends, species accumulation rates, aphid traits and climate: five decades of change in migrating aphids

Affiliations
Free PMC article

Long-term phenological trends, species accumulation rates, aphid traits and climate: five decades of change in migrating aphids

James R Bell et al. J Anim Ecol. 2015 Jan.
Free PMC article

Abstract

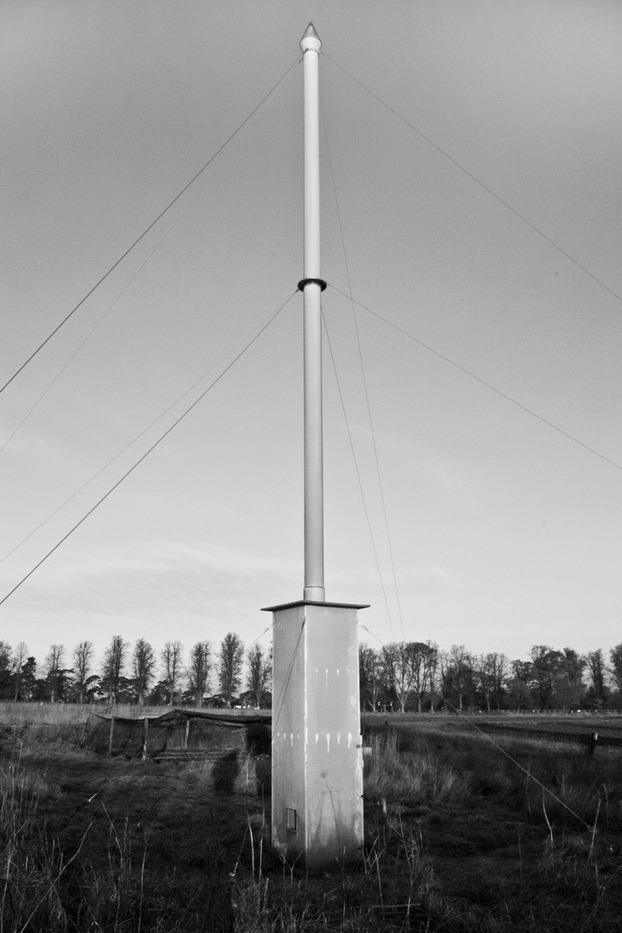
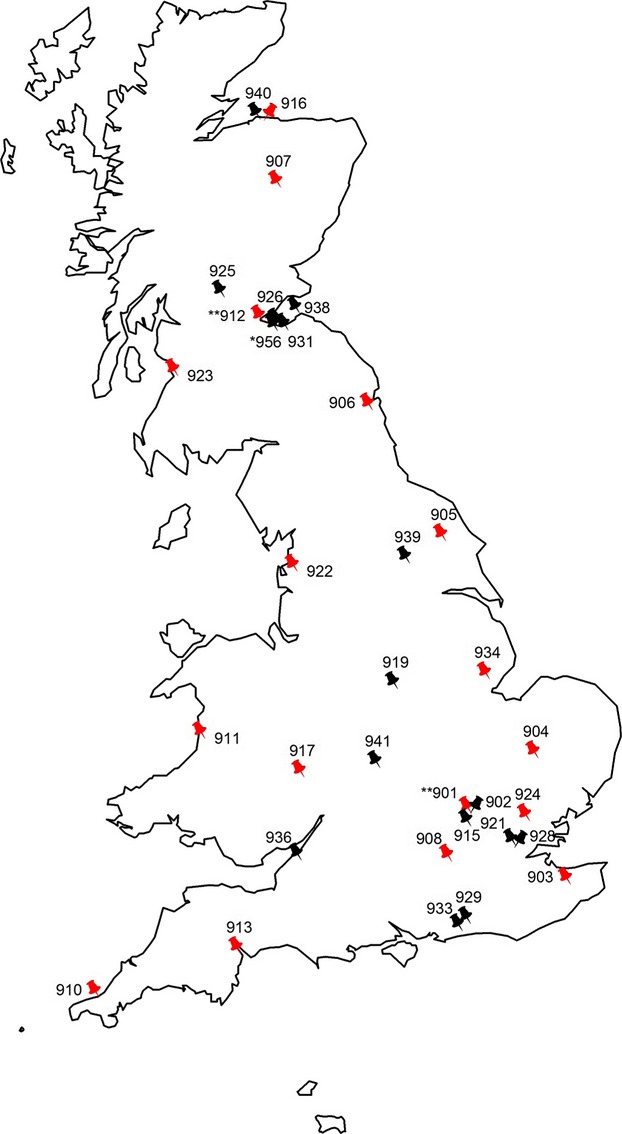
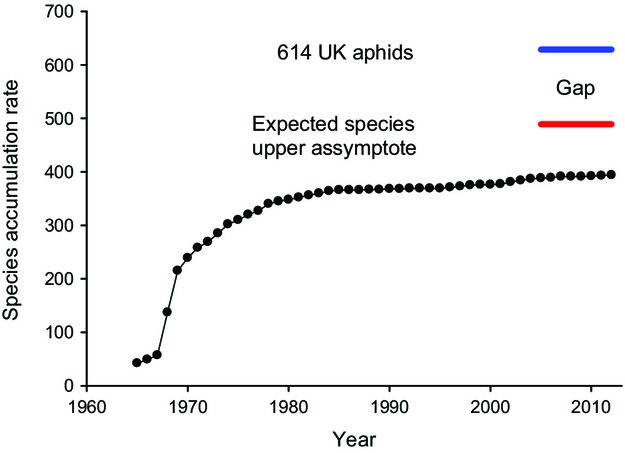
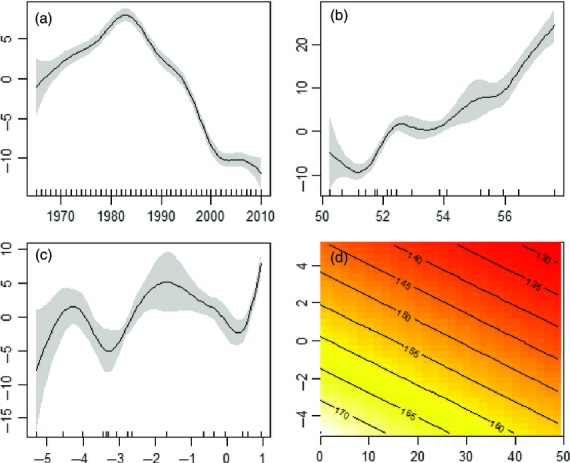
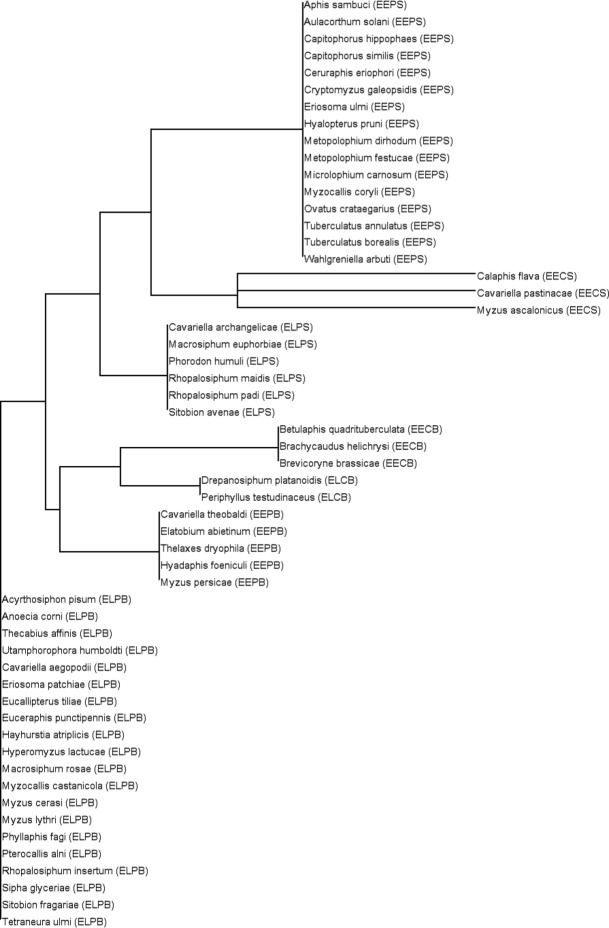
Aphids represent a significant challenge to food production. The Rothamsted Insect Survey (RIS) runs a network of 12·2-m suction-traps throughout the year to collect migrating aphids. In 2014, the RIS celebrated its 50th anniversary. This paper marks that achievement with an extensive spatiotemporal analysis and the provision of the first British annotated checklist of aphids since 1964. Our main aim was to elucidate mechanisms that advance aphid phenology under climate change and explain these using life-history traits. We then highlight emerging pests using accumulation patterns. Linear and nonlinear mixed-effect models estimated the average rate of change per annum and effects of climate on annual counts, first and last flights and length of flight season since 1965. Two climate drivers were used: the accumulated day degrees above 16 °C (ADD16) indicated the potential for migration during the aphid season; the North Atlantic Oscillation (NAO) signalled the severity of the winter before migration took place. All 55 species studied had earlier first flight trends at rate of β = -0·611 ± SE 0·015 days year(-1). Of these species, 49% had earlier last flights, but the average species effect appeared relatively stationary (β = -0·010 ± SE 0·022 days year(-1)). Most species (85%) showed increasing duration of their flight season (β = 0·336 ± SE 0·026 days year(-1)), even though only 54% increased their log annual count (β = 0·002 ± SE <0·001 year(-1)). The ADD16 and NAO were shown to drive patterns in aphid phenology in a spatiotemporal context. Early in the year when the first aphids were migrating, the effect of the winter NAO was highly significant. Further into the year, ADD16 was a strong predictor. Latitude had a near linear effect on first flights, whereas longitude produced a generally less-clear effect on all responses. Aphids that are anholocyclic (permanently parthenogenetic) or are monoecious (non-host-alternating) were advancing their phenology faster than those that were not. Climate drives phenology and traits help explain how this takes place biologically. Phenology and trait ecology are critical to understanding the threat posed by emerging pests such as Myzus persicae nicotianae and Aphis fabae cirsiiacanthoidis, as revealed by the species accumulation analysis.

Keywords: British aphid species checklist; gamm4; linear mixed‐effects model; species discovery curves; suction‐trap.


Figures

Fig. 1
Fig. 1
A suction-trap that samples migrating insects at a height of 12·2 m. The vertical 9·2-m pipe has an internal diameter of 244 mm. The 3-m housing at the base of the trap contains a motor and an electric fan from which a sample volume of 0·75 m3 air per second is generated. Aphids and other insects flying over the trap are pulled down through the vertical pipe into a collecting bottle inside the housing.
Fig. 2
Fig. 2
The location of the 37 UK 12·2 m suction-traps. The pin number refers to the Rothamsted Insect Survey (RIS) trap number that can be found in Appendix S1. As described in the methods, 37 traps were used for the species accumulation analysis that included all traps pictured. A trap number with * or ** indicate that there were one (*) or two (**) suction-trap(s) in close proximity in addition to the one that has been identified with a trap number (see Appendix S1). For the phenological rates of change models, a subset of traps highlighted in red were used which comprised: Aberystwyth 911, Ayr 923, Broom's Barn 904, Dundee 907, East Craigs 912, Elgin I 916, Hereford 917, High Mowthorpe 905, Kirton I 934, Newcastle 906, Preston 922, Rosewarne 910, Rothamsted Tower 901, Silwood Park 908, Starcross 913, Writtle 924 and Wye 903.
Fig. 3
Fig. 3
Species accumulation rate that shows the cumulative rate of new species recorded in the network per annum. The discovery gap between observed (dotted line) and the expected species discovery upper asymptote would require accumulating 89 more species to the 394 species recorded to date. Between the expected species discovery upper asymptote and the UK list that comprises 614 species (Appendix S2), there are 140 species that are unlikely to be sampled by the suction-traps either because they do not produce alates (winged adults) or they require host plant information to identify individuals.
Fig. 4
Fig. 4
The first flight ‘gam’ component of the generalized additive mixed model that shows the smoothers related to year (a: effective degrees of freedom (edf) = 7·89), latitude (b: edf = 6·87), longitude (c: edf = 7·42) and the linear component relating the fixed effects of accumulated day degrees above 16 °C for the combined months of April and May and the North Atlantic Oscillation during winter (d). In plots a–c, the graphics show the estimated smoother effects with 95% confidence intervals. In these plots, the y-axis is the spatial smooth term according to the edf. The x-axis has two components; the major tick marks indicate numerical values and above those are rug plots that show the values of the covariates for each smooth. For year, the rug plots are regularly spaced but for latitude and longitude they are irregular.
Fig. 5
Fig. 5
The species responses dendrogram based on a neighbourhood-joining algorithm with Jaccard similarities. The original matrix included 4 columns and 55 rows. The four responses (first flight, last flight, duration of flight season, log annual count) were columns, and the 55 rows were the species. The matrix was populated with the year coefficient from the linear mixed-effects models for each species. The neighbourhood-joining algorithm then produced the above dendrogram from the coefficients that displayed each species as a node. In parentheses along with the species, name is a categorical description of the trends for each response annotated as a four letter code [e.g. Phorodon humuli (ELPS)]. Each character is related to a response in the following order with the character underlined that indicates the direction in the trend: first flight [Earlier or Later]; last flight [Earlier or Later]; duration of flight season [Contracted or Protracted]; log annual count [Smaller or Bigger]. Thus, P. humuli (ELPS) has an earlier first flight, later last flight, a protracted flight season and a smaller log annual count trend. A complementary analysis using Euclidean distances to detect outliers is presented in Appendix S5.

Comment in

References

    1. Altermatt F. Temperature-related shifts in butterfly phenology depend on the habitat. Global Change Biology. 2012;18:2429–2438.
    1. Bebber DP, Marriott FHC, Gaston KJ, Harris SA. Scotland RW. Predicting unknown species numbers using discovery curves. Proceedings of the Royal Society B: Biological Sciences. 2007;274:1651–1658. - PMC - PubMed
    1. Bebber DP, Carine MA, Davidse G, Harris DJ, Haston EM, Penn MG, et al. Big hitting collectors make massive and disproportionate contribution to the discovery of plant species. Proceedings of the Royal Society B: Biological Sciences. 2012;279:2269–2274. - PMC - PubMed
    1. Bell JR, Taylor MS, Shortall CR, Welham SJ. Harrington R. The trait ecology and host plants of aphids and their distribution and abundance over the United Kingdom. Global Ecology and Biogeography. 2012;21:405–415.
    1. Bell JR, Harrington R, Taylor MS. Verrier P. Population metrics for migrating aphids. NJF Report. 2013;9:39–40.

LinkOut - more resources