. 2014 Oct 15;550(1):93-100.
doi: 10.1016/j.gene.2014.08.021. Epub 2014 Aug 11.

Alternative polyadenylation regulates CELF1/CUGBP1 target transcripts following T cell activation

Affiliations

Alternative polyadenylation regulates CELF1/CUGBP1 target transcripts following T cell activation

Daniel Beisang et al. Gene. .

Abstract

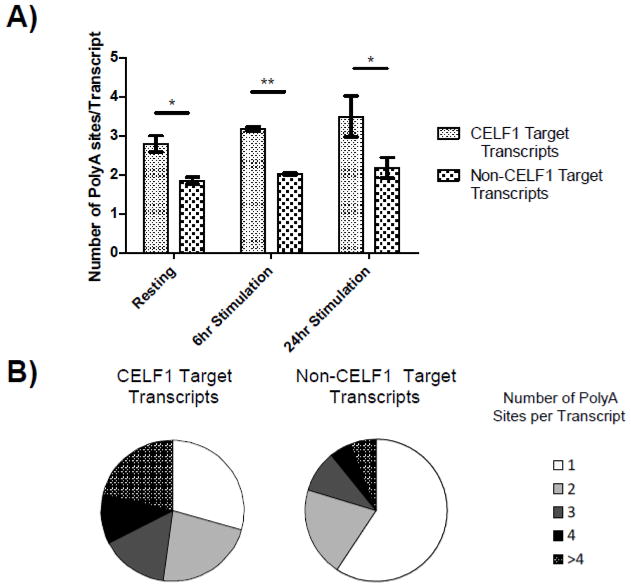
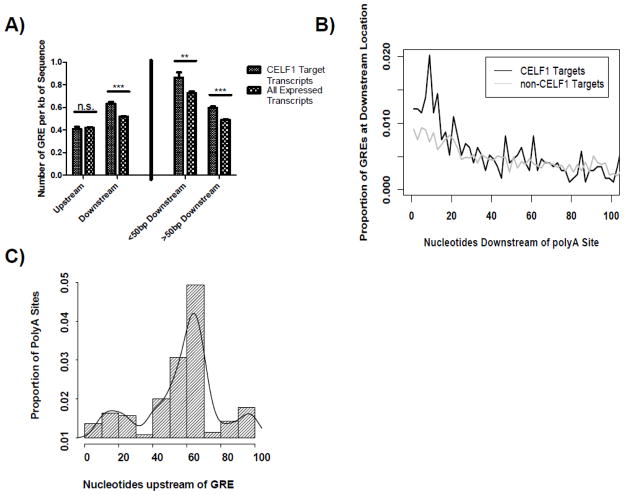
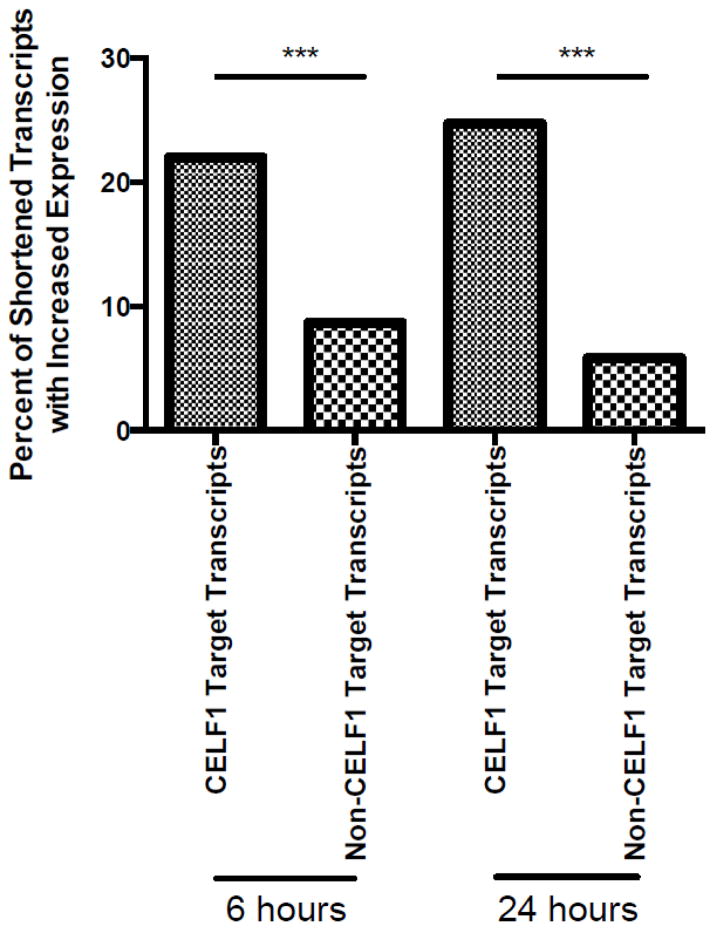
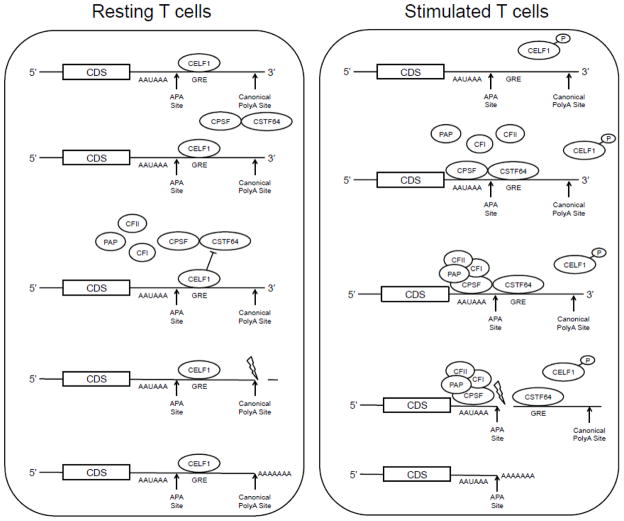
Alternative polyadenylation (APA) is an evolutionarily conserved mechanism for regulating gene expression. Transcript 3' end shortening through changes in polyadenylation site usage occurs following T cell activation, but the consequences of APA on gene expression are poorly understood. We previously showed that GU-rich elements (GREs) found in the 3' untranslated regions of select transcripts mediate rapid mRNA decay by recruiting the protein CELF1/CUGBP1. Using a global RNA sequencing approach, we found that a network of CELF1 target transcripts involved in cell division underwent preferential 3' end shortening via APA following T cell activation, resulting in decreased inclusion of CELF1 binding sites and increased transcript expression. We present a model whereby CELF1 regulates APA site selection following T cell activation through reversible binding to nearby GRE sequences. These findings provide insight into the role of APA in controlling cellular proliferation during biological processes such as development, oncogenesis and T cell activation.

Keywords: Alternative polyadenylation; CELF1; CUGBP1; Cell division; GRE; T cell stimulation; mRNA decay.


Figures

Fig. 1
Fig. 1
CELF1 target transcripts are enriched for polyA sites. A) The average number of experimentally identified polyA sites per transcript was determined for expressed non-CELF1 target transcripts or CELF1 target transcripts in resting T cells and T cells that were stimulated for six or 24 hours. (*= p-value <0.05, ** = p-value <0.01). B) The number of polyA sites per transcript was determined for CELF1 target transcripts and all expressed non-CELF1 target transcripts in resting T cells.
Fig. 2
Fig. 2
GREs are enriched downstream of polyA sites. A) We created a master list of all unique polyA sites from all donors and time points. Using this list we separated 3′UTR sequences into the region from termination codon to the first detected polyA site (upstream) and the region from each polyA site to the subsequent polyA site (downstream). We then determined the number of GREs per kilobase of sequence within these two regions for CELF1 target transcripts and all expressed non-CELF1 target transcripts. We then segregated the downstream regions into sequences less than 50bp or greater than 50bp downstream of detected polyA sites (<50 Downstream and >50 Downstream, respectively). We then calculated the number of GREs per kilobase of sequence within these two regions for CELF1 target transcripts and all expressed non-CELF1 target transcripts (n.s. = not significant, *** = p-value <0.001). B) We determined the distribution of GREs within the first 100nt downstream of polyA sites for CELF1 target transcripts and non-CELF1 targets. C) The 100bp of sequence upstream of each GRE was extracted, and these regions were examined for polyA signals of the sequence A[A/U]UAAA. A histogram of locations of polyA signals is shown. The x-axis represents the number of nucleotides upstream of the GRE where polyA signals were found, and the y-axis represents the proportion of detected polyA signals located at each position.
Fig.3
Fig.3
CELF1 target transcripts that shorten through APA increase their expression. The percentage of APA shortened CELF1 target transcripts and non-CELF1 target transcripts that statistically significantly increased their expression at six or 24 hours was determined (*** = p-value < 10−8).
Fig. 4
Fig. 4
CELF1 target transcripts that shortened following T cell activation encode regulators of cell division. Transcripts depicted in gray are CELF1 target transcripts that were shortened at six and 24 hours after T cell activation that regulate cellular proliferation through T cell receptor and co-receptor signaling pathways.
Fig. 5
Fig. 5
Potential role of mechanism of CELF1in regulating APA. In resting T cells, CELF1 binds to the GRE located downstream of 5′ APA sites and may competitively inhibit the binding of CSTF64-CSPF heterodimer to the GRE, preventing utilization of the 5′ APA site. In activated T cells, CELF1 is phosphorylated resulting in decreased RNA-binding activity. CELF1’s reduced binding to the GRE may allow the CSTF64-CSPF heterodimer access to bind the pre-mRNA molecule and recruit the remaining APA machinery to increase utilization of the 5′APA site.

References

    1. Raghavan A, Dhalla M, Bakheet T, Ogilvie RL, Vlasova IA, Khabar KSA, et al. Patterns of coordinate down-regulation of ARE-containing transcripts following immune cell activation. Genomics. 2004;84:1002–1013. - PubMed
    1. Cheadle C, Fan J, Cho-Chung Y, Werner T, Ray J, Do L, et al. Control of gene expression during T cell activation: alternate regulation of mRNA transcription and mRNA stability. BMC Genomics. 2005;6:75. - PMC - PubMed
    1. Martinez NM, Pan Q, Cole BS, Yarosh CA, Babcock GA, Heyd F, et al. Alternative splicing networks regulated by signaling in human T cells. Rna. 2012;18:1029–1040. - PMC - PubMed
    1. Sandberg R, Neilson JR, Sarma A, Sharp PA, Burge CB. Proliferating Cells Express mRNAs with Shortened 3′ Untranslated Regions and Fewer MicroRNA Target Sites. Science. 2008;320:1643–1647. - PMC - PubMed
    1. Ozsolak F, Kapranov P, Foissac S, Kim SW, Fishilevich E, Monaghan AP, et al. Comprehensive Polyadenylation Site Maps in Yeast and Human Reveal Pervasive Alternative Polyadenylation. Cell. 2010;143:1018–1029. - PMC - PubMed

Publication types