. 2014 Nov 7;289(45):30925-36.
doi: 10.1074/jbc.M114.553230. Epub 2014 Aug 14.

Control of Toll-like receptor-mediated T cell-independent type 1 antibody responses by the inducible nuclear protein IκB-ζ

Affiliations

Control of Toll-like receptor-mediated T cell-independent type 1 antibody responses by the inducible nuclear protein IκB-ζ

Fumito Hanihara-Tatsuzawa et al. J Biol Chem. .

Abstract

Antibody responses have been classified as being either T cell-dependent or T cell-independent (TI). TI antibody responses are further classified as being either type 1 (TI-1) or type 2 (TI-2), depending on their requirement for B cell-mediated antigen receptor signaling. Although the mechanistic basis of antibody responses has been studied extensively, it remains unclear whether different antibody responses share similarities in their transcriptional regulation. Here, we show that mice deficient in IκB-ζ, specifically in their B cells, have impaired TI-1 antibody responses but normal T cell-dependent and TI-2 antibody responses. The absence of IκB-ζ in B cells also impaired proliferation triggered by Toll-like receptor (TLR) activation, plasma cell differentiation, and class switch recombination (CSR). Mechanistically, IκB-ζ-deficient B cells could not induce TLR-mediated induction of activation-induced cytidine deaminase (AID), a class-switch DNA recombinase. Retroviral transduction of AID in IκB-ζ-deficient B cells restored CSR activity. Furthermore, acetylation of histone H3 in the vicinity of the transcription start site of the gene that encodes AID was reduced in IκB-ζ-deficient B cells relative to IκB-ζ-expressing B cells. These results indicate that IκB-ζ regulates TLR-mediated CSR by inducing AID. Moreover, IκB-ζ defines differences in the transcriptional regulation of different antibody responses.

Keywords: Activation-induced Cytidine Deaminase (AID); B Cell; Cell Differentiation; Cellular Immune Response; Immunology; IκB-z; Toll-like Receptor (TLR); Transcription Factor.


Figures

FIGURE 1.
FIGURE 1.
Mice deficient in IκB-ζ specifically in their B cells exhibit impaired T-independent type 1 immune responses. A, relative levels of expression of Nfkbiz mRNA in splenic T cells, B cells, dendritic cells, and macrophage from control and cKO mice. The Nfkbiz/Gapdh ratio in control cells was arbitrarily set as “1.” Data shown are the mean ± S.D. of a duplicate sample. B, immunoglobulin titers in sera of control and cKO mice (n = 6 pairs of mice; each symbol represents an individual mouse). C–E, titers of TNP-specific IgM, IgG1, or IgG3 in sera of control or cKO mice (n = 4) immunized with TNP-KLH in alum (C), TNP-Ficoll (D), or TNP-LPS (E). Horizontal bars show the mean value. Data shown are representative of two independent experiments. **, p < 0.01.
FIGURE 2.
FIGURE 2.
IκB-ζ is dispensable for B cell maturation. Flow cytometric analysis of splenocytes (A–C) or cells from the peritoneal cavity (D) isolated from control or cKO mice. The cells were stained with anti-B220 and anti-AA4.1 antibodies (A), anti-B220, anti-IgM, and anti-IgD antibodies (B), anti-B220, anti-CD23, and anti-CD21 antibodies (C), or anti-B220 and anti-CD5 antibodies (D) before analysis by flow cytometry. Dot plots were gated on B220+ cells (B–D). Data shown are representative of four independent experiments.
FIGURE 3.
FIGURE 3.
LPS, but not CD40, induces IκB-ζ expression in B cells. A, immunoblot analysis of IκB-ζ and β-actin in splenic B cells. Purified splenic B cells were stimulated either with 20 μg/ml LPS plus 5 ng/ml IL-4 or with 1 μg/ml anti-CD40 plus 5 ng/ml IL-4 for the time periods indicated. B, post-transcriptional activation of IκB-ζ in B cells. CH12F3-2A cells were transfected with pGL4.12-SV40-[luc2CP] (None) or pGL4.12-SV40-[luc2CP]-Nfkbiz-3′-UTR (3′-UTR) together with phRL-TK-Luc. The cells were stimulated either with 20 μg/ml LPS plus 5 ng/ml IL-4 or with 1 μg/ml anti-CD40 plus 5 ng/ml IL-4 for 4 h before measuring the luciferase activity. Data represent the mean ± S.E. of triplicate samples and are representative of three independent experiments. **, p < 0.01.
FIGURE 4.
FIGURE 4.
IκB-ζ is required for Ig secretion and proliferation in response to TLR ligands but not in response to anti-CD40. A, Ig secretion from control or cKO B cells. Purified splenic B cells were stimulated with 20 μg/ml LPS (to determine IgM, IgG2b, and IgG3 levels), 20 μg/ml LPS plus 5 ng/ml IL-4 (to determine IgG1 levels), or 20 μg/ml LPS plus 5 ng/ml IL-4 and 1 ng/ml TGF-β (to determine IgA levels) for 7 days. Concentrations of the indicated Ig in the culture supernatant were measured by ELISA (n = 4). Horizontal bars show the mean value. N.D., not detected. Data are representative of three independent experiments. B, proliferation of control and cKO B cells. Purified splenic B cells were labeled with CFSE and stimulated with 10 μg/ml of the F(ab′)2 fragment of anti-mouse IgM (α-IgM), 20 μg/ml LPS, 300 nm CpG-ODN, or 1 μg/ml anti-CD40 for 72 h. Cell division was analyzed by flow cytometry. Numbers in histograms indicate frequencies of proliferating cells. Data are representative of three independent experiments. *, p < 0.05; **, p < 0.01.
FIGURE 5.
FIGURE 5.
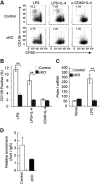
IκB-ζ-deficient B cells exhibit impaired plasma cell differentiation in response to LPS. A and B, plasma cell differentiation of splenic B cells from control or cKO mice. Purified splenic B cells were labeled with CFSE and stimulated for 3 days with 20 μg/ml LPS, 20 μg/ml LPS plus 5 ng/ml IL-4, or 1 μg/ml anti-CD40 (α-CD40) plus 5 ng/ml IL-4. The cells were stained with anti-CD138 antibody and analyzed by flow cytometry. Numbers in dot plots indicate the frequencies of CD138+ cells in the boxed area. Data shown are representative of three independent experiments (A). Relative abundances are shown of CD138+ cells after exposure to LPS, LPS plus IL-4, or anti-CD40 plus IL-4. Data represent the mean ± S.E. of three independent experiments (B). C, expression of Prdm1 mRNA in splenic B cells from control or cKO mice. Purified splenic B cells were stimulated with 20 μg/ml LPS for 72 h. Total RNA was extracted, and Blimp-1 and Cd79b mRNAs were quantified by real time RT-PCR. Copy numbers of Blimp-1 mRNA per 1000 copies of Cd79b mRNA are shown. Data represent the mean ± S.E. of triplicate samples and are representative of three independent experiments. D, histone acetylation of the Blimp-1 promoter region in splenic B cells from control or cKO mice. Purified splenic B cells were stimulated with 20 μg/ml LPS plus 5 ng/ml IL-4 for 3 days. Histone acetylation (AcH) enrichment was analyzed by a chromatin immunoprecipitation assay performed using antibody against acetyl-histone H3 (Lys-27). Data represent the mean ± S.E. of triplicate samples and are representative of two independent experiments. **, p < 0.01.
FIGURE 6.
FIGURE 6.
IκB-ζ-deficient B cells exhibit impaired IgG1 CSR in response to TLR ligands. A and B, rates of CSR in splenic B cells from control and cKO mice. Purified splenic B cells were labeled with CFSE and stimulated either with 20 μg/ml LPS plus 5 ng/ml IL-4 or with 1 μg/ml anti-CD40 plus 5 ng/ml IL-4. The cells were stained with anti-IgG1 antibody and analyzed by flow cytometry. Numbers in the dot plots indicate the numbers of IgG1+ cells in the boxed area. Data are representative of four independent experiments (A). Frequencies of IgG1+ cells in each cell division are shown (B). C, IgG3 CSR of splenic B cells from control or cKO mice. Purified splenic B cells were labeled with CFSE and stimulated with 20 μg/ml LPS for 3 days. The cells were stained with anti-IgG3 antibody and analyzed by flow cytometry. D, frequencies of IgG3+ cells in response to LPS. Data shown are the mean ± S.E. of triplicate samples and are representative of three independent experiments. E, expression of germ line transcripts and post-recombination transcripts in control or cKO splenic B cells. Purified splenic B cells were stimulated for 3 days with 20 μg/ml LPS plus 5 ng/ml IL-4. Total RNA was extracted, and the germ line Iγ1-Cγ1 transcripts and the post-recombination Iμ-Cγ1 transcripts were quantified by real time RT-PCR. Expression levels of the germ line transcripts and post-recombination Iμ-Cγ1 transcripts (PST) were normalized relative to Cd79b expression. F, purified splenic B cells were labeled with CFSE and stimulated either with 100 ng/ml Pam3CSK4 plus 5 ng/ml IL-4 or with 1 μm CpG-DNA plus 5 ng/ml IL-4 in the presence or absence of anti-IgD-dextran for 3 days. Numbers in dot plots indicate the IgG1+ cells in the boxed area. Data represent the mean ± S.E. of triplicate samples and are representative of three independent experiments. **, p < 0.01.
FIGURE 7.
FIGURE 7.
IκB-ζ promotes CSR through AID induction in response to LPS. A and B, levels of Aicda mRNA in splenic B cells from control and cKO mice. Purified splenic B cells were stimulated with 20 ng/ml LPS plus 5 μg/ml IL-4 (A) or 1 μg/ml anti-CD40 plus 5 ng/ml IL-4 (B) for the time periods indicated. Total RNA was extracted, and Aicda and Cd79b mRNAs were quantified by real time RT-PCR. Copy numbers of Aicda mRNA per 1,000 copies of Cd79b mRNA are shown. Data shown are the mean ± S.E. of triplicate samples and are representative of three independent experiments. C, copy numbers of Aicda mRNA per 1,000 copies of Cd79b mRNA. Data shown are the mean ± S.E. of triplicate samples and are representative of three independent experiments. D, rescue of CSR in splenic B cells from cKO mice. Purified splenic B cells were stimulated with 50 ng/ml anti-IgD-dex for 24 h and retrovirally transduced with pMY-IRES-GFP (mock), pMY-BATF-IRES-GFP (BATF), or pMY-AID-IRES-GFP (AID). The cells were then cultured for 3 days in the presence of 20 μg/ml LPS plus 5 ng/ml IL-4. The cells were stained with anti-IgG1 antibody and analyzed by flow cytometry. Contour plots were gated on GFP+ cells. Numbers in the contour plots indicate the frequencies of IgG1+ cells in the boxed areas. Data are representative of three independent experiments. E and F, reporter analysis of Aicda promoter in HEK293 cells (E) or CH12F3-2A cells (F). Cells were transfected with the indicated reporter plasmid harboring the indicated Aicda conserved genomic region with or without the IκB-ζ expression plasmid. Data shown are the mean ± S.E. of triplicate samples and are representative of three independent experiments. G, HEK293 cells were transfected with a reporter plasmid harboring the genomic region 1 with conserved Aicda, with or without IκB-ζ or the plasmid expressing NF-κB subunit p65. The data shown are the mean ± S.D. of duplicate samples and are representative of two independent experiments. H, histone acetylation of the AID promoter/enhancer/silencer region in splenic B cells from control or cKO mice. Purified splenic B cells were stimulated with 20 μg/ml LPS plus 5 ng/ml IL-4 for 3 days. Histone acetylation was analyzed by a chromatin immunoprecipitation assay performed using antibody against acetyl-histone H3 (Lys-27). Data represent the mean ± S.E. of triplicate samples and are representative of three independent experiments. *, p < 0.05; **, p < 0.01.

Similar articles

Cited by

References

    1. Pone E. J., Zan H., Zhang J., Al-Qahtani A., Xu Z., Casali P. (2010) Toll-like receptors and B cell receptors synergize to induce immunoglobulin class-switch DNA recombination: relevance to microbial antibody responses. Crit. Rev. Immunol. 30, 1–29 - PMC - PubMed
    1. Foy T. M., Shepherd D. M., Durie F. H., Aruffo A., Ledbetter J. A., Noelle R. J. (1993) In vivo CD40-gp39 interactions are essential for thymus-dependent humoral immunity. II. Prolonged suppression of the humoral immune response by an antibody to the ligand for CD40, gp39. J. Exp. Med. 178, 1567–1575 - PMC - PubMed
    1. Van den Eertwegh A. J., Noelle R. J., Roy M., Shepherd D. M., Aruffo A., Ledbetter J. A., Boersma W. J., Claassen E. (1993) In vivo CD40-gp39 interactions are essential for thymus-dependent humoral immunity. I. In vivo expression of CD40 ligand, cytokines, and antibody production delineates sites of cognate T-B cell interactions. J. Exp. Med. 178, 1555–1565 - PMC - PubMed
    1. Mosier D. E., Mond J. J., Goldings E. A. (1977) The ontogeny of thymic independent antibody responses in vitro in normal mice and mice with an X-linked B cell defect. J. Immunol. 119, 1874–1878 - PubMed
    1. Mond J. J., Lees A., Snapper C. M. (1995) T cell-independent antigens type 2. Annu. Rev. Immunol. 13, 655–692 - PubMed

Publication types

MeSH terms