. 2014 Oct;166(2):920-33.
doi: 10.1104/pp.114.243931. Epub 2014 Aug 14.

Tomato fruit chromoplasts behave as respiratory bioenergetic organelles during ripening

Affiliations

Tomato fruit chromoplasts behave as respiratory bioenergetic organelles during ripening

Marta Renato et al. Plant Physiol. 2014 Oct.

Abstract

During tomato (Solanum lycopersicum) fruit ripening, chloroplasts differentiate into photosynthetically inactive chromoplasts. It was recently reported that tomato chromoplasts can synthesize ATP through a respiratory process called chromorespiration. Here we show that chromoplast oxygen consumption is stimulated by the electron donors NADH and NADPH and is sensitive to octyl gallate (Ogal), a plastidial terminal oxidase inhibitor. The ATP synthesis rate of isolated chromoplasts was dependent on the supply of NAD(P)H and was fully inhibited by Ogal. It was also inhibited by the proton uncoupler carbonylcyanide m-chlorophenylhydrazone, suggesting the involvement of a chemiosmotic gradient. In addition, ATP synthesis was sensitive to 2,5-dibromo-3-methyl-6-isopropyl-p-benzoquinone, a cytochrome b6f complex inhibitor. The possible participation of this complex in chromorespiration was supported by the detection of one of its components (cytochrome f) in chromoplasts using immunoblot and immunocytochemical techniques. The observed increased expression of cytochrome c6 during ripening suggests that it could act as electron acceptor of the cytochrome b6f complex in chromorespiration. The effects of Ogal on respiration and ATP levels were also studied in tissue samples. Oxygen uptake of mature green fruit and leaf tissues was not affected by Ogal, but was inhibited increasingly in fruit pericarp throughout ripening (up to 26% in red fruit). Similarly, Ogal caused a significant decrease in ATP content of red fruit pericarp. The number of energized mitochondria, as determined by confocal microscopy, strongly decreased in fruit tissue during ripening. Therefore, the contribution of chromoplasts to total fruit respiration appears to increase in late ripening stages.


Figures

Figure 1.
Figure 1.
Effect of NAD(P)H on oxygen uptake activity of isolated ‘Micro-Tom’ fruit chromoplasts. A, Effect of NADH on intact chromoplasts. B, Effect of NADPH on intact chromoplasts. C, Effect of both electron donors on sonicated chromoplasts. Rates are expressed as nmol O2 mg−1 protein min−1 and were calculated in the linear zone of the oxygen uptake traces. The addition of ADP, CCCP, Ogal, and their final concentrations in the measurement cuvette are indicated by arrows. The chromoplastic protein content in the electrode cuvette was 0.78 mg (A and B) and 0.50 mg (C). Replicates of these experiments are shown in Supplemental Figure S1.
Figure 2.
Figure 2.
Oxygen uptake rates of isolated ‘Micro-Tom’ fruit chromoplasts in the absence of substrates (basal respiration) and in the presence of 1 mm NADH (plus 1 mm NAD+) or 1 mm NADPH (plus 1 mm NADP+). Data are arithmetic means of n = 30 for basal respiration, n = 16 for NADH, and n = 14 for NADPH. Different letters indicate significant differences (Student’s t test, P < 0.05).
Figure 3.
Figure 3.
Effect of respiratory substrates and inhibitors on oxygen uptake activity of isolated ‘Micro-Tom’ chromoplasts. A, Sodium cyanide (NaCN) and sodium azide added after NADH. B, Malate and pyruvate. C, Succinate. Rates are expressed as nmol O2 mg−1 protein min−1 and were calculated in the linear zone of the oxygen uptake traces. The addition of other compounds and their final concentrations in the measurement cuvette are indicated by arrows. The chromoplastic protein content in the electrode cuvette was 0.74 mg (A), 0.78 mg (B), and 0.57 mg (C). Replicates of these experiments are shown in Supplemental Figure S3.
Figure 4.
Figure 4.
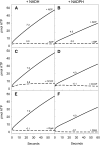
Effect of 0.1 mm ADP (A and B), 10 µm CCCP (C and D), and 250 µm Ogal (E and F) on ATP synthesis activity of isolated ‘Micro-Tom’ chromoplasts in the presence of NADH or NADPH. ADP was always added in experiments C to F. The reaction well contained 80 µL of buffer (“Materials and Methods”), 80 µL of luciferase/luciferin reagent, 20 µL of chromoplasts (from 0.08–0.14 mg of chromoplastic protein), and 20 µm DAPP. In experiments A, C, and E, 1 mm NADH (plus 1 mm NAD+) was added. In experiments B, D, and F, 1 mm NADPH (plus 1 mm NADP+) was added. Measurements started after the automatic injection of 0.1 mm ADP at time zero; when ADP was not added, water was injected instead (dashed lines in A and B). Rates on traces are expressed as pmol ATP mg−1 protein s−1 and were estimated from the slope between 5 and 30 s. The chromoplastic protein concentration in each well was 0.5 mg/ml. Means of three to four assays are shown in Supplemental Table S1.
Figure 5.
Figure 5.
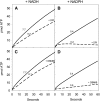
Effect of 50 µm DPI (A and B) and 100 µm DBMIB (C and D) on ATP synthesis activity of isolated ‘Micro-Tom’ chromoplasts in the presence of NADH or NADPH. The reaction well contained 80 µL of buffer (“Materials and Methods”), 80 µL of luciferase/luciferin reagent, 20 µL of chromoplasts (from 0.08–0.14 mg of chromoplastic protein), and 20 µm DAPP. In experiments A and C, 1 mm NADH (plus 1 mm NAD+) was added. In experiments B and D, 1 mm NADPH (plus 1 mm NADP+) was added. All of the measurements started after the automatic injection of 0.1 mm ADP at time zero. Rates on traces are expressed as pmol ATP mg−1 protein s−1 and were estimated from the slope between 5 and 30 s. The chromoplastic protein concentration in each well was 0.5 mg/ml. Means of three to four assays are shown in Supplemental Table S1.
Figure 6.
Figure 6.
Effect of 10 µm CCCP, 250 µm Ogal, and 100 µm DBMIB on ATP synthesis activity of isolated ‘Ailsa Craig’ chromoplasts in the presence of NADH or NADPH. The ATP synthesis activity in the absence of any electron donor is also shown. The reaction well contained 80 µL of buffer (“Materials and Methods”), 80 µL of luciferase/luciferin reagent, 20 µL of chromoplasts (from 0.13–0.22 mg of chromoplastic protein), 20 µm DAPP, 0.1 mm of ADP, and 1 mm of NADH (plus 1 mm NAD+) or 1 mm NADPH (plus 1 mm NADP+). Rates are expressed as pmol ATP mg−1 protein s−1 and were estimated from the slope between 5 and 30 s of the assays. Data are arithmetic means ± se (n = 3–4). Different letters indicate significant differences (Student’s t test, P < 0.01).
Figure 7.
Figure 7.
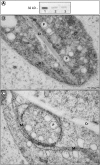
A, Immunoblot analysis of cytochrome f in tomato chromoplasts. Western blot of leaf extract of ‘Micro-Tom’ plants (1) and isolated chromoplast from ‘Micro-Tom’ fruits (2) and ‘Ailsa Craig’ fruits (3). A single band of approximately 32 kD was observed. Total protein per lane was 5 µg (1) and 20 µg (2 and 3). This experiment was repeated three times, and a representative immunoblot is shown. B and C, Immunocytochemical analysis of cytochrome f in ‘Ailsa Craig’ red fruit pericarp. The transmission electron micrographs show the ultrastructure of chromoplasts, and gold labeling indicates the presence of the cytochrome f protein. Cr, Carotenoid-containing crystalloid; M, chromoplastic internal membranous structures; P, plastoglobule. Bar = 200 nm in B; and 500 nm in C.
Figure 8.
Figure 8.
Relative quantification of cytochrome c6 (A) and PTOX (B) mRNA in different tomato tissues: small green fruit (S green), mature green fruit (M green), breaker fruit, orange fruit, red fruit, and leaf. Data are arithmetic means ± se of three technical replicates, and experiments were repeated three times (Supplemental Protocol S1). Dashed line indicates the calibrator value (small green fruit).
Figure 9.
Figure 9.
Effect of 1 mm Ogal on oxygen uptake of ‘Micro-Tom’ fruit pericarp at different ripening stages (mature green, breaker, orange, and red) and ‘Micro-Tom’ leaf. The effect of Ogal on oxygen uptake of ghost ripe fruit pericarp is also shown. Data are arithmetic means ± se (n = 6–8). Asterisks indicate significant differences from the control (pairwise Student’s t test, *P < 0.05 and **P < 0.01). MG, Mature green.
Figure 10.
Figure 10.
Effect of Ogal and CCCP on the ATP levels of ‘Micro-Tom’ fruit pericarp at mature green and red stages. Fragments of pericarp were incubated in darkness for 15 min with buffer (control), or buffer supplemented with 1 mm Ogal or 0.1 mm CCCP (“Materials and Methods”). Data are arithmetic means ± se of duplicate measurements (n = 11–12 different fruits). Asterisks indicate significant differences from the control (pairwise Student’s t test, *P < 0.05 and **P < 0.01).
Figure 11.
Figure 11.
Number of mitochondria stained by MitoTracker (energized mitochondria) per unit area of ‘Micro-Tom’ fruit pericarp at the mature green, orange, and red ripening stages (black bars). White bars represent the number of stained mitochondria in tissue samples previously incubated with the uncoupler CCCP. Data are arithmetic means ± se (n = 12 for control and n = 7 for CCCP). Different letters indicate significant differences (Student’s t test, P < 0.01). MG, Mature green.
Figure 12.
Figure 12.
Microscopy images of mature green (A and C) and red (B and D) ‘Micro-Tom’ fruit pericarp. A and B, Confocal fluorescence images of tissue stained with MitoTracker CM-H2TMRos (emission, 570–590 nm; in yellow) and overlaid chlorophyll fluorescence (emission, 650–700 nm; in red). C and D, Corresponding bright-field images of A and B. Energized mitochondria are labeled with white arrows. Bar = 10 µm.

References

    1. Almeida AM, Jarmuszkiewicz W, Khomsi H, Arruda P, Vercesi AE, Sluse FE. (1999) Cyanide-resistant, ATP-synthesis-sustained, and uncoupling-protein-sustained respiration during postharvest ripening of tomato fruit. Plant Physiol 119: 1323–1330 - PMC - PubMed
    1. Angaman DM, Petrizzo R, Hernández-Gras F, Romero-Segura C, Pateraki I, Busquets M, Boronat A. (2012) Precursor uptake assays and metabolic analyses in isolated tomato fruit chromoplasts. Plant Methods 8: 1–10 - PMC - PubMed
    1. Backhausen JE, Vetter S, Baalmann E, Kitzmann C, Scheibe R. (1998) NAD-dependent malate dehydrogenase and glyceraldehyde 3-phosphate dehydrogenase isoenzymes play an important role in dark metabolism of various plastid types. Planta 205: 359–366
    1. Barr J, White WS, Chen L, Bae H, Rodermel S. (2004) The GHOST terminal oxidase regulates developmental programming in tomato fruit. Plant Cell Environ 27: 840–852
    1. Barsan C, Sanchez-Bel P, Rombaldi C, Egea I, Rossignol M, Kuntz M, Zouine M, Latché A, Bouzayen M, Pech JC. (2010) Characteristics of the tomato chromoplast revealed by proteomic analysis. J Exp Bot 61: 2413–2431 - PubMed

Publication types

MeSH terms

LinkOut - more resources