

A comprehensive assessment of resting state networks: bidirectional modification of functional integrity in cerebro-cerebellar networks in dementia
- PMID: 25126054
- PMCID: PMC4115623
- DOI: 10.3389/fnins.2014.00223
A comprehensive assessment of resting state networks: bidirectional modification of functional integrity in cerebro-cerebellar networks in dementia
Abstract
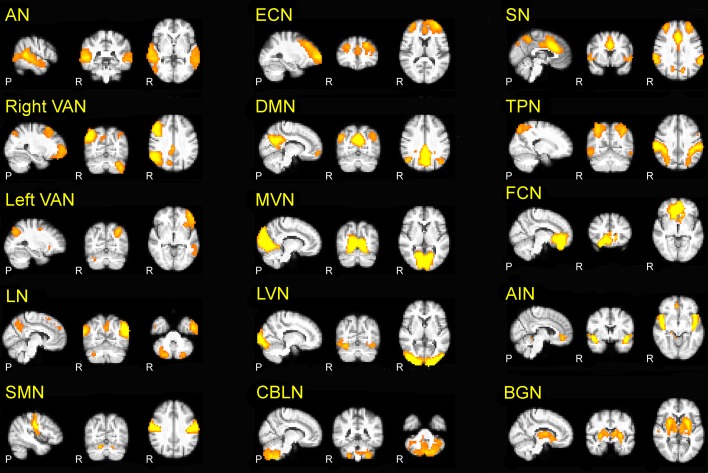
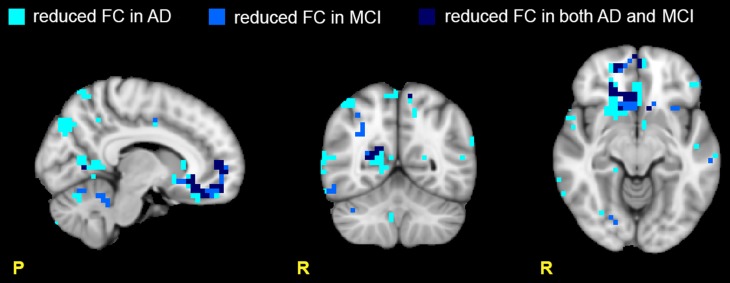
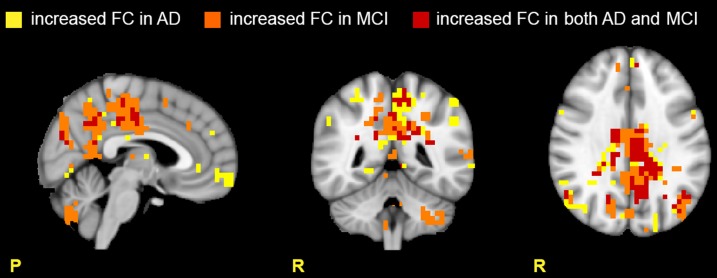
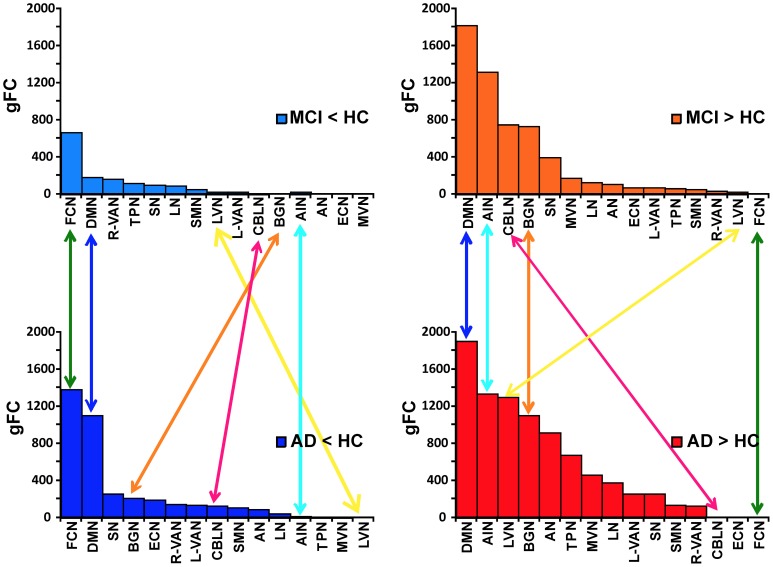
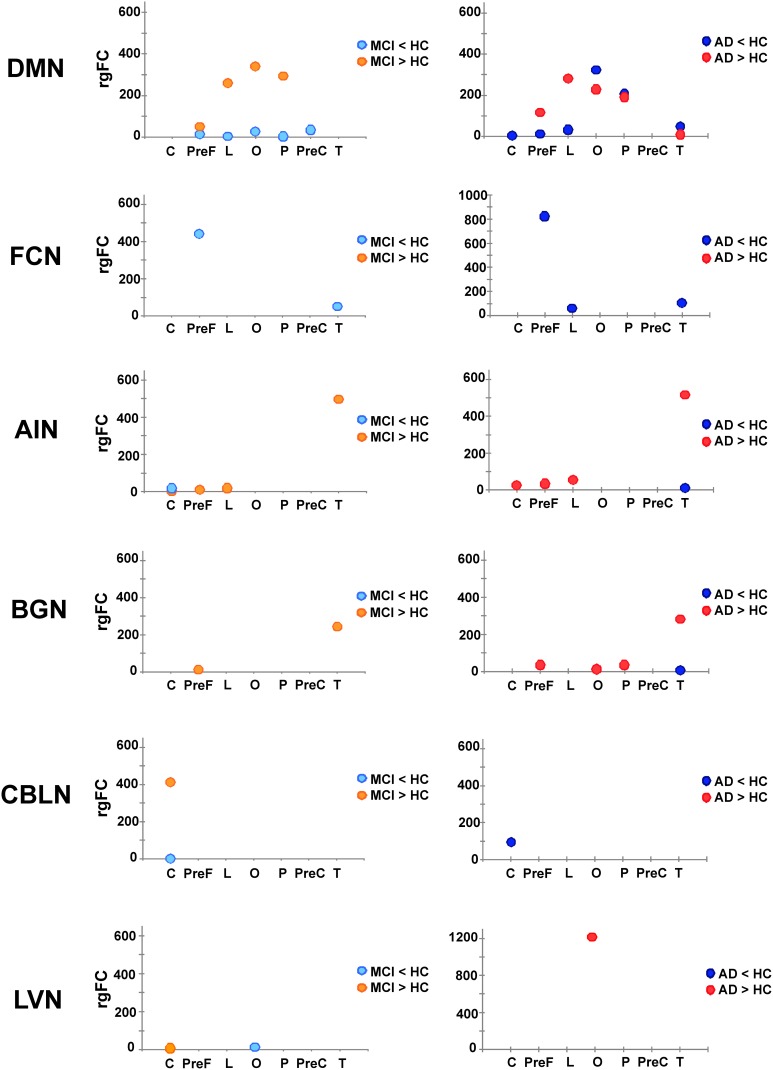
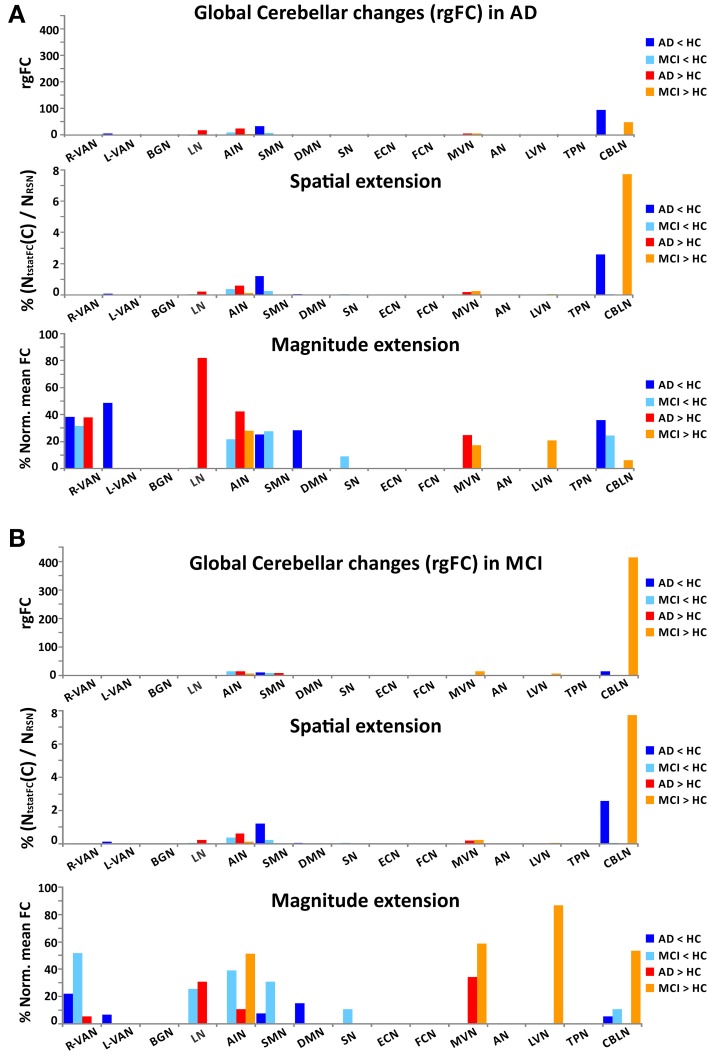
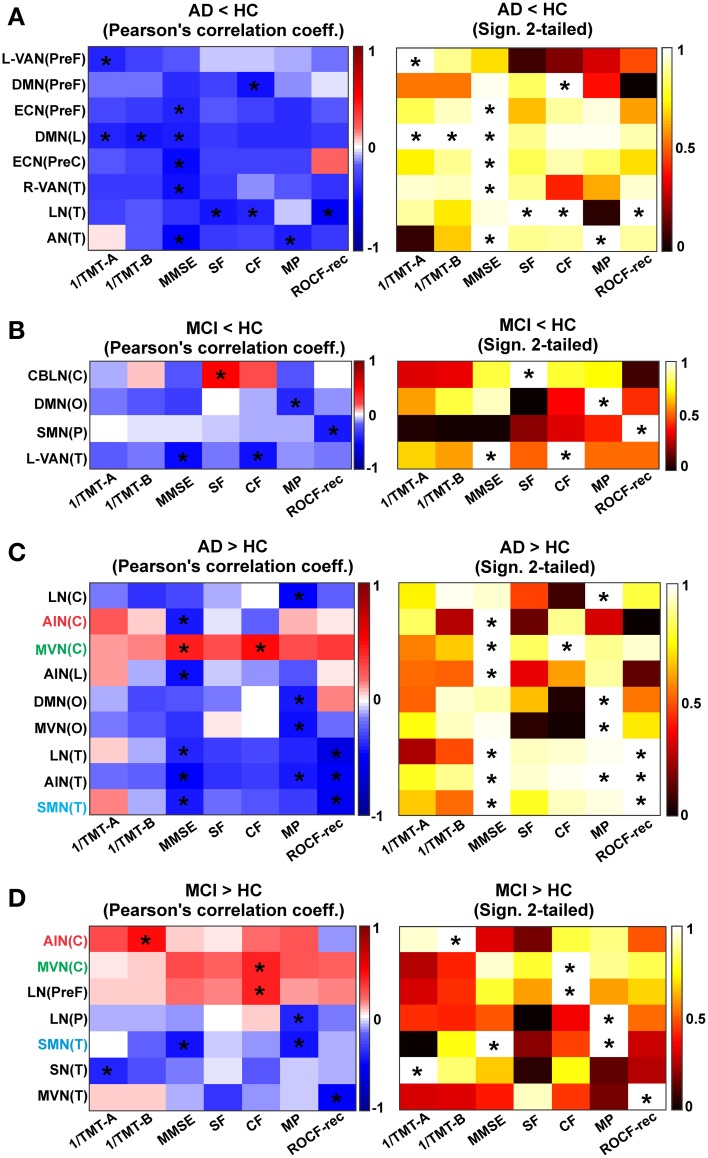
In resting state fMRI (rs-fMRI), only functional connectivity (FC) reductions in the default mode network (DMN) are normally reported as a biomarker for Alzheimer's disease (AD). In this investigation we have developed a comprehensive strategy to characterize the FC changes occurring in multiple networks and applied it in a pilot study of subjects with AD and Mild Cognitive Impairment (MCI), compared to healthy controls (HC). Resting state networks (RSNs) were studied in 14 AD (70 ± 6 years), 12 MCI (74 ± 6 years), and 16 HC (69 ± 5 years). RSN alterations were present in almost all the 15 recognized RSNs; overall, 474 voxels presented a reduced FC in MCI and 1244 in AD while 1627 voxels showed an increased FC in MCI and 1711 in AD. The RSNs were then ranked according to the magnitude and extension of FC changes (gFC), putting in evidence 6 RSNs with prominent changes: DMN, frontal cortical network (FCN), lateral visual network (LVN), basal ganglia network (BGN), cerebellar network (CBLN), and the anterior insula network (AIN). Nodes, or hubs, showing alterations common to more than one RSN were mostly localized within the prefrontal cortex and the mesial-temporal cortex. The cerebellum showed a unique behavior where voxels of decreased gFC were only found in AD while a significant gFC increase was only found in MCI. The gFC alterations showed strong correlations (p < 0.001) with psychological scores, in particular Mini-Mental State Examination (MMSE) and attention/memory tasks. In conclusion, this analysis revealed that the DMN was affected by remarkable FC increases, that FC alterations extended over several RSNs, that derangement of functional relationships between multiple areas occurred already in the early stages of dementia. These results warrant future work to verify whether these represent compensatory mechanisms that exploit a pre-existing neural reserve through plasticity, which evolve in a state of lack of connectivity between different networks with the worsening of the pathology.
Keywords: Alzheimer disease; cerebro-cerebellar networks; functional connectivity alterations; mild cognitive impairment; resting state fMRI.
Figures
Similar articles
-
Prominent Changes in Cerebro-Cerebellar Functional Connectivity During Continuous Cognitive Processing.Front Cell Neurosci. 2018 Oct 1;12:331. doi: 10.3389/fncel.2018.00331. eCollection 2018. Front Cell Neurosci. 2018. PMID: 30327590 Free PMC article.
-
Differences Changes in Cerebellar Functional Connectivity Between Mild Cognitive Impairment and Alzheimer's Disease: A Seed-Based Approach.Front Neurol. 2021 Jun 17;12:645171. doi: 10.3389/fneur.2021.645171. eCollection 2021. Front Neurol. 2021. PMID: 34220669 Free PMC article.
-
Does resting state functional connectivity differ between mild cognitive impairment and early Alzheimer's dementia?J Neurol Sci. 2020 Nov 15;418:117093. doi: 10.1016/j.jns.2020.117093. Epub 2020 Aug 13. J Neurol Sci. 2020. PMID: 32827882
-
Diagnostic power of resting-state fMRI for detection of network connectivity in Alzheimer's disease and mild cognitive impairment: A systematic review.Hum Brain Mapp. 2021 Jun 15;42(9):2941-2968. doi: 10.1002/hbm.25369. Epub 2021 May 4. Hum Brain Mapp. 2021. PMID: 33942449 Free PMC article.
-
The Contribution of Resting State Networks to the Study of Cortical Reorganization in MS.Mult Scler Int. 2013;2013:857807. doi: 10.1155/2013/857807. Epub 2013 Oct 31. Mult Scler Int. 2013. PMID: 24288613 Free PMC article. Review.
Cited by
-
Integration of multimodal neuroimaging methods: a rationale for clinical applications of simultaneous EEG-fMRI.Funct Neurol. 2015 Jan-Mar;30(1):9-20. Funct Neurol. 2015. PMID: 26214023 Free PMC article. Review.
-
Relay and higher-order thalamic nuclei show an intertwined functional association with cortical-networks.Commun Biol. 2022 Nov 4;5(1):1187. doi: 10.1038/s42003-022-04126-w. Commun Biol. 2022. PMID: 36333448 Free PMC article.
-
Altered brain spontaneous activity in patients with cerebral small vessel disease using the amplitude of low-frequency fluctuation of different frequency bands.Front Neurosci. 2023 Nov 16;17:1282496. doi: 10.3389/fnins.2023.1282496. eCollection 2023. Front Neurosci. 2023. PMID: 38033542 Free PMC article.
-
Age-related changes in resting-state networks of a large sample size of healthy elderly.CNS Neurosci Ther. 2015 Oct;21(10):817-25. doi: 10.1111/cns.12396. Epub 2015 Apr 13. CNS Neurosci Ther. 2015. PMID: 25864728 Free PMC article.
-
Virtual brain simulations reveal network-specific parameters in neurodegenerative dementias.Front Aging Neurosci. 2023 Jul 28;15:1204134. doi: 10.3389/fnagi.2023.1204134. eCollection 2023. Front Aging Neurosci. 2023. PMID: 37577354 Free PMC article.
References
-
- Babiloni C., Vecchio F., Altavilla R., Tibuzzi F., Lizio R., Altamura C., et al. (2014). Hypercapnia affects the functional coupling of resting state electroencephalographic rhythms and cerebral haemodynamics in healthy elderly subjects and in patients with amnestic mild cognitive impairment. Clin. Neurophysiol. 125, 685–693 10.1016/j.clinph.2013.10.002 - DOI - PubMed
LinkOut - more resources
Full Text Sources
Other Literature Sources
Miscellaneous