. 2014 Apr 22:3:93.
doi: 10.12688/f1000research.3720.1. eCollection 2014.

Cytoplasmic nanojunctions between lysosomes and sarcoplasmic reticulum are required for specific calcium signaling

Affiliations

Cytoplasmic nanojunctions between lysosomes and sarcoplasmic reticulum are required for specific calcium signaling

Nicola Fameli et al. F1000Res. .

Abstract

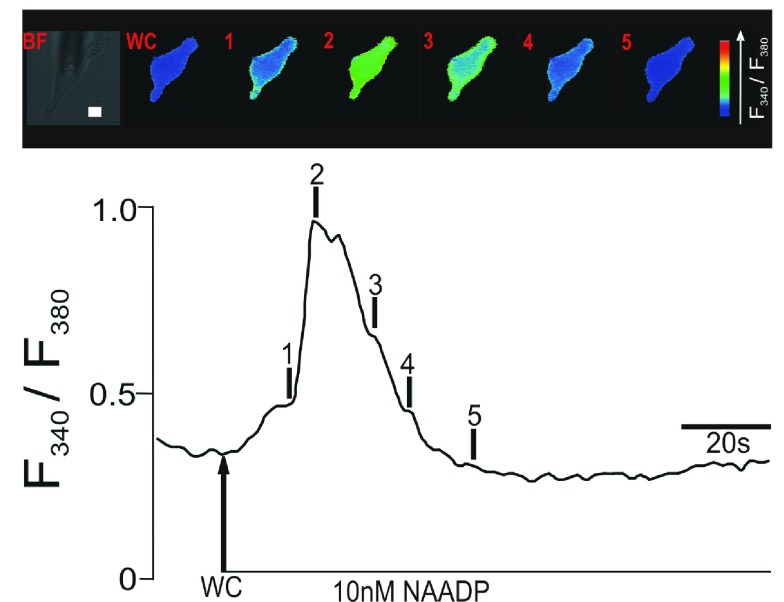
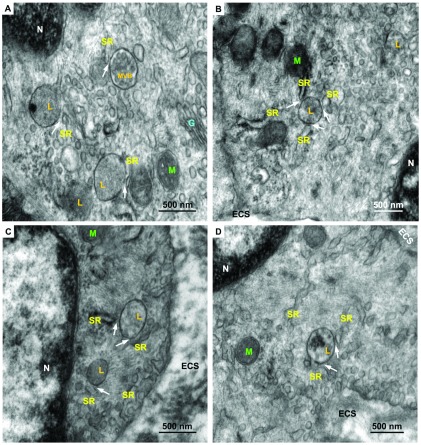
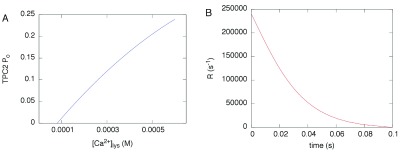
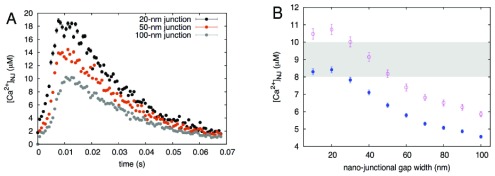
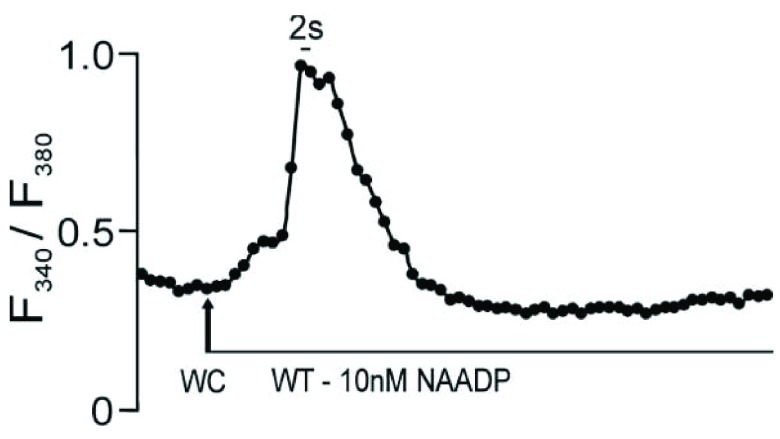
Herein we demonstrate how nanojunctions between lysosomes and sarcoplasmic reticulum (L-SR junctions) serve to couple lysosomal activation to regenerative, ryanodine receptor-mediated cellular Ca (2+) waves. In pulmonary artery smooth muscle cells (PASMCs) it has been proposed that nicotinic acid adenine dinucleotide phosphate (NAADP) triggers increases in cytoplasmic Ca (2+) via L-SR junctions, in a manner that requires initial Ca (2+) release from lysosomes and subsequent Ca (2+)-induced Ca (2+) release (CICR) via ryanodine receptor (RyR) subtype 3 on the SR membrane proximal to lysosomes. L-SR junction membrane separation has been estimated to be < 400 nm and thus beyond the resolution of light microscopy, which has restricted detailed investigations of the junctional coupling process. The present study utilizes standard and tomographic transmission electron microscopy to provide a thorough ultrastructural characterization of the L-SR junctions in PASMCs. We show that L-SR nanojunctions are prominent features within these cells and estimate that the junctional membrane separation and extension are about 15 nm and 300 nm, respectively. Furthermore, we develop a quantitative model of the L-SR junction using these measurements, prior kinetic and specific Ca (2+) signal information as input data. Simulations of NAADP-dependent junctional Ca (2+) transients demonstrate that the magnitude of these signals can breach the threshold for CICR via RyR3. By correlation analysis of live cell Ca (2+) signals and simulated Ca (2+) transients within L-SR junctions, we estimate that "trigger zones" comprising 60-100 junctions are required to confer a signal of similar magnitude. This is compatible with the 110 lysosomes/cell estimated from our ultrastructural observations. Most importantly, our model shows that increasing the L-SR junctional width above 50 nm lowers the magnitude of junctional [Ca (2+)] such that there is a failure to breach the threshold for CICR via RyR3. L-SR junctions are therefore a pre-requisite for efficient Ca (2+)signal coupling and may contribute to cellular function in health and disease.


Conflict of interest statement

Competing interests: No competing interests were disclosed.

Figures

Figure 1.
Figure 1.
Upper panel shows a series of pseudocolour images of the Fura-2 fluorescence ratio (F340/F380) recorded in an isolated pulmonary artery smooth muscle cell during intracellular dialysis of 10 nM NAADP. Note the spatially localized ‘Ca 2+ burst’ (time point 1). Lower panel shows the record of the Fura-2 fluorescence ratio against time corresponding to the upper panel of pseudocolours images; note the discrete shoulder in the rising phase of the F340/F380 ratio that corresponds to the initial ‘Ca 2+ burst’. Scale bar: 10 μm.
Figure 2.
Figure 2.
Representative electron micrographs of rat pulmonary artery SMC regions containing lysosomes (L), several SR cisterns, and including several examples of L-SR junctions (arrows). Also indicated are nuclei (N), Golgi apparatus (G), mitochondria (M), a multivesicular body (MVB) and extra-cellular space (ECS). Scale bars: 500 nm. Magnifications: A, C 80,000×, B, 60,000×, D, 70,000×.
Figure 3.
Figure 3.
A, High magnification (150,000×) electron micrograph of a region of Figure 2B containing 3 L-SR junctions (arrows); coloured tracings as shown were used to measure lysosome dimensions, L-SR widths and extensions. Scale bar: 100 nm. BD, Histograms showing distribution of several relevant lysosomal and L-SR junctional parameters, used to characterize the junctions and inform the quantitative model. B, lysosomal dimensions as major and minor axes of oval shapes in micrographs; C, L-SR junctional width; D, percentage apposition between junctional SR and lysosome perimeter as projected in 2D micrographs.
Figure 4.
Figure 4.
A, Snapshot from a TEM tomogram of a L-SR region of rat pulmonary artery smooth muscle, illustrating, among other things, a single SR extension apparently forming junctions with several lysosomes. Magnification: 62,000×. B, Same snapshot shown in A, but with a lysosome (orange) and a portion of SR (turquoise) partially traced out in 3D. These pseudocolour tracings underscore how the SR can appear as a large cistern in a given plane, but can actually branch out in different directions when viewed in 3D. Scale bars ≈ 100 nm.
Figure 5.
Figure 5.
A and B, 3D software reproduction of a lysosome closely apposed to a portion of SR, thereby forming an ≈ 20-nm-wide L-SR nanojunction; this rendering was inspired by a series of observations from micrographs as in Figure 2 (grey object: SR, blue object: lysosome). Included are relevant molecules traversing Brownian motion trajectories produced by the model simulations (see symbol legend below the panels). B, enlarged view of the L-SR junctional region, in which we have displayed the volume object (rust-coloured box) used to measure the [Ca 2+] NJ transients like the ones reported in Figure 7. Scale bar: 100 nm. The model geometry and code files are available from the corresponding author.
Figure 6.
Figure 6.
A, open probability P o of the TPC2-dependent Ca 2+ conductance reproduced from a quadratic fit to the data reported in the literature . B, Ca 2+ release rate calculated as explained in the text, based on the P o in A.
Figure 7.
Figure 7.
A, calculated nanojunctional [Ca 2+] transient, [Ca 2+] NJ, "measured" inside the volume of the recreated L-SR nanojunction shown in Figure 5. To show the effect of changes in the junctional geometry, we report three transients calculated using different junctional widths of 20, 50 and 100 nm. B, [Ca 2+] NJ vs width of junction, concentration values are temporal averages of the transients as in panel A, calculated over an interval of 0.065 s (solid circles) and 0.046 s (empty circles); see text for explanation. The shaded area indicates the approximate threshold values for CICR at RyR3s .
None

References

    1. Van Breemen C: Calcium requirement for activation of intact aortic smooth muscle. J Physiol. 1977;272(2):317–29 - PMC - PubMed
    1. van Breemen C, Saida K, Yamamoto H, et al. : Vascular smooth muscle sarcoplasmic reticulum. Function and mechanisms of Ca2+ release. Ann N Y Acad Sci. 1988;522:60– 73 10.1111/j.1749-6632.1988.tb33344.x - DOI - PubMed
    1. Malmersjö S, Meyer T: Inside-out connections: the ER meets the plasma membrane. Cell. 2013;153(7):1423–4 10.1016/j.cell.2013.05.054 - DOI - PMC - PubMed
    1. van Breemen C, Fameli N, Evans AM: Panjunctional sarcoplasmic reticulum in vascular smooth muscle: nanospace Ca2+ transport for site- and function-specific Ca2+ signalling. J Physiol. 2013;591(Pt 8):2043–54 10.1113/jphysiol.2012.246348 - DOI - PMC - PubMed
    1. Moore EDW, Wasteneys GO: Nanospace biophysics. Editorial. Protoplasma. 2012;249(Suppl 1):S1 10.1007/s00709-011-0366-2 - DOI - PubMed