. 2014 Oct 1;10(10):1702-11.
doi: 10.4161/auto.32122. Epub 2014 Aug 12.

Autophagy is required for G₁/G₀ quiescence in response to nitrogen starvation in Saccharomyces cerevisiae

Affiliations

Autophagy is required for G₁/G₀ quiescence in response to nitrogen starvation in Saccharomyces cerevisiae

Zhenyi An et al. Autophagy. .

Abstract

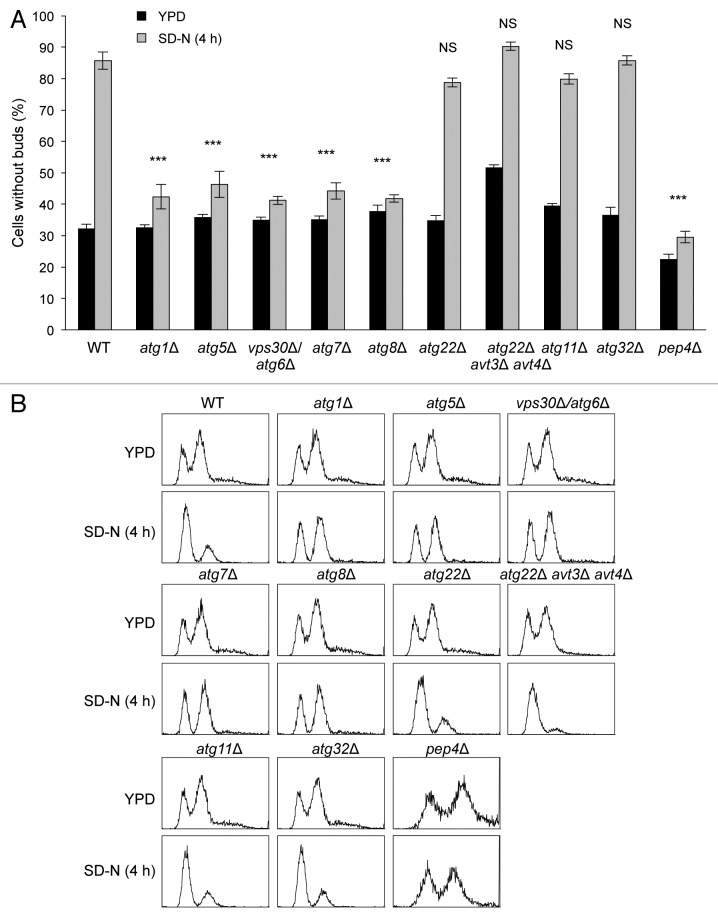
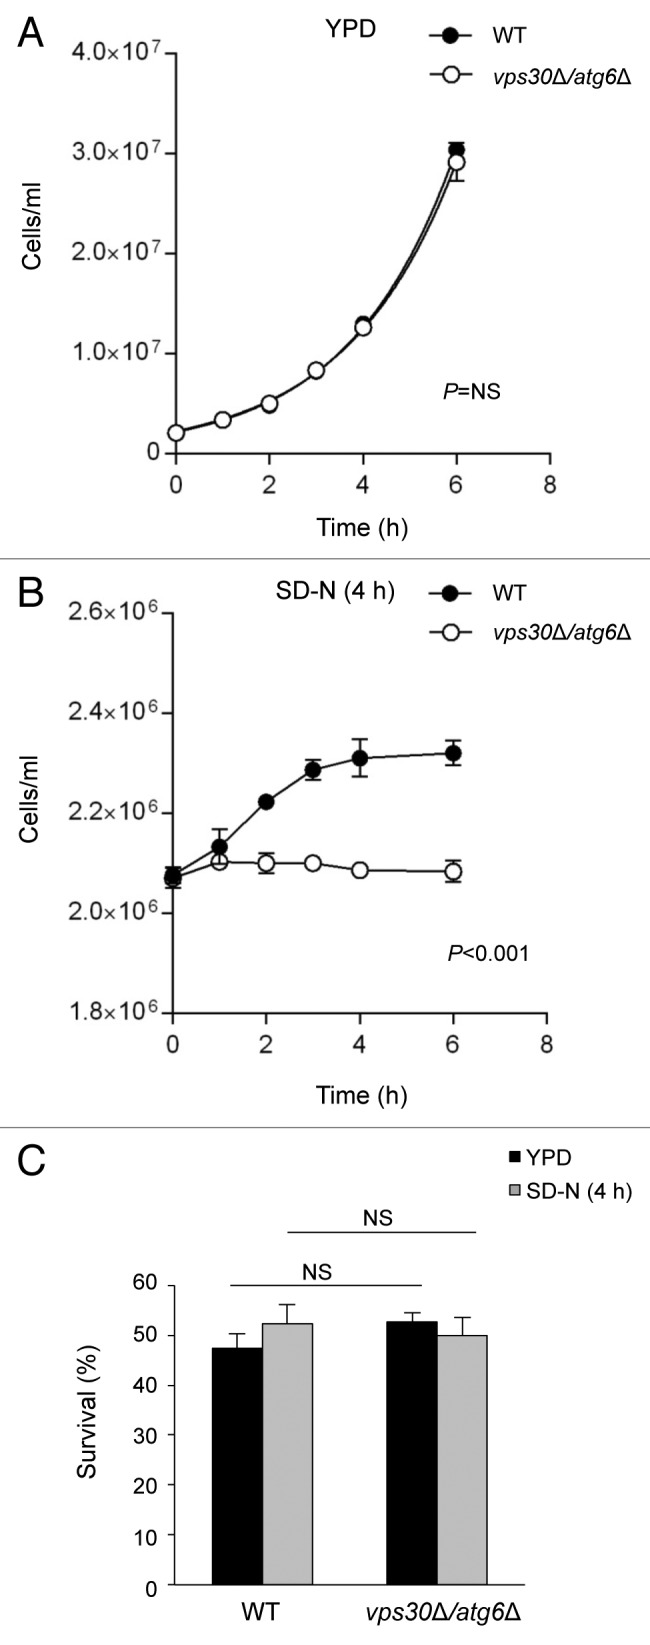
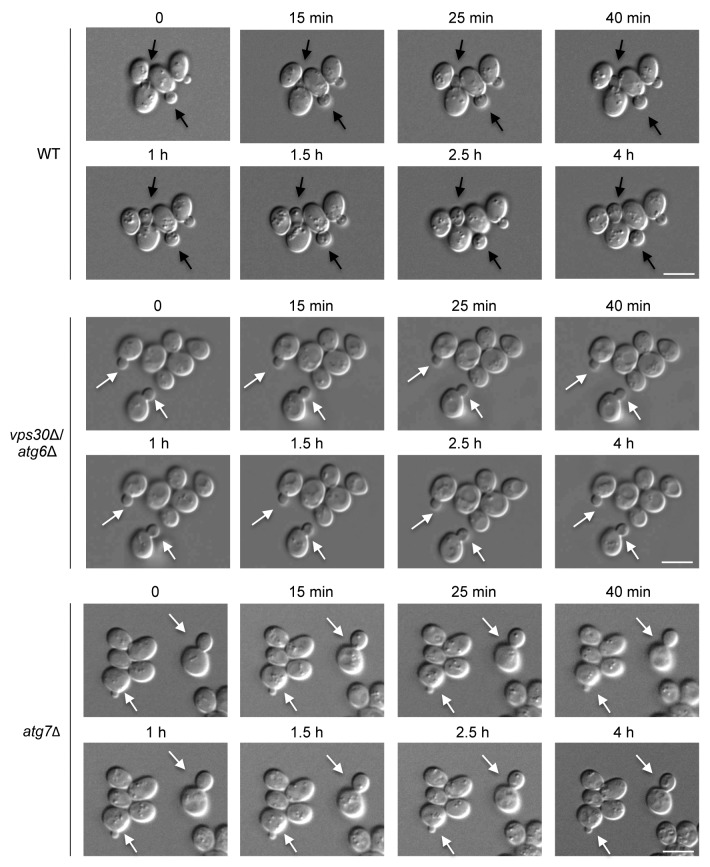
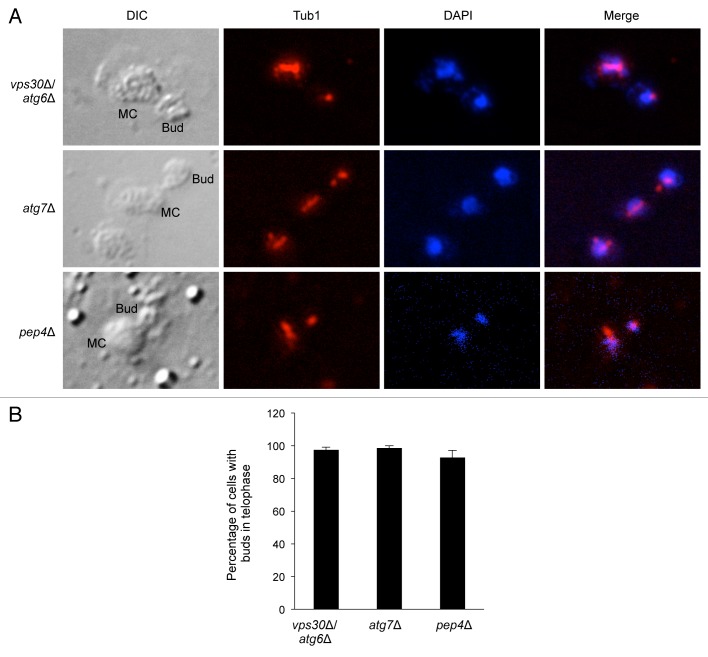
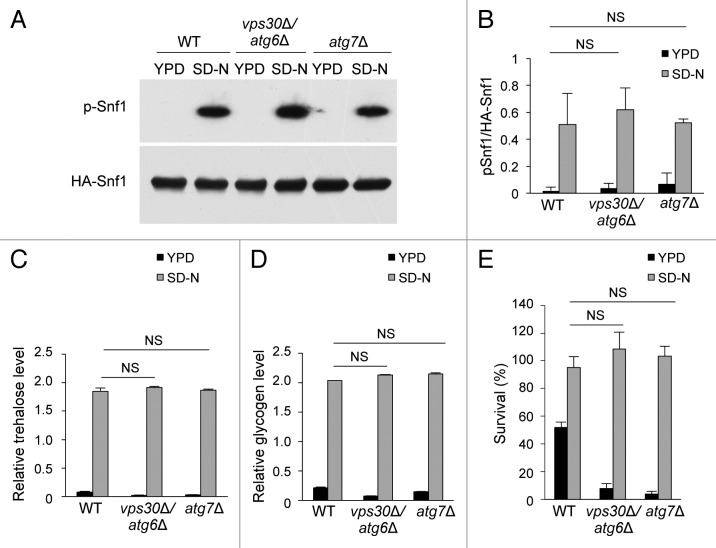
In response to starvation, cells undergo increased levels of autophagy and cell cycle arrest but the role of autophagy in starvation-induced cell cycle arrest is not fully understood. Here we show that autophagy genes regulate cell cycle arrest in the budding yeast Saccharomyces cerevisiae during nitrogen starvation. While exponentially growing wild-type yeasts preferentially arrest in G₁/G₀ in response to starvation, yeasts carrying null mutations in autophagy genes show a significantly higher percentage of cells in G₂/M. In these autophagy-deficient yeast strains, starvation elicits physiological properties associated with quiescence, such as Snf1 activation, glycogen and trehalose accumulation as well as heat-shock resistance. However, while nutrient-starved wild-type yeasts finish the G₂/M transition and arrest in G₁/G 0₀ autophagy-deficient yeasts arrest in telophase. Our results suggest that autophagy is crucial for mitotic exit during starvation and appropriate entry into a G₁/G₀ quiescent state.

Keywords: autophagy; cell cycle; quiescence; starvation; yeast.


Figures

None
Figure 1. Cell-cycle analysis of wild-type and autophagy-deficient yeasts during nitrogen starvation. (A) Quantification of the percentage of wild-type and indicated atg mutant yeast strains without buds at time 0 (YPD) or after 4 h in SD-N (SD-N). Bars represent mean ± SEM of triplicate samples (at least 100 cells per sample were counted). Similar results were observed in more than 3 independent experiments. ***P < 0.001, NS, not significant; 2-way ANOVA with Bonferroni correction for comparison of magnitude of change between YPD and SD-N in the indicated atg mutant yeast strain compared with the magnitude of change between YPD and SD-N in wild-type (WT) yeasts. (B) FACS analysis of cell cycle of the indicated yeast strains at time 0 (YPD) or after 4 h in SD-N (SD-N). 10,000 cells were analyzed per strain. Similar results were observed in more than 3 independent experiments.
None
Figure 2. Cell growth and cell survival of wild-type and autophagy-deficient yeast during nitrogen starvation. (A and B) The number of yeast cells grown in YPD (A) or SD-N (B) was quantified at serial time points. Values represent mean ± SEM of triplicate samples. Similar results were observed in 2 independent experiments. In (A) cell growth curves were fitted to an exponential growth model to determine their doubling time. The difference between growth curves in wild-type (WT) vs. vps30Δ/atg6Δ yeast strains was analyzed using an ANOVA model; statistical results are indicated in each graph. NS, not significant. (C) Wild-type (WT) and vps30Δ/atg6Δ strains were grown in YPD or SD-N for 4 h and tested for survival by plating 100 cells on YPD plates and counting colonies after 48 h at 30 °C. Cell survival was calculated as the percentage of colonies over the total number of plated cells. Bars represent mean ± SEM of triplicate samples. Similar results were observed in 2 independent experiments. NS, not significant; one-way ANOVA for indicated comparison.
None
Figure 3. Autophagy-deficient yeasts fail to complete cell division after nitrogen starvation. Yeasts were grown on an SD-N agarose pad and images were taken at serial time points using a Zeiss Axioplan 2 microscope. The time above each image indicates the time in nitrogen starvation (SD-N). Black arrows denote buds that separate to become daughter cells during the imaging period. White arrows denote buds that fail to separate to become daughter cells during the imaging period. Scale bar: 5 μm. At least 15 cells were examined per time-lapse photography experiment and similar results were observed in 5 different experiments.
None
Figure 4. Autophagy-deficient yeasts and pep4∆ yeasts arrest in telophase after nitrogen starvation. (A) Anti-Tub1 staining and DNA staining with DAPI of indicated yeast strains starved in SD-N for 4 h. MC, mother cell. (B) Quantification of percentage of cells with buds that are in telophase. Values represent mean ± SEM of triplicate samples (> 50 cells analyzed per sample). Similar results were observed in 3 independent experiments.
None
Figure 5. Analysis of quiescence-specific phenotypes in wild-type and autophagy-deficient yeasts after nitrogen starvation. (A) Western blot detection of p-Snf1 during growth in YPD at time 0 (YPD) or 30 min after transfer to SD-N (SD-N) in indicated yeast strains transformed with a plasmid expressing HA-Snf1. (B) Densitometry quantification of the ratio of p-Snf1/total Snf1 in indicated yeast strains transformed with a plasmid expressing HA-Snf1 and cultured as described in (A). Bars represent mean ± SEM values from 3 independent experiments, including the representative gels shown in (A). (C and D) Measurement of trehalose (C) and glycogen (D) levels in yeasts grown in YPD or SD-N for 4 h. Bars represent mean ± SEM of triplicate samples. Similar results were observed in 3 independent experiments. (E) Assessment of heat-shock resistance in indicated yeast strains during growth in YPD or SD-N for 4 h. Bars represent mean ± SEM of triplicate samples. Similar results were observed in 3 independent experiments. NS, not significant; one-way ANOVA with Tukey test for multiple comparisons.

References

    1. Jorgensen P, Tyers M. How cells coordinate growth and division. Curr Biol. 2004;14:R1014–27. doi: 10.1016/j.cub.2004.11.027. - DOI - PubMed
    1. Smets B, Ghillebert R, De Snijder P, Binda M, Swinnen E, De Virgilio C, Winderickx J. Life in the midst of scarcity: adaptations to nutrient availability in Saccharomyces cerevisiae. Curr Genet. 2010;56:1–32. doi: 10.1007/s00294-009-0287-1. - DOI - PubMed
    1. Daignan-Fornier B, Sagot I. Proliferation/Quiescence: When to start? Where to stop? What to stock? Cell Div. 2011;6:20. doi: 10.1186/1747-1028-6-20. - DOI - PMC - PubMed
    1. Laporte D, Lebaudy A, Sahin A, Pinson B, Ceschin J, Daignan-Fornier B, Sagot I. Metabolic status rather than cell cycle signals control quiescence entry and exit. J Cell Biol. 2011;192:949–57. doi: 10.1083/jcb.201009028. - DOI - PMC - PubMed
    1. Wei W, Nurse P, Broek D. Yeast cells can enter a quiescent state through G1, S, G2, or M phase of the cell cycle. Cancer Res. 1993;53:1867–70. - PubMed

Publication types

MeSH terms

LinkOut - more resources