. 2014 Oct 1;10(10):1801-13.
doi: 10.4161/auto.32136. Epub 2014 Aug 5.

Endoplasmic reticulum stress induced by tunicamycin and thapsigargin protects against transient ischemic brain injury: Involvement of PARK2-dependent mitophagy

Affiliations

Endoplasmic reticulum stress induced by tunicamycin and thapsigargin protects against transient ischemic brain injury: Involvement of PARK2-dependent mitophagy

Xiangnan Zhang et al. Autophagy. .

Abstract

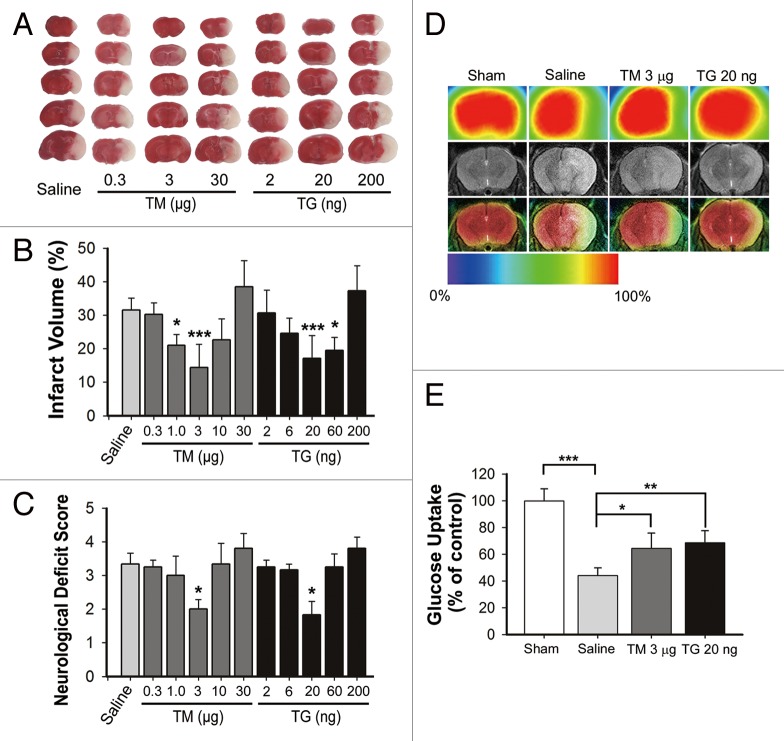
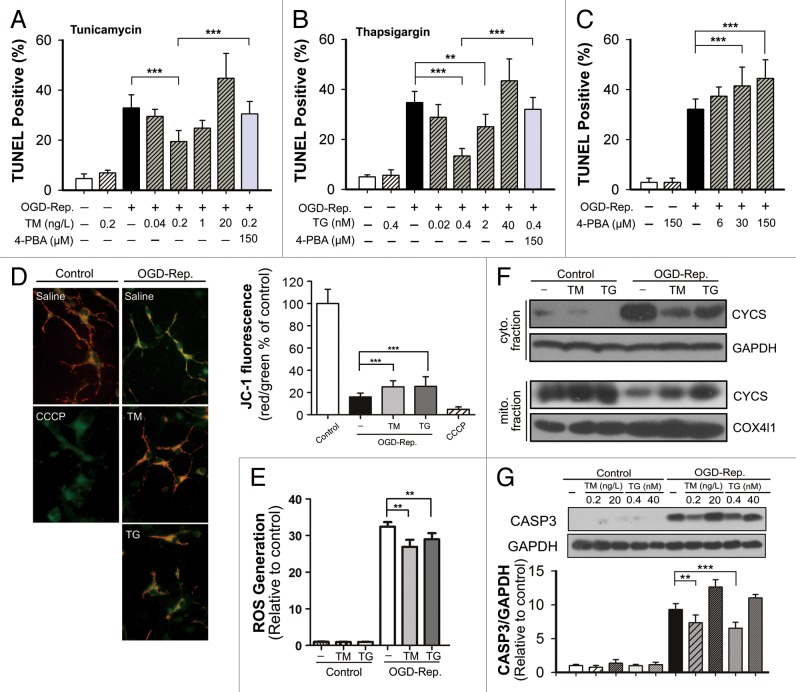
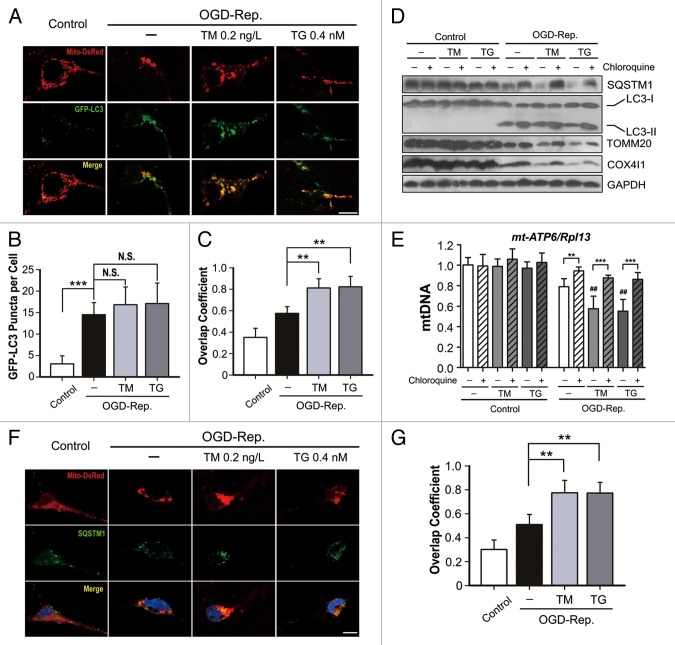
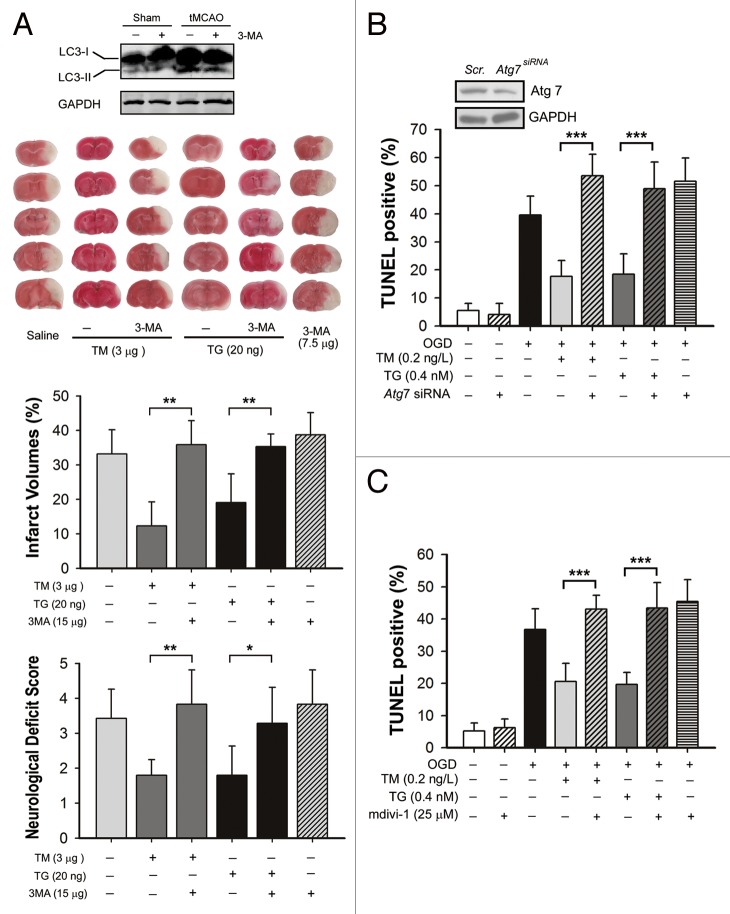
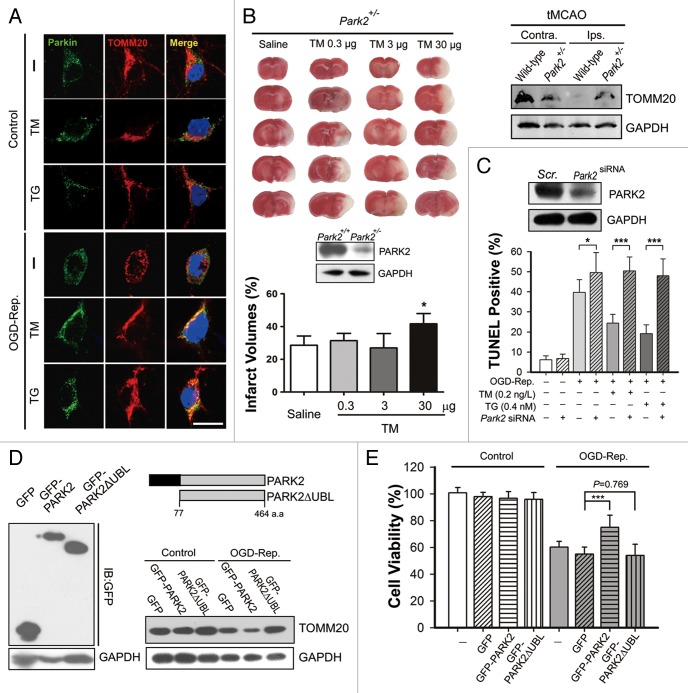
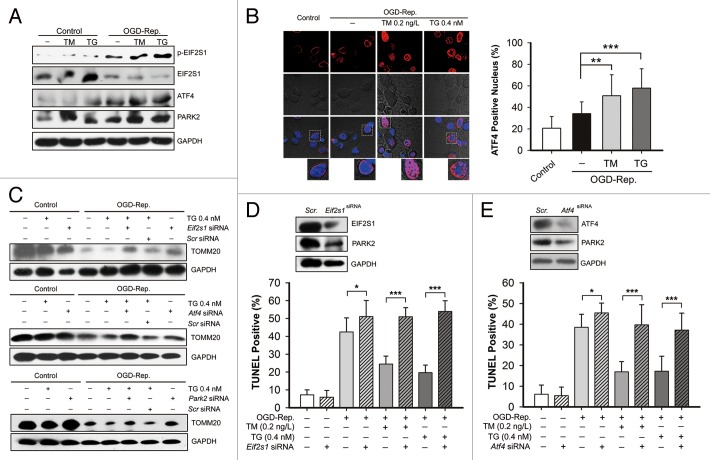
Transient cerebral ischemia leads to endoplasmic reticulum (ER) stress. However, the contributions of ER stress to cerebral ischemia are not clear. To address this issue, the ER stress activators tunicamycin (TM) and thapsigargin (TG) were administered to transient middle cerebral artery occluded (tMCAO) mice and oxygen-glucose deprivation-reperfusion (OGD-Rep.)-treated neurons. Both TM and TG showed significant protection against ischemia-induced brain injury, as revealed by reduced brain infarct volume and increased glucose uptake rate in ischemic tissue. In OGD-Rep.-treated neurons, 4-PBA, the ER stress releasing mechanism, counteracted the neuronal protection of TM and TG, which also supports a protective role of ER stress in transient brain ischemia. Knocking down the ER stress sensor Eif2s1, which is further activated by TM and TG, reduced the OGD-Rep.-induced neuronal cell death. In addition, both TM and TG prevented PARK2 loss, promoted its recruitment to mitochondria, and activated mitophagy during reperfusion after ischemia. The neuroprotection of TM and TG was reversed by autophagy inhibition (3-methyladenine and Atg7 knockdown) as well as Park2 silencing. The neuroprotection was also diminished in Park2(+/-) mice. Moreover, Eif2s1 and downstream Atf4 silencing reduced PARK2 expression, impaired mitophagy induction, and counteracted the neuroprotection. Taken together, the present investigation demonstrates that the ER stress induced by TM and TG protects against the transient ischemic brain injury. The PARK2-mediated mitophagy may be underlying the protection of ER stress. These findings may provide a new strategy to rescue ischemic brains by inducing mitophagy through ER stress activation.

Keywords: PARK2; cerebral ischemia; endoplasmic reticulum stress; mitophagy; neuroprotection.


Figures

None
Figure 1. Tunicamycin (TM) and thapsigargin (TG) protected against ischemia-reperfusion-induced brain injury. Mice were subjected to middle cerebral artery occlusion for 1 h, and reperfusion was allowed by removing the monofilament suture. The indicated dosages of TM or TG were injected icv at the onset of reperfusion. (A) Animals were euthanized 24 h after MCAO and infarct volumes were determined by TTC staining in the bar charts (mean ± SD, n = 6). (B) Representative TTC-stained brain slices from each group are shown. (C) The neurological deficit scores of each group are presented. (D) Representative coregistration of MicroPET and MRI images of mice. Three micrograms TM, 20 ng TG or the same saline volume was administered icv at the onset of reperfusion, respectively; 24 h after reperfusion, T2-weighted MRI scanning mouse brain was obtained. 18F-FDG (activity ~300 Ci/mmol) was administered to mice under halothane anesthesia. After a quiet uptake period of 60 min, a 20 min static acquisition of MicroPET scan was performed. (E) Ratio of region was normalized to contralateral brain uptake (mean ± SD, n = 4). Statistical analysis was performed with one-way ANOVA followed by the Dunnett t test; *P < 0.05, **P < 0.01, ***P < 0.001 vs. saline (B and C) or indicated group (E).
None
Figure 2. Tunicamycin (TM) and thapsigargin (TG) attenuated oxygen-glucose deprivation-reperfusion (OGD-Rep.)-induced apoptosis in primary neuronal cell cultures. Primary cultured neurons were subjected to OGD for 2 h, and treated with the indicated dosage of TM, TG, or 4-PBA during reperfusion. After 24 h of reperfusion, the cell apoptosis rate with treatment of TM (A), TG (B) or 4-PBA alone (C) was were determined by TUNEL and DAPI staining. (D) The mitochondrial membrane potential was detected by JC-1 staining. (E) Reactive oxygen species generation was detected by DCFH-DA staining. (F) CYCS levels in both cytosol (cyto.) and mitochondria (mito.) fractions were determined by western blot. (G) Cleaved-CASP3 expression was determined by western blot and semiquantitative levels are shown in the bar chart (mean ± SD, n = 3). Statistical comparisons were performed with one-way ANOVA followed by the Dunnett t test; **P < 0.01 and ***P < 0.001 vs. the indicated group.
None
Figure 3. Tunicamycin (TM) and thapsigargin (TG) further activated oxygen-glucose deprivation-reperfusion (OGD-Rep.)-induced mitophagy in primary cultures of neuronal cells. Primary neuronal cultures were subjected to OGD for 2 h, and treated with 0.4 nmol/L TG or 0.2 ng/L TM at the onset of reperfusion. (A) Neuronal cells were previously transfected with GFP-LC3 and Mito-DsRed by viral vector infection. After 1 h of reperfusion, fluorescent images were captured by confocal microscopy. Images show representative examples from 3 independent experiments. (B) Columns represent the number of GFP-LC3-positive puncta per cell. At least 5 random fields from one section and 3 to 6 sections were averaged in each independent experiment. The bar chart shows mean ± SD values of puncta number from at least 3 independent experiments; at least 50 cells were counted in each group. (C) Columns represent the Manders overlap coefficient of Mito-DsRed and GFP-LC3. At least 44 cells from 3 independent experiments for each group were included. (D) After 6 h of reperfusion, the LC3, SQSTM1, TOMM20 and COX4I1 protein levels were determined by western blot analysis in the presence or absence of chloroquine. (E) Six hours after reperfusion, relative mitochondrial DNA (mtDNA) levels indicated as the mt-Atp6 (mitochondria-encoded DNA)/Rpl13 (nucleus-encoded DNA) ratio were assessed by real-time PCR. (F) Cells were previously labeled with Mito-DsRed and 6 h after reperfusion, SQSTM1 was determined by immunostaining. (G) The columns represent the Manders overlap coefficient of Mito-DsRed and SQSTM1. At least 29 cells from 3 independent experiments for each group were included. The experiments were repeated independently at least 3 times. The data are expressed as mean ± SD. Statistical comparisons were performed with one-way ANOVA followed by the Dunnett t test. **P < 0.01, ***P < 0.001 vs. the indicated group. ##P < 0.01 vs. OGD-Rep. alone group.
None
Figure 4. Mitophagy inhibition blocked the protection of tunicamycin (TM) and thapsigargin (TG). (A) Mice were subjected to middle cerebral artery occlusion for 1 h, infarct volumes and neurological deficit scores were measured 24 h after reperfusion. 7.5 µg of 3-methyladenine (3-MA) was icv injected either with 3 µg TM, 20 ng TG or alone at the onset of reperfusion. (B) Atg7 was knocked down in primary cultured mice cortical neurons by pretreating cells with a lentivirus containing Atg7-shRNA (Atg7 siRNA); control cells were treated with scrambled shRNA (Scr.). The silencing effect was identified by western blot (upper panel). Cells were then subject to 2 h OGD followed by 24 h of reperfusion, and all the reagents indicated were administered at the onset of reperfusion. Cell apoptosis rate was determined by TUNEL staining after 24 h of reperfusion. (C) Cells were treated with 25 µmol/L mdivi-1 at the onset of reperfusion with or without TM and TG. TUNEL staining was performed 24 h after reperfusion. The data are expressed as mean ± SD. Statistical comparisons were performed with one-way ANOVA followed by the Dunnett t test. *P < 0.05, **P < 0.01, ***P < 0.001 vs. the indicated group.
None
Figure 5. PARK2 is involved in the neuroprotection conferred by tunicamycin (TM) and thapsigargin (TG). (A) Primary cultures of mouse cortical neurons were subjected to 2 h of OGD and 1 h of reperfusion. Dosages of 0.2 ng/L TM or 0.4 nmol/L TG were administered simultaneously with reperfusion. Control cells experienced the same treatment without OGD. PARK2 (green) and the mitochondrial marker TOMM20 (red) were stained by immunocytochemistry and the images were taken by confocal microscopy. (B) The PARK2 level in wild-type and Park2+/− mice cortex was measured by western blot (lower panel). The Park2+/− mice were subjected to tMCAO as described and the indicated dosage of TM was icv injected at the onset of reperfusion. The infarct volumes were determined 24 h after reperfusion. The TOMM20 level in both wild-type and the Park2+/− mouse cortex after 6 h of tMCAO, either the ipsilateral (Ips.) or contralateral (Contra.), was examined by western blot (right upper panel). (C) In primary cultures of cortical neurons, PARK2 was knocked down by shRNA against mouse Park2 mRNA. The silencing effect was identified by western blot (upper panel). TUNEL staining was performed after 2 h of OGD followed by 24 h of reperfusion. (D and E) Neuro2a cells were subjected to 4 h of OGD followed by 24 h of reperfusion. (D) Neuro2a cells were either transfected with plasmids encoding pEGFP, pEGFP-PARK2 or pEGFP-PARK2ΔUBL. The transfection effects were identified by western blot against GFP (left panel). The schematic diagram shows the PARK2 and PARK2ΔUBL amino acid sequence (right upper panel). After 24 h of reperfusion, the TOMM20 level of the indicated groups was examined by western blot. (E) Cells had been transfected with the indicated plasmids 24 h previously, and cell viability was examined by MTT assay after 24 h of reperfusion. The data are expressed as mean ± SD. Statistical comparisons were performed with one-way ANOVA followed by the Dunnett t test. *P < 0.05, **P < 0.01, ***P < 0.001 vs. the indicated group.
None
Figure 6. The EIF2S1-ATF4 signaling pathway is involved in tunicamycin (TM) and thapsigargin (TG)-activated PARK2-mediated mitophagy in ischemic neurons. Primary cultures of mouse cortical neurons were subjected to 2 h of OGD followed by different periods of reperfusion. Dosages of 0.2 ng/L TM or 0.4 nmol/L TG were treated simultaneously with reperfusion for 3 h. (A) The levels of EIF2S1, phosphorylated EIF2S1 (p-EIF2S1), ATF4 and PARK2 were determined by western blot, and the GAPDH level was taken as loading control. (B) Representative images show that cells were immunostained for ATF4 (Red) and the cell nucleus was labeled by DAPI (blue). The ATF4-positive nucleus ratio in each indicated group was calculated and is shown in the right bar chart. At least 5 random fields from one section and 3 to 6 sections were averaged in each independent experiment. (C–E) EIF2S1, ATF4, and PARK2 in cultures of primary neurons, were previously knocked down by transfecting their specific shRNA, respectively. The control cells were transfected with scrambled shRNA. (C) The TOMM20 levels in the indicated groups were determined by western blot, and GAPDH was detected as loading control. (D) The effects of Eif2s1 knockdown was confirmed by western blot (upper panel). The cell apoptosis rate in each group was examined by TUNEL staining after 24 h of reperfusion. (E) The effects of Atf4 knockdown were confirmed by western blot (upper panel). The cell apoptosis rate in each group was examined by TUNEL staining after 24 h of reperfusion. The data are expressed as mean ± SD. Statistical comparisons were performed with one-way ANOVA followed by the Dunnett t test. *P < 0.05, **P < 0.01, ***P < 0.001 vs. indicated group.

References

    1. Roussel BD, Kruppa AJ, Miranda E, Crowther DC, Lomas DA, Marciniak SJ. Endoplasmic reticulum dysfunction in neurological disease. Lancet Neurol. 2013;12:105–18. doi: 10.1016/S1474-4422(12)70238-7. - DOI - PubMed
    1. Paschen W. Endoplasmic reticulum dysfunction in brain pathology: critical role of protein synthesis. Curr Neurovasc Res. 2004;1:173–81. doi: 10.2174/1567202043480125. - DOI - PubMed
    1. Chen X, Kintner DB, Luo J, Baba A, Matsuda T, Sun D. Endoplasmic reticulum Ca2+ dysregulation and endoplasmic reticulum stress following in vitro neuronal ischemia: role of Na+-K+-Cl- cotransporter. J Neurochem. 2008;106:1563–76. doi: 10.1111/j.1471-4159.2008.05501.x. - DOI - PMC - PubMed
    1. Paschen W, Doutheil J. Disturbances of the functioning of endoplasmic reticulum: a key mechanism underlying neuronal cell injury? J Cereb Blood Flow Metab. 1999;19:1–18. doi: 10.1097/00004647-199901000-00001. - DOI - PubMed
    1. Schinzel AC, Takeuchi O, Huang Z, Fisher JK, Zhou Z, Rubens J, Hetz C, Danial NN, Moskowitz MA, Korsmeyer SJ. Cyclophilin D is a component of mitochondrial permeability transition and mediates neuronal cell death after focal cerebral ischemia. Proc Natl Acad Sci U S A. 2005;102:12005–10. doi: 10.1073/pnas.0505294102. - DOI - PMC - PubMed

Publication types

MeSH terms

LinkOut - more resources