. 2014 Aug 14;158(4):705-721.
doi: 10.1016/j.cell.2014.05.052.

Altering the intestinal microbiota during a critical developmental window has lasting metabolic consequences

Affiliations

Altering the intestinal microbiota during a critical developmental window has lasting metabolic consequences

Laura M Cox et al. Cell. .

Abstract

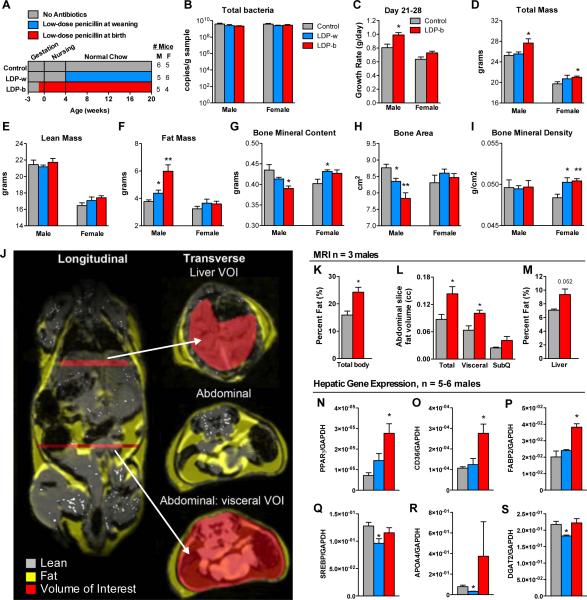
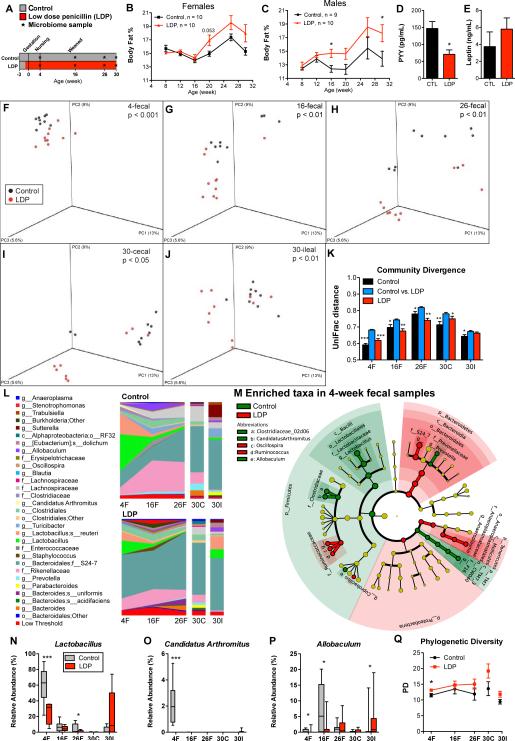
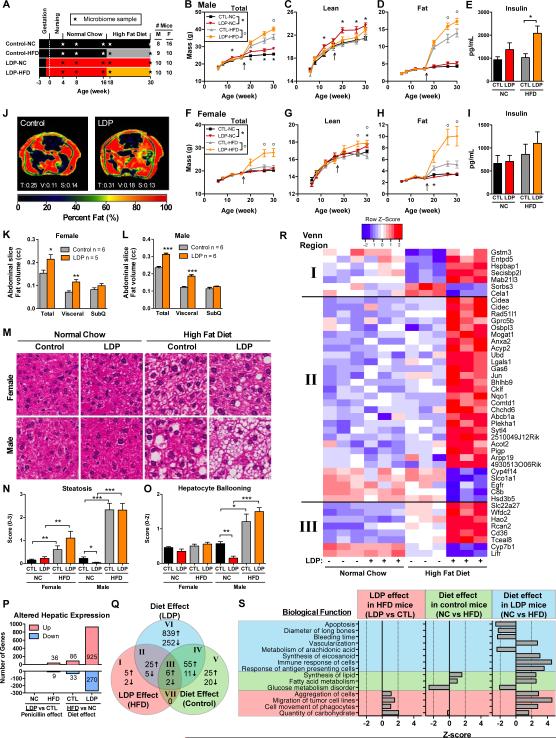
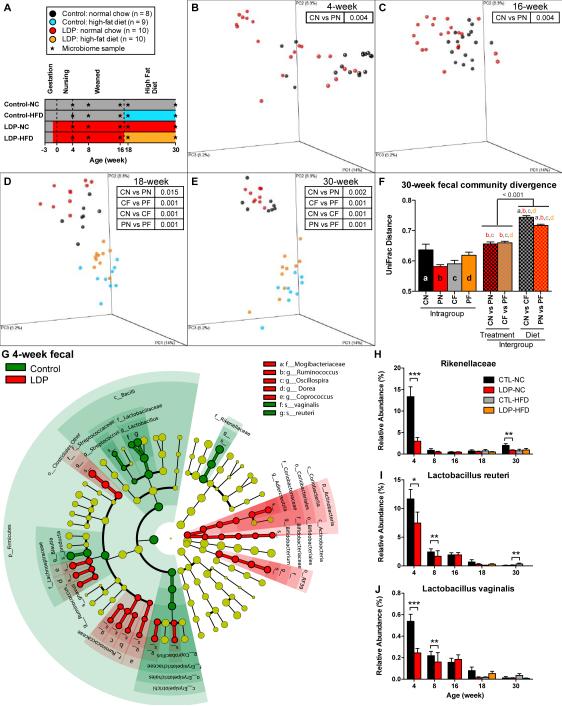
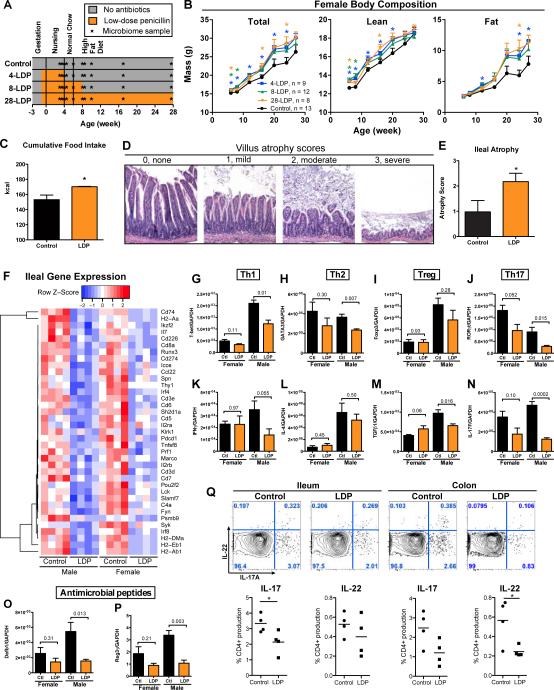
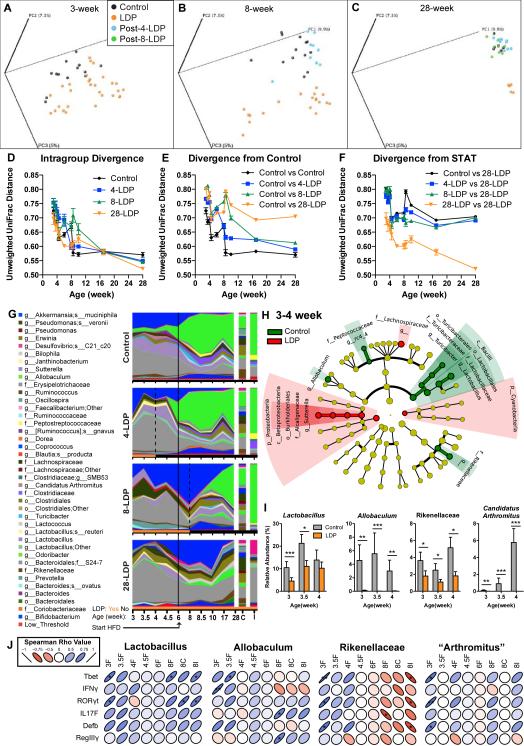
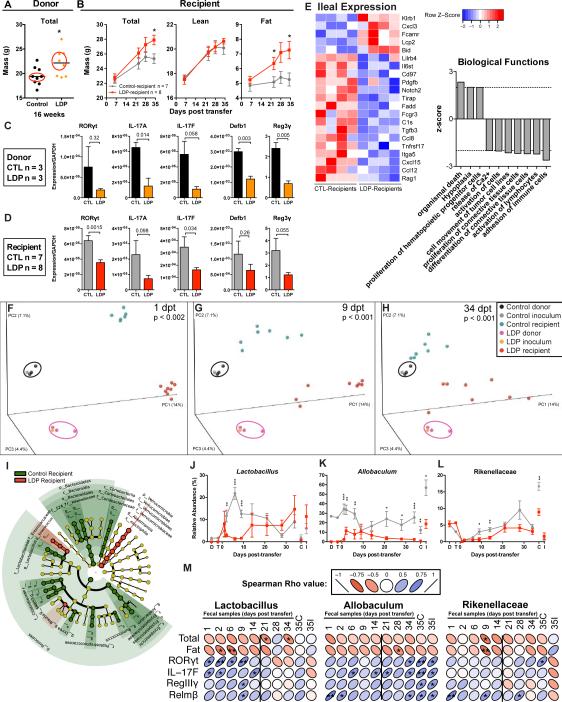
Acquisition of the intestinal microbiota begins at birth, and a stable microbial community develops from a succession of key organisms. Disruption of the microbiota during maturation by low-dose antibiotic exposure can alter host metabolism and adiposity. We now show that low-dose penicillin (LDP), delivered from birth, induces metabolic alterations and affects ileal expression of genes involved in immunity. LDP that is limited to early life transiently perturbs the microbiota, which is sufficient to induce sustained effects on body composition, indicating that microbiota interactions in infancy may be critical determinants of long-term host metabolic effects. In addition, LDP enhances the effect of high-fat diet induced obesity. The growth promotion phenotype is transferrable to germ-free hosts by LDP-selected microbiota, showing that the altered microbiota, not antibiotics per se, play a causal role. These studies characterize important variables in early-life microbe-host metabolic interaction and identify several taxa consistently linked with metabolic alterations. PAPERCLIP:


Figures

Figure 1
Figure 1. Effect of timing of initial LDP exposure on body composition
(A) Study design: C57B/L6J mice received low dose (1 μg/g body weight) penicillin (LDP) continuously for life, either beginning at weaning at day 28 of life (LDP-w, n = 5 male, 6 female), or from birth (LDP-b, n = 5 male, 4 female). Control mice had no penicillin exposure (n = 6 male, 5 female). (B) Levels of cecal bacteria at week 20 determined by quantitative PCR using universal bacterial 16S rRNA primers. (C) Early-life (peri-weaning: day 21 to day 28) growth rate. (D-I) Body composition and bone histomorphometry determined at week 20, by DEXA scanning. (J) MRI representation of lean (gray) and fat (yellow) tissue and regions that were analyzed for hepatic and visceral fat (red). (K) Adiposity (total body fat%) determined by MRI in three male mice each in LDP-b and control groups at week 18. (L) Total abdominal, visceral, and subcutaneous fat volume, and (M) liver adiposity (fat%). (N-S) Hepatic gene expression in week 20 male mice (n = 5-6/group). * p < 0.05, ** p < 0.01, *** p < 0.001, t-test compared to control. Graphs are displayed as mean ± SEM.
Figure 2
Figure 2. Dynamics of microbiota and adiposity changes over 30 weeks of life
(A) Study design: Female and male C57B/L6 mice received low dose penicillin (LDP, n = 10 males and females), or no antibiotics (control, n = 9 males and 10 females) for 30 weeks. (B-C) Body fat percent over time, determined by DEXA scanning, in female and male mice. Serum levels of (D) peptide YY (PYY) and (E) leptin at week 30 in male mice. * p < 0.05 significantly different by t-test for B-E, and Q. (F-Q) Fecal specimens obtained at weeks 4, 16, and 26, and the terminal (week 30) cecal and ileal specimens from male mice were examined by sequencing the V1-2 region of the bacterial 16S rRNA gene. (F-J) Principal coordinate analysis (PCoA) of unweighted UniFrac distances of the intestinal microbiota at each sample point; p-values listed for differential clustering assessed by ADONIS test. (K) Divergence within (control vs control, LDP vs LDP) and between communities (control vs LDP) measured by unweighted UniFrac distance. The UniFrac matrix was permutated 10,000 times; p-values represent fraction of times permuted differences were greater than real distances; * p < 0.05 , **p < 0.01, *** p < 0.001 significantly different from intragroup distance. (L) Mean relative abundance of predominant bacteria (>1% in any sample) in control and LDP mice. Taxa are reported at the lowest identifiable level, indicated by the letter preceding the underscore: o, order; f, family, g, genus; s, species. (M) Cladograms, generated from LEfSe analysis, represent taxa enriched in control (green) or LDP (red) 4-week fecal microbiota. The central point represents the root of the tree (Bacteria), and each ring represents the next lower taxonomic level (phylum through genus). The diameter of each circle represents the relative abundance of the taxon. When full identification was not possible, g_ or s_ alone was used for genus or species, respectively. (N-P) Relative abundance of Lactobacillus, Candidatus Arthromitus (SFB), and Allobaculum; asterisks indicate level of significance by Mann-Whitney U test, see also Figure S1 and Table S1. (Q) Phylogenetic diversity in control and LDP male mice (Mean ± SEM), calculated at a uniform depth of 4,000 sequences/sample.
Figure 3
Figure 3. Effects of combining LDP and High Fat Diet
(A) Study design: Male and female mice either received low dose penicillin (LDP) from birth or did not receive antibiotics (control, CTL). All mice were started on a normal (NC) chow diet, and then half were maintained on normal chow and half switched to a high fat (HFD) diet at week 17. (B-H) Body composition consisting of total, lean, and fat mass in male and female mice, determined by DEXA. (E, I) Fasting insulin in week 30 mice. (J-L) Distribution of abdominal body fat, determined by MRI at week 26 (n = 5-6 each). (J) Images show representative male mice; numbers represent the volume of total (T), visceral (V), and subcutaneous (S) fat mass in three consecutive slices. (K-L) Abdominal adiposity, quantified by total, visceral, and subcutaneous fat in three consecutive cross-sections in female and male mice. (M-O) Hepatic histopathology: (M) Representative hematoxylin and eosin-stained sections. (N-O) Steatosis and hepatocyte ballooning scores. (B-O) * p < 0.05, ** p < 0.01, *** p < 0.001, t-test for B-L; and Mann-Whitney U for N-O. Graphs are displayed as mean ± SEM. (P-S) Hepatic gene expression, measured by microarray in male mice at 30 weeks of age (n = 3 in each of the four exposure groups). (P) Number of genes that have significant (FDR-adjusted p < 0.05) hepatic expression differences comparing either LDP treatment or dietary changes, that are up- or down- regulated in the underlined group with respect to the non-underlined group. (Q) Comparative analysis of differential hepatic gene expression. Venn diagram indicates the number of overlapping genes in three separate pairwise comparisons, LDP effect in HFD mice (LDP vs CTL), diet effect in control mice (HFD vs NC) and diet effect in LDP mice (HFD vs NC). (R) Heatmaps depict gene expression values of Venn regions I-III (see also Figure S2 for regions IV-VI). (S) Predicted biological functions that are differentially represented, (p < 0.05, z-score > |2|) based on Ingenuity Pathway Analysis of microarray measurements of hepatic gene expression.
Figure 4
Figure 4. The effect of HFD and LDP on intestinal microbiota composition
(A) Study design: control (C) mice did not receive antibiotics; LDP (P) mice received low-dose penicillin from birth. All mice were started on normal chow (N), and then half were switched to HFD (F) at week 17. Microbiota samples were collected longitudinally for 16S rRNA sequencing. (B-E) PCoA of fecal microbiota samples at weeks 4, 16, 18, and 30; p-values for differential clustering assessed by ADONIS test are indicated in the insets. (F) Mean pairwise intra- and intergroup unweighted UniFrac distances of week 30 fecal microbial, letters a-d indicate significant differences with respect to intragroup distances, p < 0.05 based on 10,000 permutations. (H) Cladogram representing taxa enriched in 4-week fecal samples in control or LDP mice, detected be the LEfSe tool. (H-J) Relative abundance of Rikenellaceae, Lactobacillus reuteri and Lactobacillus vaginalis in fecal samples from weeks 4-30, * p < 0.05, ** p < 0.01, *** p < 0.001, Mann-Whitney U test. Graphs are displayed as mean ± SEM. See also Figure S3.
Figure 5
Figure 5. Early-life LDP induces lasting changes in adult body composition
(A) Study design: Both male and female mice received 4 (4-LDP), 8 (8-LDP), or 28 (28-LDP) weeks of low-dose penicillin (LDP), or no antibiotics (control). (B) Total, lean, and fat mass in female mice, measured by DEXA scanning. * p < 0.05 significant difference at a single time point measured by t-test. 4-, 8-, and 28-LDP mice had significantly increased rates of total and fat mass accumulation from 6-20 weeks of age (Table S2). (C) Cumulative food intake for female mice over 12 days during weeks 6 to 8 (n = 4 mice/group in metabolic cages). (D) Histopathology: representative H&E-stained ileal sections with villus atrophy scores 0-3. (E) Mean ± SEM ileal atrophy score in male control and LDP mice (n = 5 each), * p < 0.05 Mann-Whitney U for panels C&E. (F) Expression of ileal genes that are significantly altered by LDP in both male and female mice (n = 4 each) at 8 weeks of age, measured by the Nanostring Mouse Immunology Kit, genes shown p < 0.05, t-test (see also Table S3). Ileal expression of transcription factors (G-J) and cytokines (K-N) representative of four T-helper cell lineages, and expression of antimicrobial peptides (O-P) measured by qPCR; p-values shown for t-tests for 8-week male and female mice, n = 4 each. (Q) Flow cytometry of ileal and colonic tissue from male control and LDP mice at 8-weeks of age (n = 4) for IL-17 and IL-22, * p < 0.05 t-test. See also Figure S4. Graphs are displayed as mean ± SEM.
Figure 6
Figure 6. Effect of limited early-life LDP on the intestinal microbiota
(A-C) PCoA of the unweighted UniFrac distances computed from 16S rRNA sequences from (A) week 3, (B) week 8, (C) and week 28 microbiota in female mice receiving either 4, 8, or 28 weeks of LDP or not receiving antibiotics (control). (D-F) Intragroup and intergroup divergence measured by unweighted UniFrac distances over time. (G) Relative abundance of the major taxa (>1% in any sample) in the intestinal microbiota. Dotted lines show cessation of antibiotics, and the solid line shows start of HFD. (H) Phylogenetic representation of the taxa in the week 3, 3.5, and 4 fecal samples significantly associated with control (green) or LDP (red), as determined by LEfSe. (I) Relative abundance of Lactobacillus, Allobaculum, Rikenellaceae, and Candidatus Arthromitus (SFB) in 3-4 week fecal samples. Graphs are displayed as mean ± SEM, * p < 0.05, ** p < 0.01, *** p < 0.001 Mann-Whitney U. (J) Spearman correlation of relative abundance of early-life (weeks 3-8) Lactobacillus, Allobaculum, Rikenellaceae, and Candidatus Arthromitus (SFB) with expression of ileal genes involved in intestinal defense. * p < 0.05, ** p < 0.01. See also Figure S6, and Table S4-5.
Figure 7
Figure 7. Metabolic, immunologic, and ecological consequences of transferring LDP-altered microbiota
Cecal microbiota from 3 control and 3 LDP 18-week old female C57B/L6J mice were collected, pooled, and transferred to 3-week old germ-free female Swiss-Webster mice by oral gavage. (A) Microbiota donors were selected based on the median total mass determined by DEXA scanning at week 16. (B) Total, lean, and fat mass in the now-conventionalized germ-free control- and LDP-microbiota recipient mice (n = 7 and 8, respectively), measured by DEXA scanning over the 35-day experiment. (C-D) Ileal gene expression in microbiota donor (n = 3 CTL, LDP) (C) and recipient (n = 7 & 8, CTL, LDP, respectively) (D) mice measured by qPCR, p-values listed from t-tests. (E) Expression of ileal genes significantly different between control- and LDP recipients (n = 4 each), measured by the Nanostring Mouse Immunology Kit, (p < 0.05, t-test). Biological functions predicted to be significantly increased (p< 0.05, z > |2|) in LDP mice based on Ingenuity Pathway Analysis of Nanostring expression values. (F-H) Community structure assessed by PCoA of unweighted UniFrac distances of microbiota samples: donor cecum; the transferred inoculum; and the recipient mouse fecal samples at days 1, 9, and 34 post-transfer (dpt). Significant differences in clustering between control and LDP were calculated by ADONIS test. (I) LEfSe cladogram depicting taxa in fecal samples from 1-14 dpt that are significantly increased in control (green) or LDP (red) specimens. Relative abundance of (J) Lactobacillus, (K) Allobaculum, and (L) Rikenellaceae, significant differences assessed by Mann-Whitney U. Graphs are displayed as mean ± SEM. (M) Spearman correlations between host phenotypic measurements and candidate protective taxa found in multiple experiments. The vertical lines separate the early (pre-phenotype) time-points. * p < 0.05. See also Figure S6-7 and Table S6.

References

    1. Anders S, Huber W. Differential expression analysis for sequence count data. Genome Biology. 2010;11:R106. - PMC - PubMed
    1. Anders S, Pyl PT, Huber W. HTSeq - A Python framework to work with high-throughput sequencing data. Journal Article. 2014 - PMC - PubMed
    1. Ajslev TA, Andersen CS, Gamborg M, Sørensen TIA, Jess T. Childhood overweight after establishment of the gut microbiota: the role of delivery mode, pre-pregnancy weight and early administration of antibiotics. Int J Obes. 2011;35:522–529. - PubMed
    1. Antonopoulos DA, Huse SM, Morrison HG, Schmidt TM, Sogin ML, Young VB. Reproducible community dynamics of the gastrointestinal microbiota following antibiotic perturbation. Infect Immun. 2009;77:2367–2375. - PMC - PubMed
    1. Antunes LCM, Finlay BB. A comparative analysis of the effect of antibiotic treatment and enteric infection on intestinal homeostasis. Gut Microbes. 2011;2:105–108. - PubMed

Publication types

Associated data