. 2014 Aug 14;158(4):734-748.
doi: 10.1016/j.cell.2014.07.030.

Function of a Foxp3 cis-element in protecting regulatory T cell identity

Affiliations

Function of a Foxp3 cis-element in protecting regulatory T cell identity

Xudong Li et al. Cell. .

Abstract

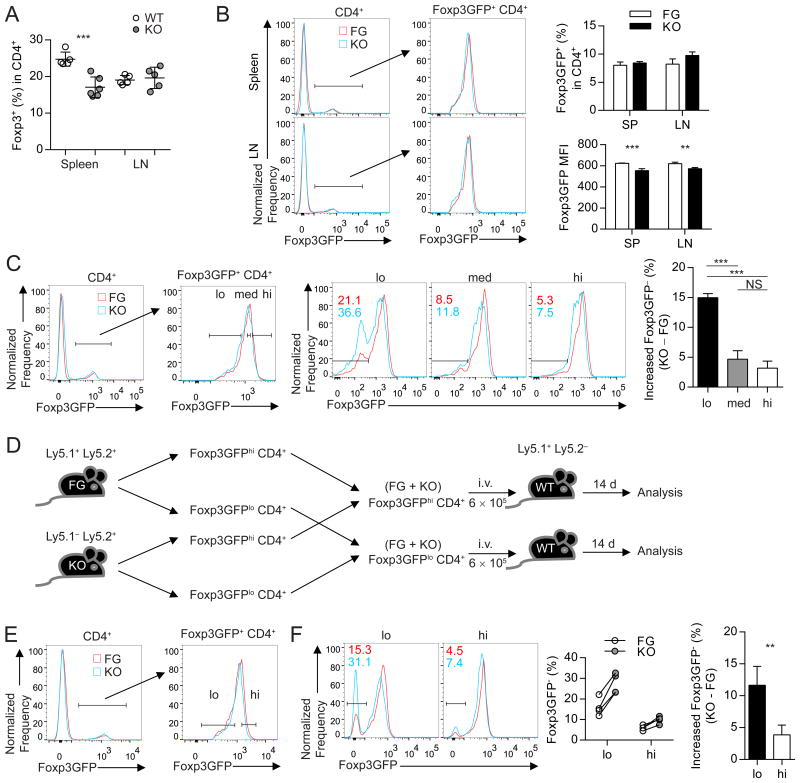
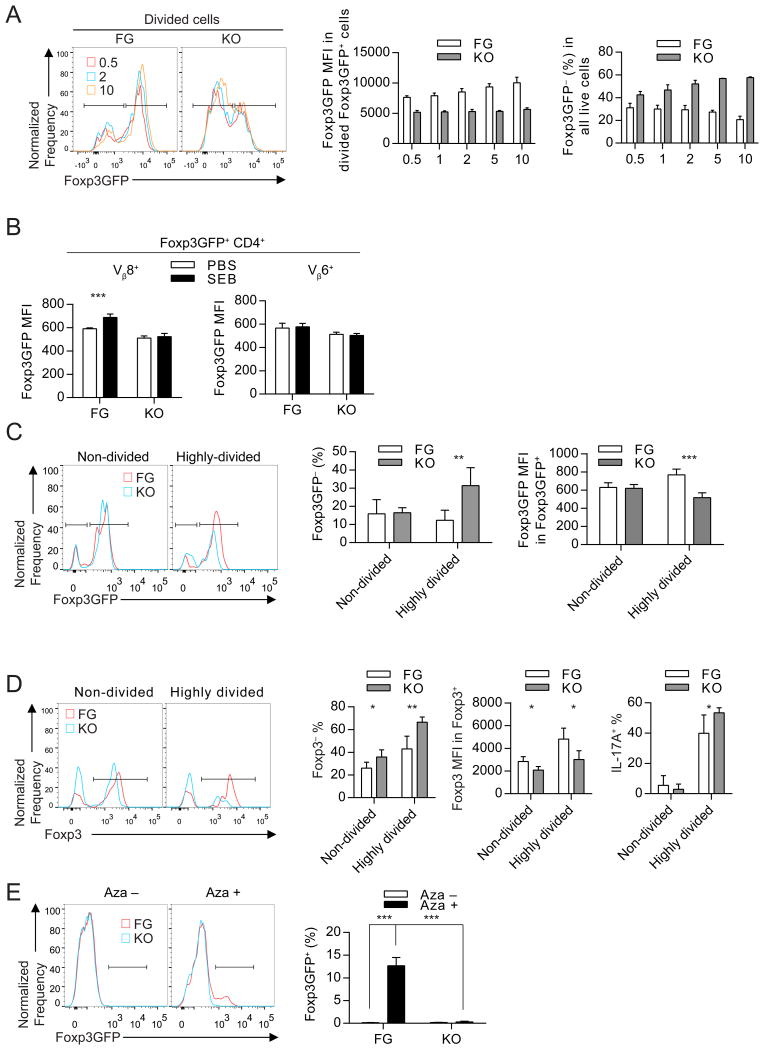
The homeostasis of multicellular organisms requires terminally differentiated cells to preserve their lineage specificity. However, it is unclear whether mechanisms exist to actively protect cell identity in response to environmental cues that confer functional plasticity. Regulatory T (Treg) cells, specified by the transcription factor Foxp3, are indispensable for immune system homeostasis. Here, we report that conserved noncoding sequence 2 (CNS2), a CpG-rich Foxp3 intronic cis-element specifically demethylated in mature Tregs, helps maintain immune homeostasis and limit autoimmune disease development by protecting Treg identity in response to signals that shape mature Treg functions and drive their initial differentiation. In activated Tregs, CNS2 helps protect Foxp3 expression from destabilizing cytokine conditions by sensing TCR/NFAT activation, which facilitates the interaction between CNS2 and Foxp3 promoter. Thus, epigenetically marked cis-elements can protect cell identity by sensing key environmental cues central to both cell identity formation and functional plasticity without interfering with initial cell differentiation.


Figures

Figure 1
Figure 1
CNS2 deletion in mice leads to spontaneous lymphoproliferative disease. (A, B, D, H) Body weights (A), spleen weights (B), representative hematoxylin and eosin staining of small intestine, liver, kidney, and lung sections (D), and concentration of IgE, IgG2c, IgG1, and IgA in serum, determined by enzyme linked immunosorbent assay (H) of 6-9-month-old CNS2 (knockout, KO) and littermate control (WT) mice. n = 5–7. (C, E, F, and G) Cellularity (C), CD4+ and CD8+ T cell numbers (E), frequency of CD62Llo CD44hi cells in Foxp3 CD4+ T cells (F), and frequency of IFN-γ+ and IL-4+ cells in CD4+ T cells (G) in spleens and peripheral lymph nodes (LN) from 9-month-old KO and WT mice. Numbers in top right quadrants (F, left) indicate percent gated cells. n = 5–6. All data are representative of three experiments. Mean ± s.d. See also Figure S1.
Figure 2
Figure 2
CNS2-dependent Tregs are enriched in the Foxp3lo Treg subset from CNS2 mice. (A) Frequency of Foxp3+ cells in CD4+ T cells in spleen and peripheral lymph nodes (LN) from 9-month-old CNS2(KO) and littermate control (WT) mice. n = 5–6. (B) Flow cytometry analysis of Foxp3GFP expression in cells in spleen and LN from 6-week-old young CNS2 (KO) and CNS2wild-type Foxp3GFP (FG) mice. MFI, mean fluorescence intensity. n = 4. (C) Foxp3GFPlo (lo), Foxp3GFPmed (med), and Foxp3GFPhi (hi) Tregs from KO and FG mice (left) were cultured in vitro for 3 days before flow cytometry analysis of Foxp3GFP expression (middle and right). Numbers in top left quadrants (middle) indicate percent Foxp3GFP cells. (D, E, and F) Equal numbers of Foxp3GFPlo (lo) and Foxp3GFPhi (hi) Tregs sort-purified (E) from Ly5.1+ Ly5.2+ FG and Ly5.1 Ly5.2+ KO mice were mixed and injected into Ly5.1+ Ly5.2 wild-type recipient mice intravenously. 14 days later, transferred cells were analyzed by flow cytometry (F). n = 4. All data are representative of three experiments. Mean ± s.d. See also Figure S2.
Figure 3
Figure 3
CNS2 is required for “effector” Tregs to maintain high levels of Foxp3 expression. (A) Foxp3GFPlo (lo) and Foxp3GFPhi (hi) Tregs sort-purified from 6-week-old CNS2 (KO) and Foxp3GFP (FG) mice (A) were used for RNA sequencing (RNA-seq) analysis (B and C). n = 2. (B) Clustering of RNA-seq samples based on gene expression. (C) Genes enriched in the Foxp3lo subset and/or depleted in the Foxp3hi subset of KO Tregs relative to FG Tregs, shown in groups based on their functions. (D, E, and F) Ki67+ cell frequency (D) and expression of CTLA4 (E) and ICOS (F) in Foxp3lo and Foxp3hi Tregs from 2-month-old KO and FG mice. Numbers in histograms indicate percent, Ki67+ cell (D) and mean fluorescence intensity (MFI) of CTLA4 (E) and ICOS (F). n = 5–6. (G) Suppression of proliferation of CellTrace Violet-labeled wild-type naive (CD62L+ CD44) CD4+ T responder cells (Tresp) by KO and FG Tregs, presented as dilution of CellTrace Violet in Tresp cells cultured with Tregs at indicated ratio (left). Data are representative of two (A, B, C, and G) and three (D, E, and F) experiments. Mean ± s.d. See also Figure S3 and Table S1.
Figure 4
Figure 4
CNS2 deletion exacerbates experimental autoimmune encephalomyelitis (EAE) development in mice. (A) Disease progression (left) and body weight (right) of CNS2 (KO) and littermate control mice (WT) after EAE induction. n = 6–7. (B, C, and D) Numbers of IL-17A+ and IFN-γ+ CD4+ T cells (B), frequency of Foxp3+ CD4+ T cells (C), and mean fluorescence intensity (MFI) of Foxp3 in Foxp3+ CD4+ T cells (D) in CNS 22 days after EAE induction. All data are representative of three experiments. Mean ± s.d. See also Figure S4.
Figure 5
Figure 5
CNS2 helps stabilizing Foxp3 expression in Tregs exposed to challenging cytokine conditions. (A and B) Foxp3GFP expression in CNS2 (KO) and Foxp3GFP (FG) Tregs cultured in the absence or presence of cytokines (IL-2, IL-12, IL-4, or IL-6) (A) or mouse IL-2 neutralizing antibody (B) for 3 days. Numbers in histograms (A) indicate percent Foxp3GFP cells. (C and D) Foxp3GFP expression (D) in in vivo generated FG and KO induced Tregs (iTregs) (C) cultured in the presence of IL-2 for 3 days. (E) Foxp3GFP expression in FG and KO natural Tregs (nTreg, Nrp1+) and iTregs (Nrp1) cultured in the presence of IL-2 for 3 days. All data are representative of at least two experiments. Mean ± s.d. See also Figure S5.
Figure 6
Figure 6
CNS2 is required for Tregs receiving strong TCR stimulation to maintain elevated Foxp3 expression in vitro and in vivo. (A) Foxp3GFP expression in CellTrace Violet-labeled CNS2 (KO) and Foxp3GFP (FG) Tregs cultured in wells coated with 0.5, 1, 2, 5, or 10 μg/ml of anti-CD3 and 10 μg/ml of anti-CD28 for 3 days. (B) Foxp3GFP expression in staphylococcal enterotoxin B (SEB)-responsive Vβ8+ and SEB-non-responsive Vβ6+ Tregs in spleens from 6-week-old KO and FG mice 4 days after intravenous injection with 100 μg SEB or vehicle (PBS). n = 4. (C) Foxp3 expression in cogenically marked CellTrace Violet-labeled KO and FG Tregs 14 days after being co-transferred into wild-type mice. n = 5. (D) Foxp3 expression and IL-17A secretion in CellTrace Violet-labeled FG or KO Tregs 7 days after being transferred into WT mice immunized with MOG and CFA 7 days before cell transfer. n = 5. (E) Foxp3GFP induction in KO and FG naive (Foxp3GFP– CD62Lhi CD44lo) CD4+ T cells activated for 4 days in the absence or presence of 1 μM 5-Aza-2′-deoxycytidine (Aza) (added 1 day after start of cell culture for the duration of 24 h). Mean ± s.d. See also Figure S6.
Figure 7
Figure 7
TCR stimulation activates NFAT to facilitate the interaction between CNS2 and Foxp3 promoter to promote Foxp3 expression. (A) Effects of NFAT inhibition with Cyclosporin A (CsA) on Foxp3GFP expression in CNS2 (KO) and Foxp3GFP (FG) Tregs activated by plate-coated anti-CD3 (10 μg/ml) and anti-CD28 (10 μg/ml) for 3 days. (B) Alignment of a putative NFAT:Foxp3 binding site on mouse CNS2 (mCNS2) and human CNS2 (hCNS2) with the consensus sites in human and mouse CTLA4 gene. (C) Binding of NFATc1 and NFATc2 to the putative NFAT binding element at CNS2. Wild-type and mutant IL-2 antigen receptor response elements (IL-2 ARRE) served as positive and negative controls, respectively. (D) Effects of deletion of the putative NFAT binding site on the activity of CNS2 in a luciferase reporter assay in mouse CD4+ T cells. (E) NFAT binding to Foxp3 promoter and CNS2 analyzed by ChIP in wild-type Tregs activated with Ionomycin in the presence or absence of CsA for 30 minutes. The Ctla4 and the Gmpr gene served as positive and negative controls, respectively. (F) NFATc1 and NFATc2 binding to CNS2 analyzed by ChIP in WT Tregs stimulated with Ionomycin. (G) Interaction of Foxp3 promoter with CNS2 and other locations within the Foxp3 locus in Tregs and Foxp3GFP conventional CD4 T cells (Tconv) from FG and KO mice measured by Chromosome Conformation Capture (3C) assay after cells were activated with Ionomycin for 30 min. (H) Interaction of CNS2 with Foxp3 promoter in wild-type Tregs measured by 3C assay after cells were activated with Ionomycin in the presence or absence of CsA for 30 min. (I and K) Nipbl (I) or Med12 (K) binding to Foxp3 promoter, CNS2, and other locations at the Foxp3 locus analyzed by ChIP in WT Tregs and Tconv cells stimulated with PMA and Ionomycin. (J and L) Foxp3GFP expression in FG and KO Tregs 3 days after cells were transduced with control (Ctrl) RNAi retroviral vector and RNAi vector targeting Nipbl (J) or Med12, (L). All data are representative of at least two experiments. Mean ± s.d. See also Figure S7 and Tables S2, S3, and S4.

Comment in

References

    1. Bailey-Bucktrout SL, Martinez-Llordella M, Zhou X, Anthony B, Rosenthal W, Luche H, Fehling HJ, Bluestone JA. Self-antigen-driven activation induces instability of regulatory T cells during an inflammatory autoimmune response. Immunity. 2013;39:949–962. - PMC - PubMed
    1. Bruno L, Mazzarella L, Hoogenkamp M, Hertweck A, Cobb BS, Sauer S, Hadjur S, Leleu M, Naoe Y, Telfer JC, et al. Runx proteins regulate Foxp3 expression. J Exp Med. 2009;206:2329–2337. - PMC - PubMed
    1. Burchill MA, Yang J, Vogtenhuber C, Blazar BR, Farrar MA. IL-2 receptor beta-dependent STAT5 activation is required for the development of Foxp3+ regulatory T cells. J Immunol. 2007;178:280–290. - PubMed
    1. Burzyn D, Kuswanto W, Kolodin D, Shadrach JL, Cerletti M, Jang Y, Sefik E, Tan TG, Wagers AJ, Benoist C, et al. A special population of regulatory T cells potentiates muscle repair. Cell. 2013;155:1282–1295. - PMC - PubMed
    1. Chaudhry A, Rudra D, Treuting P, Samstein RM, Liang Y, Kas A, Rudensky AY. CD4+ regulatory T cells control TH17 responses in a Stat3-dependent manner. Science. 2009;326:986–991. - PMC - PubMed

Publication types

MeSH terms

Substances

Associated data