. 2014 Aug 14;158(4):749-763.
doi: 10.1016/j.cell.2014.07.031.

Control of the inheritance of regulatory T cell identity by a cis element in the Foxp3 locus

Affiliations

Control of the inheritance of regulatory T cell identity by a cis element in the Foxp3 locus

Yongqiang Feng et al. Cell. .

Abstract

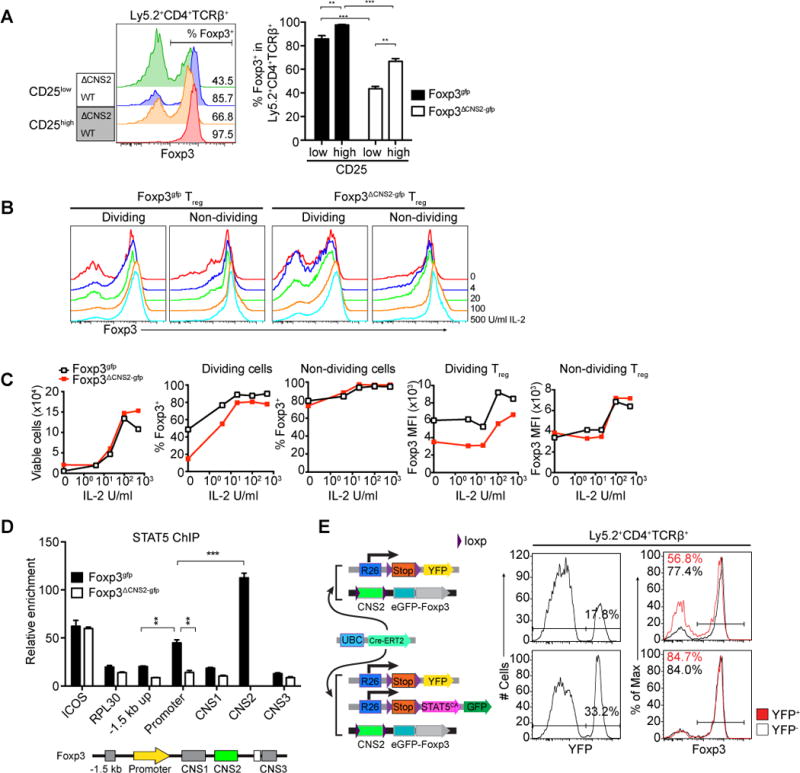
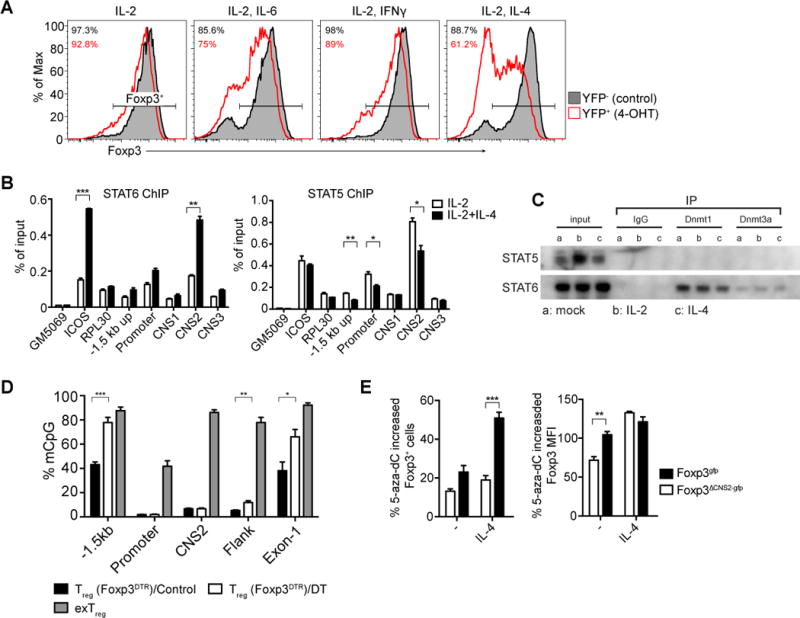
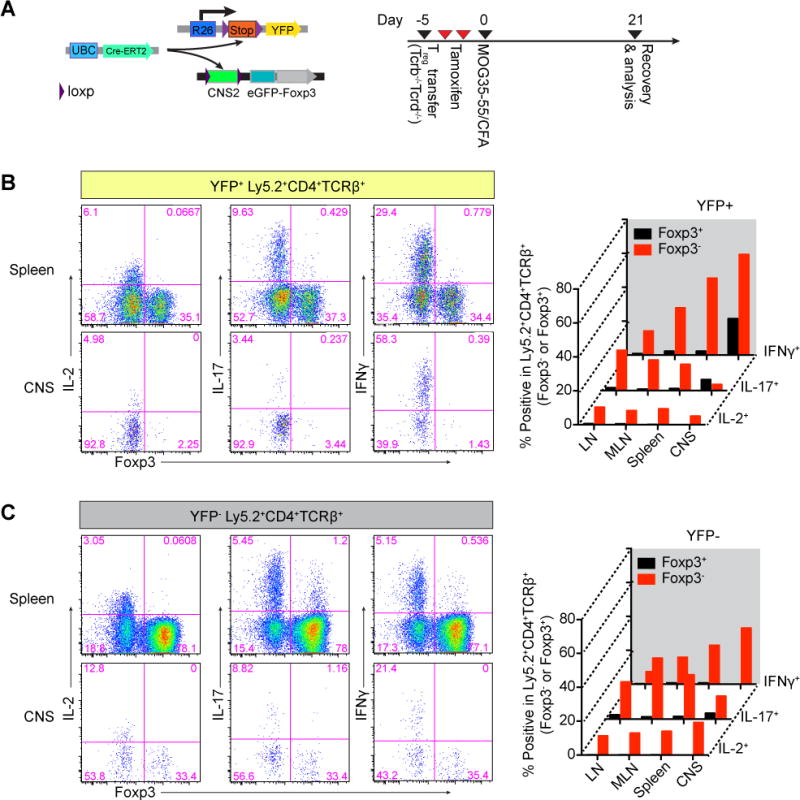
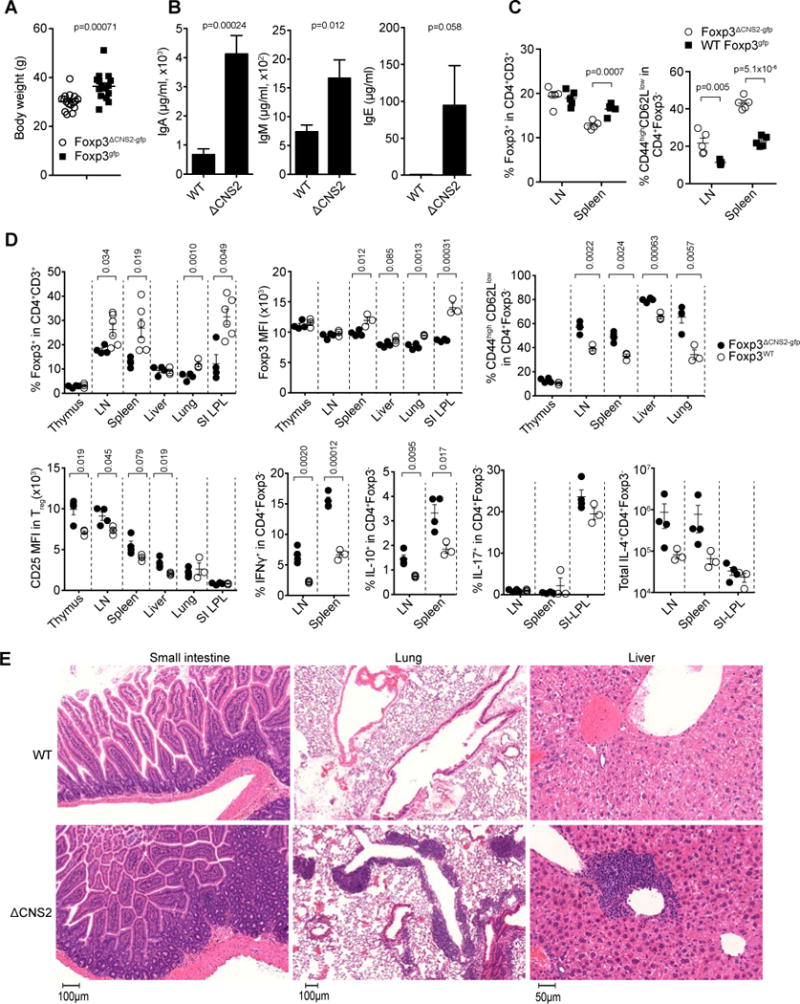
In multicellular organisms, specialized functions are delegated to distinct cell types whose identity and functional integrity are maintained upon challenge. However, little is known about the mechanisms enabling lineage inheritance and their biological implications. Regulatory T (Treg) cells, which express the transcription factor Foxp3, suppress fatal autoimmunity throughout the lifespan of animals. Here, we show that a dedicated Foxp3 intronic element CNS2 maintains Treg cell lineage identity by acting as a sensor of the essential Treg cell growth factor IL-2 and its downstream target STAT5. CNS2 sustains Foxp3 expression during division of mature Treg cells when IL-2 is limiting and counteracts proinflammatory cytokine signaling that leads to the loss of Foxp3. CNS2-mediated stable inheritance of Foxp3 expression is critical for adequate suppression of diverse types of chronic inflammation by Treg cells and prevents their differentiation into inflammatory effector cells. The described mechanism may represent a general principle of the inheritance of differentiated cell states.


Figures

Figure 1
Figure 1. CNS2 opposes cell cycle-dependent loss of Foxp3 expression in mature Treg cells
(A) Loss of Foxp3 expression during cell division. Highly purified Foxp3gfp Treg cells were labeled with CellTrace Violet and activated by CD3 and CD28 antibody-coated beads in the presence of 200U/ml IL-2 for 5 days. The data represent one of 3 independent experiments. (B) Blockage of cell division prevents loss of Foxp3 expression. Flow cytometric analysis of Foxp3 expression in Treg cells treated with indicated inhibitors in comparison to control non-dividing and dividing Treg cells. The data represent one of 3 independent experiments. (C) CpG methylation (mCpG) levels in the Foxp3 locus during Treg cell division in vitro and after loss of Foxp3 expression (exTreg) in vitro and in vivo. mCpG levels in biological replicate samples were averaged at each site of the Foxp3 locus from >5000 reads in naïve CD4+Foxp3 T cells (n=2), ex vivo isolated natural Treg (n=3), non-dividing (n=3) and dividing (n=3) Treg cells, in vitro exTreg (n=4) and in vivo exTreg (n=2) cells. Red dots represent individual CpG sites. Mean ± SEM; t-test comparisons of mCpG in non-dividing and dividing Treg cells are shown (see also Figure S1A–C). (D) CNS2 sustains heritable Foxp3 expression in dividing mature Treg cells. Highly purified Treg cells from Foxp3gfp and Foxp3ΔCNS2-gfp mice were co-cultured in the presence of CD3 and CD28 antibody-coated beads and 500U/ml IL-2 for 4–5 days. The data represent one of >4 independent experiments. Gating on CellTrace intensity is similar to (A). Mean ± SEM. (E) Similar gene expression profiles of CNS2-deficient and -sufficient resting Treg cells (rTreg). Poly-(A) RNA libraries were generated using FACS sorted CD44lowCD62high rTreg cells from male Foxp3gfp and Foxp3ΔCNS2-gfp littermates. Relative gene expression levels (cumulative fraction of genes) in CNS2-sufficient and -deficient rTreg cells were compared to those up- and -down regulated in GFP+ cells (“Treg wannabe’s”) from Foxp3gfpko/wt heterozygous females and wild type rTreg cells (n=3 each). The numbers of genes in each comparison group are indicated in parenthesis. (F) Acute deletion of CNS2 in mature Treg cells was induced upon tamoxifen treatment of Foxp3CNS2fl-gfp UBCCre-ERT2 R26Y male mice 7 days before the adoptive cell transfer. Treg (GFP+) cells were sorted by FACS and transferred together with allelically marked naïve CD4+Foxp3 T cells into T cell deficient hosts (Tcrb−/− Tcrd−/−). 7 weeks after transfer Foxp3 expression was analyzed and the remaining Foxp3+ (GFP+) Treg cells were purified by FACS, co-transferred with newly isolated naïve CD4+Foxp3 T cells into secondary Tcrb−/− Tcrd−/− recipients and Foxp3 expression was assessed 5 weeks later. (G) Flow cytometric analysis of Foxp3 expression before cell transfer and after recovery. Transferred YFP+ and YFP Treg cells were originally isolated from tamoxifen treated Foxp3CNS2fl-gfp UBCCre-ERT2 R26Y and Foxp3CNS2fl-gfp R26Y mice respectively. The data represent one of >3 independent experiments. See also Figure S1.
Figure 2
Figure 2. CNS2 sustains heritable Foxp3 expression in mature Treg cells in the presence of limiting amounts of IL-2
(A) The stability of Foxp3 expression is more sensitive to low levels of CD25 expression in CNS2-deficient Treg cells. Doubly sorted Ly5.2 CNS2-sufficient (Foxp3gfp) and -deficient (Foxp3ΔCNS2-gfp) Treg cells were cotransferred with Ly5.1 naïve CD4+Foxp3 T cells into T cell deficient Tcrb−/− Tcrd−/− mice and recovered for analysis 5 weeks later. CNS2-sufficient (n=5 per group), CNS2-deficient (n=3 per group). Mean ± SEM. (B, C) CNS2-deficient Treg cells are susceptible to low levels of IL-2. Treg cells were doubly sorted by FACS and activated with plate coated CD3 and CD28 antibodies in the presence of titrated amounts of IL-2 for 4 days. Foxp3 expression in the dividing (≥3 cell divisions) and non-dividing (<3 cell divisions) cells was monitored by flow cytometry. The data represent one of >3 independent experiments. (D) ChIP-qPCR analysis of STAT5 binding to the Foxp3 locus in CNS2-sufficient and -deficient Treg cells. In vitro expanded FACS purified Treg cells from Foxp3gfp or Foxp3ΔCNS2-gfp male mice were stimulated with 500U/ml IL-2 for 30 minutes. Relative enrichment was calculated by normalizing to background STAT5 binding to control region (GM5069). The data are shown as means ± SEMs of triplicates and represent one of three independent experiments. (E) Expression of hypermorphic STAT5 (STAT5CA) rescues unstable Foxp3 expression in CNS2-deficient Treg cells in vivo. Treg cells from Ly5.2 UBCCre-ERT2 R26Y Foxp3CNS2fl-gfp and UBCCre-ERT2 R26Y/ R26-Stopfl-STAT5CA Foxp3CNS2fl-gfp were doubly sorted by FACS and cotransferred with naive Ly5.1 CD4+Foxp3 T cells into Tcrb−/− Tcrd−/− mice. 4 weeks after tamoxifen gavage YFP+ or YFP Ly5.2+ CD4+TCRβ+ cells were isolated and analyzed for Foxp3 expression (6 mice per group). The data represent one of >3 independent experiments. See also Figure S2.
Figure 3
Figure 3. IL-2-STAT5-CNS2 axis stabilizes Foxp3 expression in the presence of pro-inflammatory cytokines
(A) Dividing Foxp3ΔCNS2-gfp Treg cells lose Foxp3 expression upon exposure to pro-inflammatory cytokines. Doubly sorted Treg cells from UBCCre-ERT2 R26Y Foxp3CNS2fl-gfp mice were activated in vitro with plate coated CD3 and CD28 antibodies in the presence of IL-2 (500U/ml) and pro-inflammatory cytokines. Deletion of CNS2 was induced upon treatment with 4-hydroxytamoxifen (4-OHT). Histograms show only the dividing cells (≥3 divisions). The data represent one of >3 independent experiments. (B) ChIP-qPCR analysis of STAT5 and STAT6 binding to the Foxp3 locus in in vitro expanded FACS purified Treg cells from Foxp3gfp mice and stimulated with IL-2 and IL-4 for 30 minutes. Relative enrichment was calculated by normalizing to the input of ChIP. The data are shown as means ± SEMs of triplicates and represent one of three independent experiments. (C) STAT6, but not STAT5 is associated with DNA methyltransferases. Dnmt1 and Dnmt3a co-precipitation with STAT5 and STAT6 was performed using nuclear extracts from in vitro expanded FACS purified Treg cells from Foxp3gfp mice as in (B). The data represent one of >3 independent experiments. (D) Elevated CpG methylation in the Foxp3 locus in Treg cells expanding under inflammatory conditions in vivo. Activated Treg cells were FACS purified from Foxp3DTR mice on day 10 after diphtheria toxin injection (see Extended Experimental Procedures). CpG methylation levels were averaged from >5000 reads in each site of the Foxp3 locus and compared to control Treg cells and ex vivo isolated exTreg cells (see also Figure S1B). The data represent 2 independent experiments. (E) Blockage of Dnmt activity with 5-aza-deoxycytidine (5-aza-dC) partially restores heritable Foxp3 expression in Treg cells exposed to IL-4. Doubly sorted Treg cells from Ly5.1 Foxp3gfp and Ly5.2 Foxp3ΔCNS2-gfp male mice were co-cultured with CD3 and CD28 antibody-coated beads for 7 days in the presence of 500 U/ml IL-2 with or without IL-4 or 0.1μM 5-aza-dC. Relative increases in the percentages of Foxp3+ cells and Foxp3 expression (MFI) on a per cell basis were calculated. The data represent one of >3 independent experiments. Mean ± SEM. See also Figure S3.
Figure 4
Figure 4. CNS2 dependent maintenance of heritable Foxp3 expression and Treg cell numbers in the steady state
(A) Schematic of the generation of mixed bone marrow chimeras. (B, C) Treg cell frequency and Foxp3 expression level in Ly5.1+ Foxp3gfp and Ly5.2+ Foxp3ΔCNS2-gfp cells in the thymus, spleen, lymph nodes (LN), mesenteric lymph nodes (MLN), Peyer’s patch (PP), small intestine lamina propria (SI-LPL), liver, lungs, and visceral adipose tissue (VA) of the mixed BM chimeras. Percentages of Ly5.1+ and Ly5.2+ cells in the reconstituted Treg (CD4+GFP+Foxp3+) cells were normalized based on the reconstitution efficiency of total Ly5.1+ and Ly5.2+ lymphocytes in the thymus. Mean ± SEM. n=9 per group; the data represent one of 3 independent experiments. (D) Correlation of Ki67 expression with the difference in Foxp3 MFI between CNS2-sufficient and -deficient Treg cells (spleen). (E) Reduced frequency of, and lower Foxp3 expression level in Foxp3ΔCNS2-gfp Treg cells in activated Treg cell population (CD44highCD62Llow). (F) CD25 expression level was correlated with the frequency of CNS2-deficient Treg cells in the mixed population and anti-correlated with the difference in Foxp3 expression level between CNS2-sufficient and -deficient Treg cells (spleen). See also Figure S4.
Figure 5
Figure 5. CNS2-dependent inheritance of Foxp3 expression prevents Treg cell conversion to effector cells
(A) Schematic of the experimental design. Treg cells doubly sorted from Ly5.2 Foxp3CNS2fl-gfp UBCCre-ERT2 R26Y male mice were cotransferred with Ly5.1 naïve CD4+Foxp3 T cells into Tcrb−/−Tcrd−/− recipients. Acute ablation of CNS2 was induced by tamoxifen gavage and 21 days after immunization with MOG35-55/CFA Ly5.2+CD4+TCRβ+ T cells were analyzed. (B, C) YFP+ and YFP of Ly5.2+CD4+TCRβ+ T cells were separated by FACS and stimulated with PMA and ionomycin and cytokine production of the cells was analyzed by flow cytometry. The data represent one of 3 independent experiments. CNS, combined infiltrated lymphocytes from the central nervous system (brains and spinal cords). See also Figure S5.
Figure 6
Figure 6. CNS2 dependent inheritance of Treg cell identity prevents spontaneous age dependent autoimmunity
(A) Diminished body weight of Foxp3ΔCNS2-gfp mice (~12 month old) in comparison to wild type littermates. WT 36.45 ± 1.37g, ΔCNS2 30.18 ± 0.88g. n=16 per group. (B) Serum Ig levels in Foxp3ΔCNS2-gfp and littermate control mice (~12 month old) determined by ELISA. WT n=6, Foxp3ΔCNS2-gfp n=4. (C) Frequencies of Treg cells and activated CD4+Foxp3 T cells (CD44highCD62Llow) in Foxp3ΔCNS2-gfp and control mice (~3 month old; n=5 per group). (D, E) Flow cytometric analyses of Foxp3 and CD25 expression, activation of, and cytokine production by CD4+ Foxp3 T cells and tissue histopathology in 12–15 month old Foxp3ΔCNS2-gfp mice. Data represent one of 2 or more independent experiment. Mean ± SEM.
Figure 7
Figure 7. CNS2 dependent maintenance of Foxp3 expression is critical for suppressing chronic inflammation
(A) Flow cytometric analysis of Foxp3 expression in CNS2-deficient Treg cells in the central nervous system after MOG immunization. Chimeric mice transferred with Ly5.1 Foxp3gfp and Ly5.2 Foxp3ΔCNS2-gfp BM (see also Figure 4A) were immunized with MOG35-55 in CFA and analyzed on day 14. Mean ± SEM, n=9. (B) Loss of CNS2 aggravates the chronic phase of EAE. Male Foxp3ΔCNS2-gfp and Foxp3gfp littermates were immunized with MOG35-55/CFA and their body weights and clinical disease scores were monitored. Mean + SEM. WT n=8, Foxp3ΔCNS2-gfp n=10. Data represent one of 3 independent experiments. (C) Analysis of Treg and activated effector CD4+Foxp3 T cells in Foxp3ΔCNS2-gfp and littermate control male mice on a high fat diet (HFD) and control diet (RD: regular diet). Mice were fed with HFD or RD for 10 weeks before the analysis. Data represent one of >3 independent experiments. Mean ± SEM. WT (RD) n=5, WT (HFD) n=8, Foxp3ΔCNS2-gfp (RD) n=5, Foxp3ΔCNS2-gfp (HFD) n=5. (D) Flow cytometric analysis of CD25highKi67 Treg cells in Foxp3ΔCNS2-gfp and littermate control mice on a HFD diet. (E) Body weight of Foxp3ΔCNS2-gfp and littermate control mice infected with LCMV clone 13 (p≤0.05). The data represent one of two independent experiments. Mean ± SEM. WT n=6, Foxp3ΔCNS2-gfp n=5. See also Figure S6 and S7.

References

    1. Arvey A, van der Veeken J, Samstein RM, Feng Y, Stamatoyannopoulos JA, Rudensky AY. Inflammation-induced repression of chromatin bound by the transcription factor Foxp3 in regulatory T cells. Nat Immunol. 2014;15:580–587. - PMC - PubMed
    1. Bailey-Bucktrout SL, Martinez-Llordella M, Zhou X, Anthony B, Rosenthal W, Luche H, Fehling HJ, Bluestone JA. Self-antigen-Driven Activation Induces Instability of Regulatory T Cells during an Inflammatory Autoimmune Response. Immunity. 2013;39:949–962. - PMC - PubMed
    1. Bettini ML, Pan F, Bettini M, Finkelstein D, Rehg JE, Floess S, Bell BD, Ziegler SF, Huehn J, Pardoll DM, et al. Loss of epigenetic modification driven by the foxp3 transcription factor leads to regulatory T cell insufficiency. Immunity. 2012;36:717–730. - PMC - PubMed
    1. Darce J, Rudra D, Li L, Nishio J, Cipolletta D, Rudensky AY, Mathis D, Benoist C. An N-Terminal Mutation of the Foxp3 Transcription Factor Alleviates Arthritis but Exacerbates Diabetes. Immunity 2012 - PMC - PubMed
    1. Feuerer M, Herrero L, Cipolletta D, Naaz A, Wong J, Nayer A, Lee J, Goldfine AB, Benoist C, Shoelson S, et al. Lean, but not obese, fat is enriched for a unique population of regulatory T cells that affect metabolic parameters. Nat Med. 2009;15:930–939. - PMC - PubMed

Publication types

Associated data