. 2014 Aug 14;158(4):808-821.
doi: 10.1016/j.cell.2014.06.025.

State-dependent architecture of thalamic reticular subnetworks

Affiliations

State-dependent architecture of thalamic reticular subnetworks

Michael M Halassa et al. Cell. .

Abstract

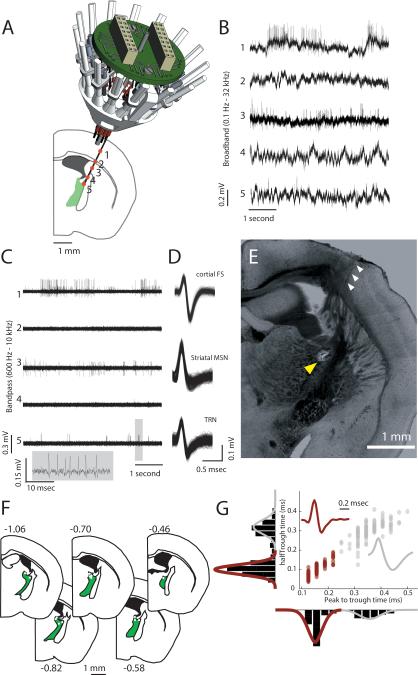
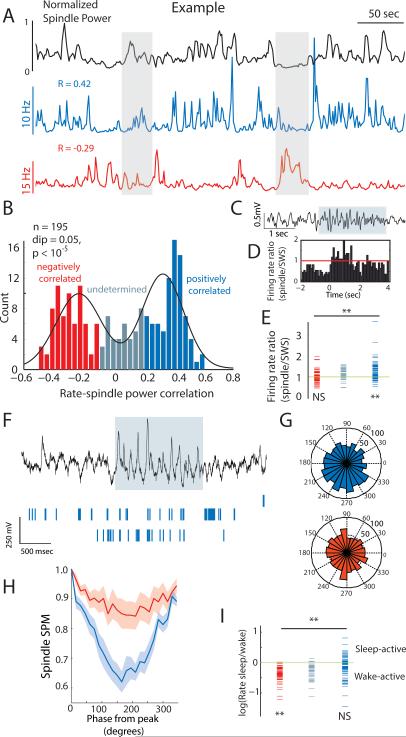
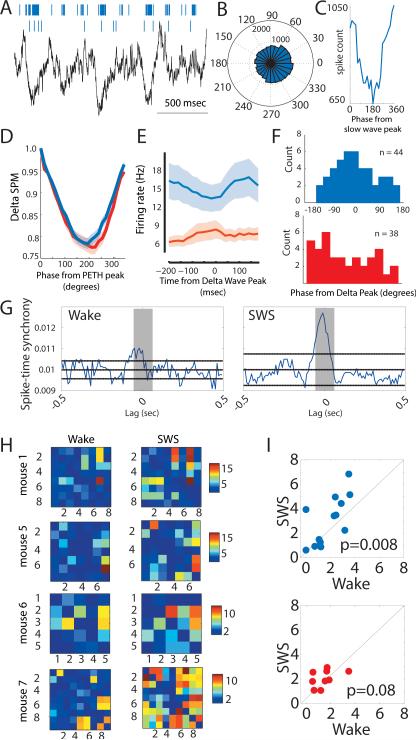
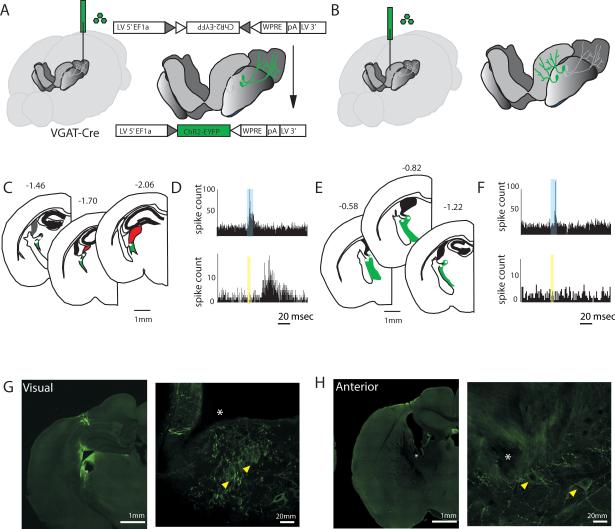
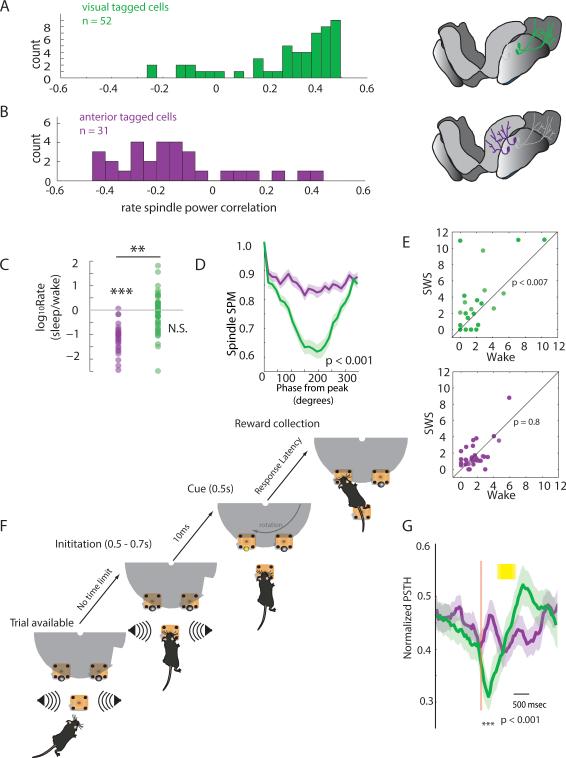
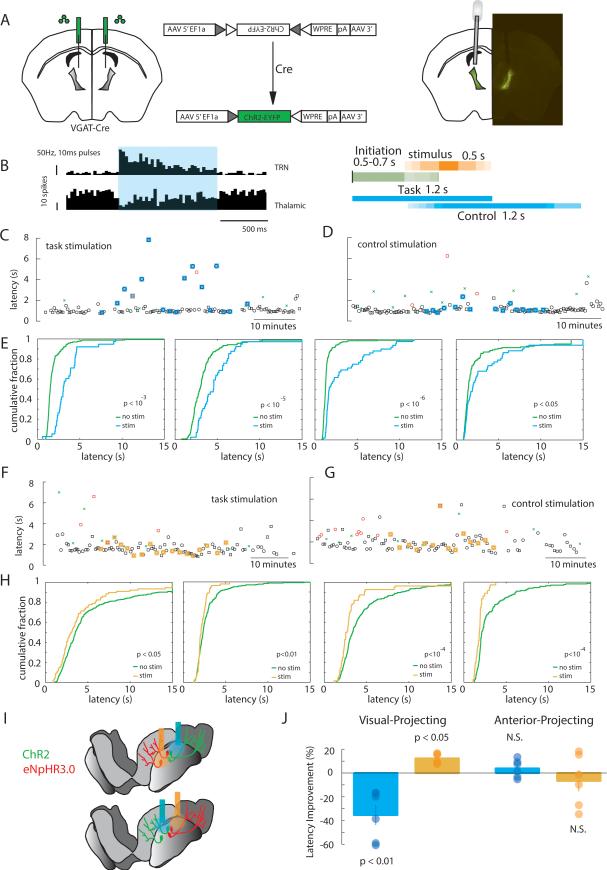
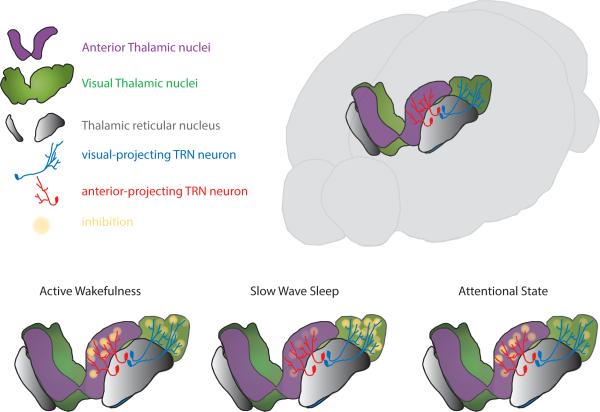
Behavioral state is known to influence interactions between thalamus and cortex, which are important for sensation, action, and cognition. The thalamic reticular nucleus (TRN) is hypothesized to regulate thalamo-cortical interactions, but the underlying functional architecture of this process and its state dependence are unknown. By combining the first TRN ensemble recording with psychophysics and connectivity-based optogenetic tagging, we found reticular circuits to be composed of distinct subnetworks. While activity of limbic-projecting TRN neurons positively correlates with arousal, sensory-projecting neurons participate in spindles and show elevated synchrony by slow waves during sleep. Sensory-projecting neurons are suppressed by attentional states, demonstrating that their gating of thalamo-cortical interactions is matched to behavioral state. Bidirectional manipulation of attentional performance was achieved through subnetwork-specific optogenetic stimulation. Together, our findings provide evidence for differential inhibition of thalamic nuclei across brain states, where the TRN separately controls external sensory and internal limbic processing facilitating normal cognitive function. PAPERFLICK:


Figures

Figure 1
Figure 1. Independently adjustable multi-electrode recordings in the TRN
(A) The dorsal part of TRN was targeted by implanting an independently adjustable multi-electrode implant (16 independently movable microdrives, only 6-12 loaded in any experiment) at 15-degree angle relative to midline. Numbers denote different anatomical structures at which physiological recordings were made and shown in B and C. (B) Broadband (0.1Hz-32kHz) signal recorded at the different anatomical stations show the physiological trajectory of the recordings. Note the absence of spiking in the two white matter crossings (corpus callosum, 2 and internal capsule, 4). (C) Bandpass filtered signal (600Hz-10kHz) of traces in B showing spike trains. (D) Clustered neurons from traces 1, 3 and 5 showing the waveforms of a putative cortical fast spiking interneuron (top), a striatal medium spiny neuron (middle) and finally a TRN neuron (bottom), highlighted inset shows a burst event of this unit, exhibiting the accelerando-decelerando burst structure previously described. (E) Histological verification of the recording by electrode track (white arrowheads) and lesion at the tip (yellow arrowheads). (F) Distribution of TRN lesions seen across 6 out of 7 mice recorded. Numbers denote A/P distance from Bregma in mm. (G) A total of 195 putative TRN units with “thin” spikes were recorded (crimson), which had significantly different spike waveform features (peak-to-trough time and trough halfwidth) than 102 putative thalamic units (red). See also Fig. S1.
Figure 2
Figure 2. Functional segregation of TRN sub-networks in SWS
(A) Two simultaneously recorded TRN neurons with time-varying firing rates that are positively and negatively correlated with cortical spindle power. (B) Bi-modal distribution (Hartigan's dip test, P < 10−5) of this correlation across the dataset (n =195 TRN neurons, 7 mice). Grey represents the undetermined group (Methods). (C) Example of a detected EEG spindle. (D) Peri-event time histogram (PETH) triggered by the onset of cortical spindles showing elevated firing rate of a positively-correlated neuron (determined by analysis similar to A) during spindle events. (E) This is significant across that population (P < 10−8, rank-sum test). (F) Two positively correlated (to spindle power, as in A) TRN neuronal spike trains in relation to a spindle event. (G) Spindle-phase histograms of two TRN neurons (red: negatively-correlated; blue: positively-correlated to spindle power, as in A). Note the higher phase locking for the positive-correlated neuron in this example. (H) Tendency for higher spindle phase-locking in these neurons as a group (weighted mean ± SEM, rank-sum test: P = 0.05 at the point of maximum modulation). (I) Negatively-correlated neurons are wake active (P < 0.01, rank-sum test), while positively-correlated neurons are state-indifferent (P< 0.0001). See also Fig. S2 and table S1.
Figure 3
Figure 3. Enhanced synchrony of SC neurons during SWS
(A) During SWS, SC neuronal spiking occurs near cortical slow wave troughs. (B-C) Spike delta phase-histogram of a SC neuron shows reduction of firing near the slow wave peaks. (D) As a population, SC neurons exhibit comparable delta phase-locking to AC neurons (shaded area denotes the group SEM), shown in the depth of their spike-phase modulation (SPM). (E) Delta wave peak-aligned PETH of the SC population (blue trace) shows stronger phase-alignment to cortical delta oscillations than the AC population (red trace). Shaded area is SEM. (F) Finding in E is further supported by plotting the histogram of the phase values (relative to delta wave peak) at which significantly modulated neurons exhibit minimum spike count. These distributions are significantly different (two-sample Kolmogorov-Smirnov test, P < 0.03). Note the peak in the SC neurons histogram, showing that these neurons exhibit little spiking around the peaks of delta oscillations. (G) Example of spike-time synchrony between two SC neurons (shaded area: [−50, 50] ms centered at zero lag) showing increased synchrony in SWS. (H) Spike-time synchrony (converted to Z-score related to baseline) seen at the ensemble level (examples from four mice). Note the consistent overall elevation of spike-time synchrony among SC units (mouse 1: n=8; mouse 5: n=7; mouse 6: n=5; mouse 7: n=9) during SWS compared to wakefulness. (I) Group analysis of these ensembles (SC: n = 13 ensembles from 4 mice, upper panel; AC: n = 9 ensembles from 4 mice, lower panel) shows an increase in SC sub-network synchrony during SWS. Color bar: Z-score. P-values: signed-rank test. See also Fig. S3.
Figure 4
Figure 4. Optogenetic tagging of TRN neurons based on their thalamic targets
(A) Cartoon depiction of optogenetic tagging of visually-connected TRN neurons in mice. A retrograde lentivirus containing a Cre-dependent ChR2-EYFP is injected into the visual thalamus of a VGATCre mouse. 2-4 weeks later, ChR2 is robustly expressed in visually-connected TRN. (B) Tagging of anterior complex-connected TRN, similar procedure to A. (C) Sections showing extracellular recording targets for visually-connected TRN (n = 3 mice). (D) Peri-stimulus time histograms (PSTHs) from two visual tagged TRN neurons, showing optogenetic drive with short-latency responses (top) and visual drive with longer latency responses (bottom). (E-F) Similar depictions as in C-D, but for anterior complex-projecting neurons. (G) Example brain sections showing electrolytic lesions of electrode tips for visually-connected TRN preparation. Confocal image on the right show electrode tips (white asterisk) near neurons expressing ChR2-EYFP (yellow arrowheads). (H) Similar figures to G, but for anterior complex-tagged TRN neurons.
Figure 5
Figure 5. Intact TRN microcircuit dissection connects form to function
(A) Visual tagged neurons are positively correlated to cortical spindle power in SWS (P<10−8, signed-rank test), but (B) anterior tagged neurons are negatively correlated (P=0.006). (C) Anterior tagged neurons are wake active, while visual tagged neurons are state-indifferent. (D) Visual tagged neurons show stronger phase-locking to spindle oscillations (P<0.001, rank-sum test at the trough). (E) Visual-, but not anterior-, tagged neurons exhibit enhanced pair-wise spike-time synchrony in SWS (P-values: signed-rank test, numbers of axes denote Z-scores). (F) Visual detection task design ensures control over psychophysical parameters. The mouse is informed of a new trial by a white noise stimulus emitted from two side speakers. To initiate a trial, the mouse is required to hold its snout in a nose-poke for a period of 0.5-0.7s, ensuring that when the 0.5s stimulus is presented at one of the reward nose-pokes, the head is in the correct orientation to see it. The rotating disk ensures that the reward sites are only available following the stimulus, minimizing impulsive poking behavior. (G) Only visual tagged neurons show a reduction in firing rate (group mean ± SEM; P< 0.001, rank-sum test) during the attentional window of the visual detection task (yellow bar: stimulus). See also table S2.
Figure 6
Figure 6. Bi-directional manipulation of cognitive performance by selective TRN targeting
(A) Schematic showing strategy for rendering the TRN optically sensitive. The TRN of a VGAT-Cre mouse is bilaterally injected with an AAV containing a double floxed optogenetic molecule cassette (in this example ChR2-EYFP), which is flipped into frame only in Cre-expressing neurons. Because thalamic relay nuclei are largely devoid of VGAT expressing neurons (except for LGN, which is sufficiently far away from the injection site), ChR2-EYFP expression is limited to the TRN. A similar strategy is used for eNpHR3.0-EYFP experiments (F-H). (B, left) Two PSTHs of a TRN unit and a thalamic unit in response to a 50Hz laser stimulus (2ms pulse duration, 1s duration), showing broad elevation in spiking for the TRN unit and broad suppression of spiking in the thalamic unit. (B, right) Timeline of optogenetic stimulation regimes in relation to task phases. The same strategy is adopted for optogenetic inhibition. (C-D) Examples of a selective TRN stimulation session carried out during all task phases (C) or avoiding the initiation phase, but of similar length, ‘control stimulation’ (D). Note the increased number of long-latency trials in the task stimulation but not the control one (Black circle: left correct trial, Black square: right correct trial, Red circle: left incorrect trial, Red square: right incorrect trial, Green cross: catch trials, laser trials are highlighted in blue). (F) Cumulative distribution of trial latencies (to collect reward) from individual mice, showing diminished performance following TRN activation during the task in all four mice. (F-G) Example sessions for eNpHR3.0-mediated TRN inhibition as in (CD). (H) Cumulative distribution of trial latencies from individual mice in response to TRN inhibition in the task, showing the opposite behavioral effect to stimulation. (I) Set-up for subnetwork specific optogenetic manipulations. (J) Optogenetic activation and inhibition of TRN sub-network projecting to visual thalamus diminishes and enhances performance respectively, while similar manipulations of the anterior projecting TRN have an opposite but non-significant effect (n = 6 sessions, 2 mice for each manipulation, P-values: signed-rank test). See also Fig. S6, Movies S1 and S2.
Figure 7
Figure 7. Cartoon depiction of state-dependent thalamic inhibition
During active wakefulness inhibition in sensory and limbic thalamic nuclei is balanced. As the brain transitions to SWS, synchrony among sensory TRN neurons results in enhanced inhibition of sensory thalamic nuclei contributing to gating of external input. The reduction in firing rate of limbic-connected neurons is likely to result in reduced inhibition in limbic thalamus, perhaps facilitating offline processing. During attentional states, sensory neuronal firing rate is reduced, contributing to enhanced sensory thalamic engagement in processing of external stimuli. Although limbic thalamic neurons do not show an overall change in firing rate during these states, individual neurons may participate in shaping limbic processing during these states.

References

    1. Barch DM, Ceaser A. Cognition in schizophrenia: core psychological and neural mechanisms. Trends Cogn Sci. 2012;16:27–34. - PMC - PubMed
    1. Bargmann CI, Marder E. From the connectome to brain function. Nat Methods. 2013;10:483–490. - PubMed
    1. Bazhenov M, Timofeev I, Steriade M, Sejnowski T. Spiking-bursting activity in the thalamic reticular nucleus initiates sequences of spindle oscillations in thalamic networks. J Neurophysiol. 2000;84:1076–1087. - PubMed
    1. Boyden ES, Zhang F, Bamberg E, Nagel G, Deisseroth K. Millisecond-timescale, genetically targeted optical control of neural activity. Nat Neurosci. 2005;8:1263–1268. - PubMed
    1. Briggs F, Mangun GR, Usrey WM. Attention enhances synaptic efficacy and the signal-to-noise ratio in neural circuits. Nature. 2013;499:476–480. - PMC - PubMed

Publication types

LinkOut - more resources