. 2014 Aug 14;158(4):903-915.
doi: 10.1016/j.cell.2014.07.020.

CellNet: network biology applied to stem cell engineering

Affiliations

CellNet: network biology applied to stem cell engineering

Patrick Cahan et al. Cell. .

Abstract

Somatic cell reprogramming, directed differentiation of pluripotent stem cells, and direct conversions between differentiated cell lineages represent powerful approaches to engineer cells for research and regenerative medicine. We have developed CellNet, a network biology platform that more accurately assesses the fidelity of cellular engineering than existing methodologies and generates hypotheses for improving cell derivations. Analyzing expression data from 56 published reports, we found that cells derived via directed differentiation more closely resemble their in vivo counterparts than products of direct conversion, as reflected by the establishment of target cell-type gene regulatory networks (GRNs). Furthermore, we discovered that directly converted cells fail to adequately silence expression programs of the starting population and that the establishment of unintended GRNs is common to virtually every cellular engineering paradigm. CellNet provides a platform for quantifying how closely engineered cell populations resemble their target cell type and a rational strategy to guide enhanced cellular engineering.


Figures

Figure 1
Figure 1
Construction and validation of CellNet. (A) CellNet was designed to analyze gene expression profiles of mouse and human cell populations engineered by reprogramming to pluripotency, by direct conversion among somatic cell types, or by directed differentiation of pluripotent stem cells. CellNet can perform three types of analysis. First, CellNet calculates the probability that query samples express C/T-specific GRN genes to an extent that is indistinguishable from each cell and tissue type in the training data set. Second, CellNet measures the extent to which C/T GRNs are established in query samples relative to the corresponding C/T in the training data. Third, CellNet scores transcriptional regulators according to the likelihood that changing their expression will result in improved GRN establishment. (B) CellNet is based on C/T specific GRNs. C/T specific GRNs were determined by first reconstructing a single GRN from a diverse panel of cell types and tissues and perturbations (i). Second, lower performing edges from the GRN were removed based on a comparison to a set of Gold Standard of regulatory relationships (ii). Finally, C/T specific GRNs were identified by splitting the GRN into densely interconnected sub-networks (iii) followed by attribution to C/Ts based on gene set enrichment analysis (iv).(C) Classification heatmap of an independent mouse validation data set. Binary classifiers were trained for each C/T using the C/T specific GRN genes as predictors. Each row represents a C/T classifier, and each column represents a validation array. Higher classification scores indicate a higher probability that a query sample expresses the C/T GRN genes at a level indistinguishable from the same C/T in the training data. (Right) The sensitivity to accurately determine the source of the validation samples at a false positive rate <= 5%. (D) Precision and sensitivity curves of CellNet (blue) and hierarchical clustering (red) based C/T classifiers on the validation data set. Precision is the number of true positives divided by the number of positive calls. Sensitivity is the number of true positives divided by the sum of the true positives and false negatives. Shown are the average of all mouse C/T classifiers computed across a range of classification scores (left to right). (E) Using a gene expression profile to quantify GRN establishment or status. CellNet compares the expression of C/T GRN genes in the query sample to the distributions of gene expression in the C/T based on the training data and integrates this information with the importance of each gene to the classifier and the connectivity of each gene to arrive at GRN status, which is normalized to the GRN status of the C/T in the training data. (F) Combining gene expression with GRNs to prioritize transcriptional regulators to improve cellular engineering. Given a query gene expression profile and a selected target C/T, CellNet computes a network influence score, which scores each transcriptional regulator based on it’s number of target genes, and extent of dysregulation of target genes and the regulator, weighted by the expression of the regulator in the C/T. See Figure S1.
Figure 2
Figure 2
CellNet analysis of purified primary, and cultured cells. Cell and tissue classification (A) and heart C/T GRN status (B) of primary neonatal cardiomyocytes in which RNA was harvested directly after aMHC-GFP positive cells were purified by FACS. Classification (C) and neuron GRN status (D) of dissected dorsal root (DRG), trigeminal (Tri), and no dose ganglia nociceptor neurons purified on the basis of Nav1.8 expression. Classification (E) and neuron GRN status (F) of laser capture micro-dissected human dopaminergic (DA) neurons. Classification (G) and liver GRN status (H) of primary hepatocytes cultured for 2–3 days. (I) Cell and tissue characterization of cortical neurons cultured for 7–8 days. Cultured neurons are classified primarily as neurons and secondarily as glia, similar to the the validation neuron data in Fig. 1B. (J) Neuron C/T GRN establishment levels of cultured primary neurons. In all figures, dark blue bars represent the GRN status for the indicated C/T GRN in the training data, light blue represents the GRN status for the indicated C/T GRN in the query samples, and bars are standard deviations. See Figure S2.
Figure 3
Figure 3
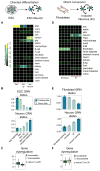
CellNet analysis of engineered mouse neurons. (A) C/T classification heatmap of the starting cell population (esc), intermediate neural progenitors (esc-np), and esc-derived neurons (esc-neuron). (B) ESC (top) and neuron (bottom) GRN status in ESC, esc-np, and esc-neurons compared to GRN status of training ESC and neuron data. (C) Z-scores of neural genes in esc-neurons. ‘Accessible’ indicates genes with promoters that are DNAse hypersensitive, whereas ‘Inaccessible’ indicates genes with promoters that are not DNAse hypersensitive. (D) C/T classification heatmap of the starting cell population (fibroblasts) and induced neurons (iN). (E) Fibroblast (top) and neuron (bottom) GRN status in fibroblasts and iNs compared to GRN status of training fibroblast and neuron data. (F) Z-scores of neural genes in iNs. See Figure S3.
Figure 4
Figure 4
CellNet analysis of engineered mouse cardiomyocytes. (A) C/T classification heatmap of a time course of directed differentiation of ESC to cardiomyocytes. Cardiac progenitor cells (CPC), ESC-derived cardiomyocytes at 3 weeks of differentiation (ESC-CM). (B) ESC (top) and heart (bottom) GRN status in CPC and ESC-CMs compared to GRN status of training ESC and heart data. (C) Z-scores of heart genes in ESC-CMs. ‘Accessible’ indicates genes with promoters that are DNAse hypersensitive, whereas ‘Inaccessible’ indicates genes with promoters that are not DNAse hypersensitive. (D) Classification heatmap of the starting cell population (fibroblasts), and iCMs two and four weeks after ectopic expression of transgenes. (E) Fibroblast (top) and heart (bottom) GRN status in fibroblasts and iCMs compared to GRN status of training fibroblast and heart data. (F) Z-scores of heart genes in iCMs. (G) Classification heatmap of iCMs induced in vivo (iv-iCMs). (H) Fibroblast (top) and heart (bottom) GRN status in fibroblasts and iv-iCMs compared to GRN status of training fibroblast and heart data. (I) Z-scores of heart genes in iv-iCMs. See Figure S4.
Figure 5
Figure 5
CellNet analysis of 56 distinct cell engineering studies. CellNet classification score of target cell or tissue type in mouse (A) and human (B) cell engineering experiments. Only the most terminal (i.e. fully reprogrammed, or last time points of differentiation or conversion) samples profiled are included. See Figure S5.

Comment in

References

    1. Aasen T, Raya A, Barrero MJ, Garreta E, Consiglio A, Gonzalez F, Vassena R, Bilic J, Pekarik V, Tiscornia G, et al. Efficient and rapid generation of induced pluripotent stem cells from human keratinocytes. Nat Biotechnol. 2008;26:1276–1284. - PubMed
    1. Arnold P, Schöler A, Pachkov M, Balwierz PJ, Jørgensen H, Stadler MB, van Nimwegen E, Schübeler D. Modeling of epigenome dynamics identifies transcription factors that mediate Polycomb targeting. Genome Research. 2013;23:60–73. - PMC - PubMed
    1. Breiman L. Random Forests. Machine Learning. 2001;45:5–32.
    1. Cahan P, Daley GQ. Origins and implications of pluripotent stem cell variability and heterogeneity. Nature Reviews Molecular Cell Biology 2013 - PMC - PubMed
    1. Caiazzo M, Dell’Anno MT, Dvoretskova E, Lazarevic D, Taverna S, Leo D, Sotnikova TD, Menegon A, Roncaglia P, Colciago G, et al. Direct generation of functional dopaminergic neurons from mouse and human fibroblasts. Nature. 2011;476:224–227. - PubMed

Publication types