. 2014 Aug 15;9(8):e104540.
doi: 10.1371/journal.pone.0104540. eCollection 2014.

Determination of critical nitrogen dilution curve based on stem dry matter in rice

Affiliations

Determination of critical nitrogen dilution curve based on stem dry matter in rice

Syed Tahir Ata-Ul-Karim et al. PLoS One. .

Abstract

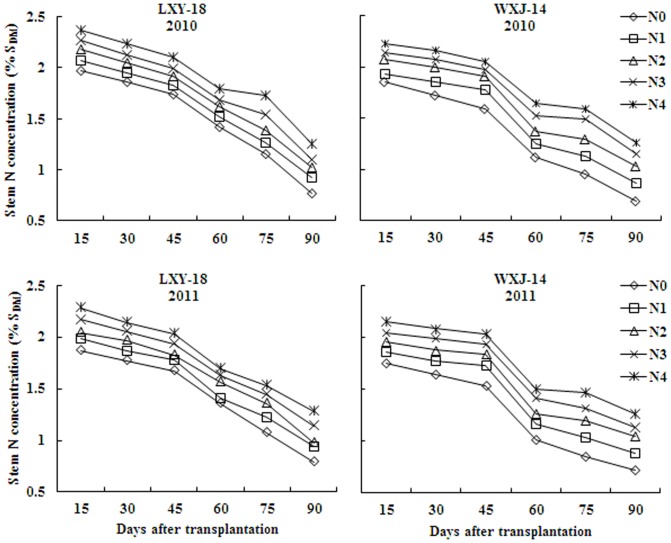
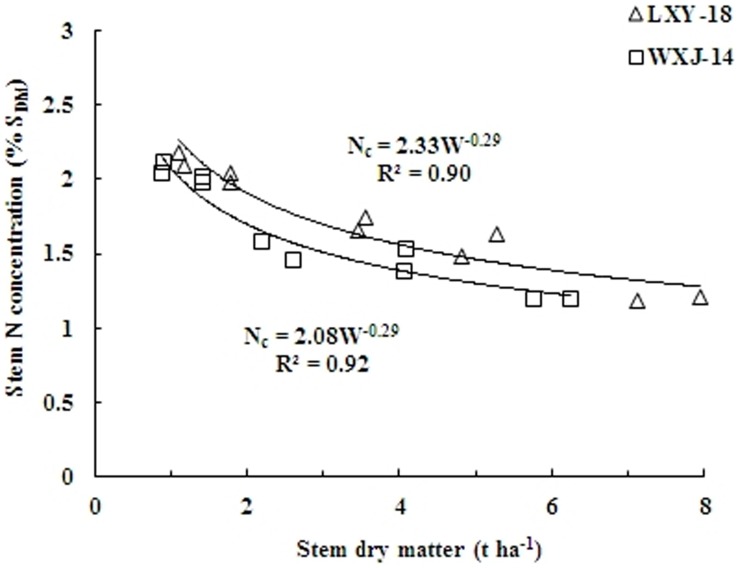
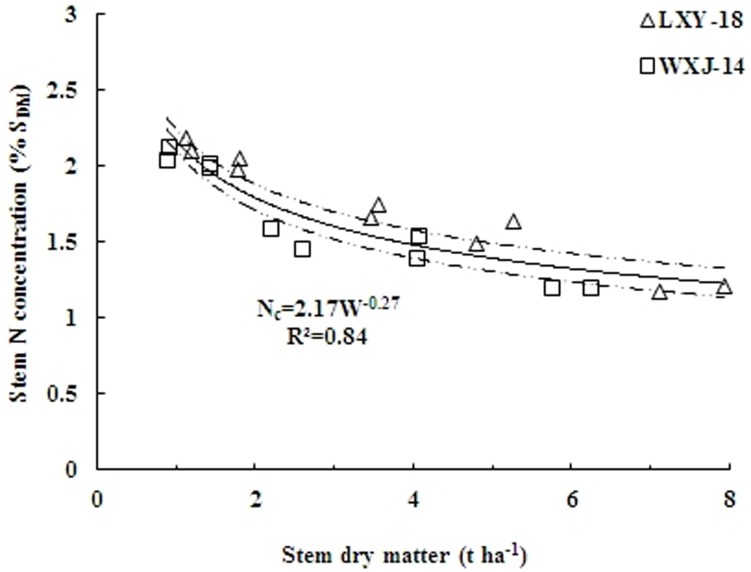
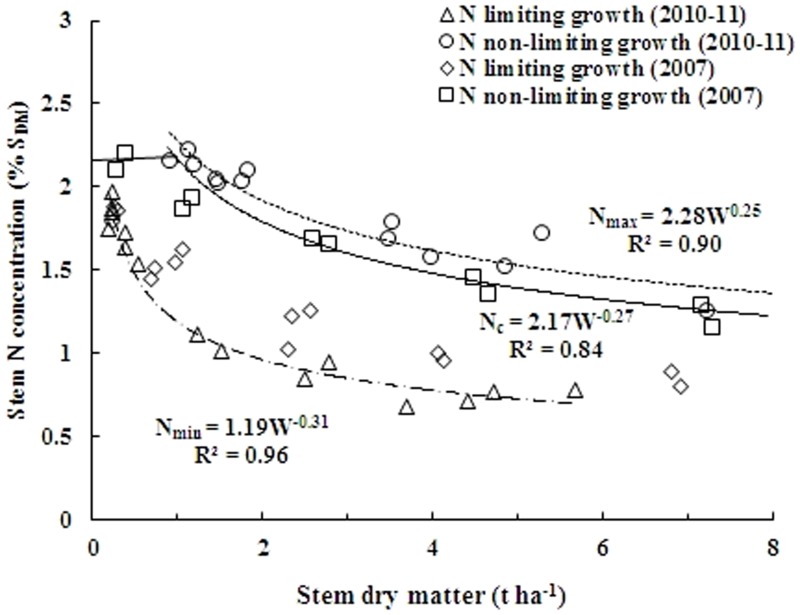
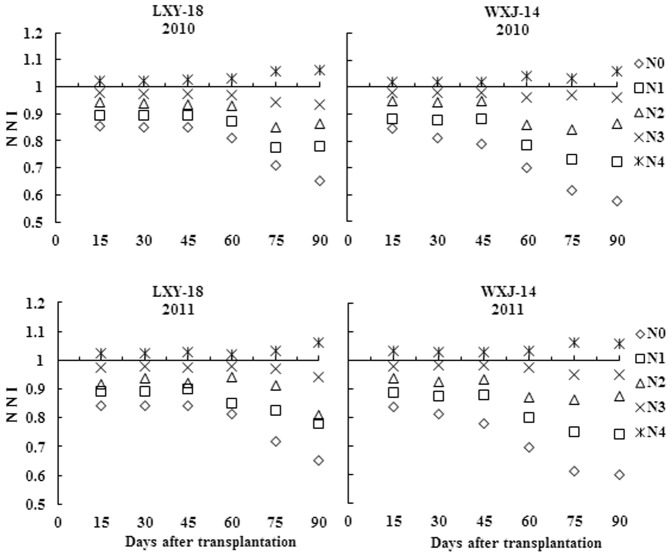
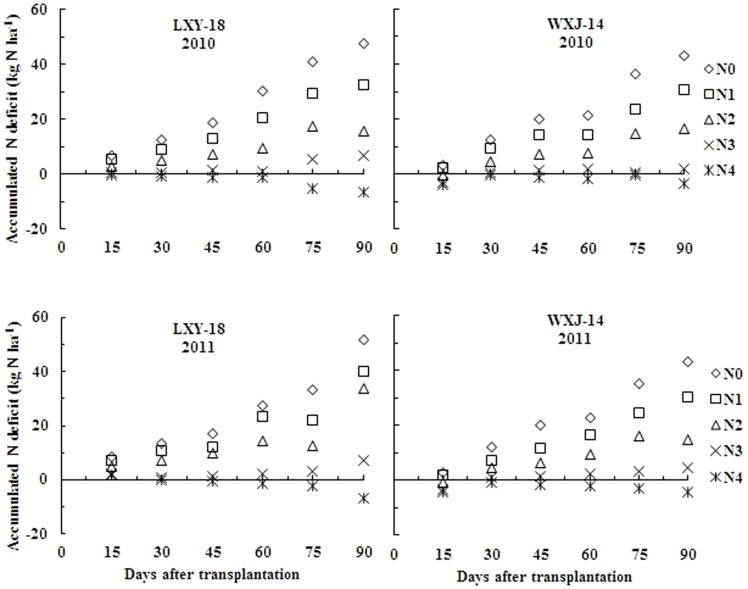
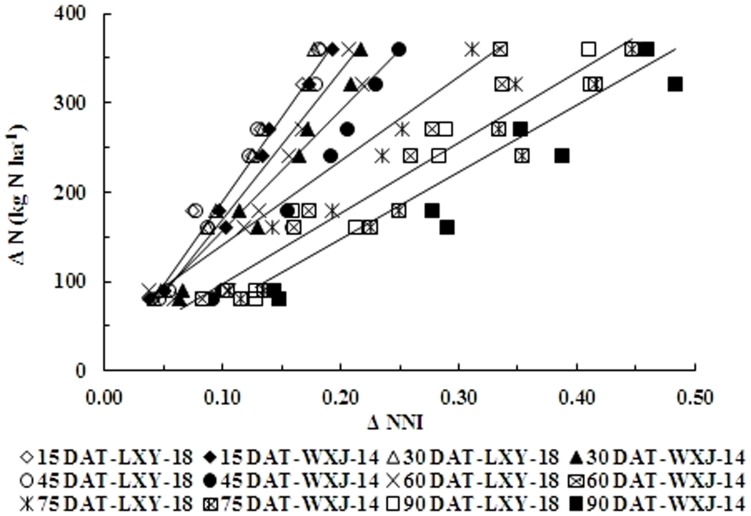
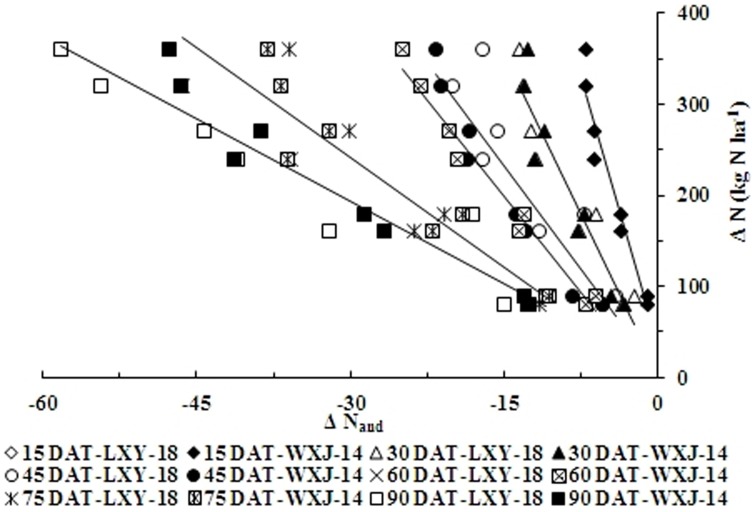
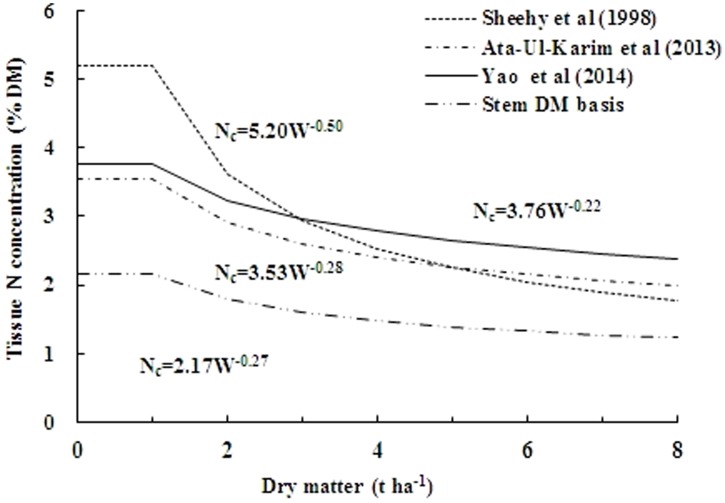
Plant analysis is a very promising diagnostic tool for assessment of crop nitrogen (N) requirements in perspectives of cost effective and environment friendly agriculture. Diagnosing N nutritional status of rice crop through plant analysis will give insights into optimizing N requirements of future crops. The present study was aimed to develop a new methodology for determining the critical nitrogen (Nc) dilution curve based on stem dry matter (SDM) and to assess its suitability to estimate the level of N nutrition for rice (Oryza sativa L.) in east China. Three field experiments with varied N rates (0-360 kg N ha(-1)) using three Japonica rice hybrids, Lingxiangyou-18, Wuxiangjing-14 and Wuyunjing were conducted in Jiangsu province of east China. SDM and stem N concentration (SNC) were determined during vegetative stage for growth analysis. A Nc dilution curve based on SDM was described by the equation (Nc = 2.17W(-0.27) with W being SDM in t ha(-1)), when SDM ranged from 0.88 to 7.94 t ha(-1). However, for SDM < 0.88 t ha(-1), the constant critical value Nc = 1.76% SDM was applied. The curve was dually validated for N-limiting and non-N-limiting growth conditions. The N nutrition index (NNI) and accumulated N deficit (Nand) of stem ranged from 0.57 to 1.06 and 51.1 to -7.07 kg N ha(-1), respectively, during key growth stages under varied N rates in 2010 and 2011. The values of ΔN derived from either NNI or Nand could be used as references for N dressing management during rice growth. Our results demonstrated that the present curve well differentiated the conditions of limiting and non-limiting N nutrition in rice crop. The SDM based Nc dilution curve can be adopted as an alternate and novel approach for evaluating plant N status to support N fertilization decision during the vegetative growth of Japonica rice in east China.


Conflict of interest statement

Competing Interests: The authors have declared that no competing interests exist.

Figures

Figure 1
Figure 1. Changes of stem nitrogen concentration (% SDM) with time (days after transplantation) for rice under different N rates in experiments conducted during 2010 and 2011.
Figure 2
Figure 2. Critical nitrogen data points and Nc dilution curves in stem obtained by non-linear fitting for two rice cultivars (LXY-18, Nc = 2.33W−0.29 and WXJ-14, Nc = 2.08W−0.29) under different N rates in experiments conducted during 2010 and 2011.
Figure 3
Figure 3. Critical nitrogen data points used to define the Nc dilution curve when data were pooled over for two rice cultivars (LXY-18 and WXJ-14).
The solid line represents the Nc dilution curve (Nc = 2.17W−0.27; R2 = 0.84) describing the relationship between the Nc and stem dry matter of rice. The dotted lines represent the confidence band (P = 0.95).
Figure 4
Figure 4. Comprehensive validation of Nc dilution curve using independent data set from experiment conducted in 2007.
Data points (◊) represent N limiting growth conditions, while (□) represent N non-limiting conditions. The solid line in the middle represents the Nc curve (Nc = 2.17W−0.27) describing the relationship between the Nc and stem dry matter of rice. The data points (Δ) and (○) not engaged for establishing the parameters of allometric function (2010 and 2011) were used to develop two boundary curves, (–•–•–•) minimum limit curve (Nmin = 1.19 W−0.31) and (------) maximum limit curve (Nmax = 2.27W−0.25).
Figure 5
Figure 5. Changes of nitrogen nutrition index (NNI) with time (days after transplantation) for rice stem under different N rates in experiments conducted during 2010 and 2011.
Figure 6
Figure 6. Changes of accumulated N deficit (Nand) with time (days after transplantation) for rice stem under different N rates in experiments conducted during 2010 and 2011.
Figure 7
Figure 7. Relationship between changes of nitrogen nutrition index (ΔNNI) and changes of nitrogen application rates (ΔN, kg N ha−1) at different growth stages in experiments conducted during 2010 and 2011.
The open symbols represent different growth stages for LXY-18 while filled symbols represent different growth stages for WXJ-14. (ΔN = A×ΔNNI+B; A = −16.60×DAT+2101, R2 = 0.95; B = −0.024×DAT2+2.57×DAT−40.07, R2 = 0.62).
Figure 8
Figure 8. Relationship between changes of accumulated N deficit (ΔNand) and changes of nitrogen application rates (ΔN, kg N ha−1) at different growth stages in experiments conducted during 2010 and 2011.
The open symbols represent different growth stages for LXY-18 while filled symbols represent different growth stages for WXJ-14 (ΔN = C×ΔNand+D; C = 18.97 ln(DAT)-89.22, R2 = 0.98 and D = −9.98 ln(DAT)+52.76, R2 = 0.19), respectively.
Figure 9
Figure 9. Comparison of different Nc dilution curves.
The (------) represents the Nc dilution curve of Sheehy et al. (1998) (Nc = 5.20W−0.50) on plant dry matter basis in Indica rice under tropic environment. The (–•–•–•) represents the Nc dilution curve of Ata-Ul-Karim et al. (2013) (Nc = 3.53W−0.28) on plant dry matter basis in Japonica rice in Yangtze River Reaches. The (——) line represents Nc dilution curve of Yao et al. (2014) (Nc = 3.76W−0.22) on leaf dry matter basis in Japonica rice in Yangtze River Reaches, and the (–••–••–) line represents Nc dilution curve on stem dry matter basis in present study (Nc = 2.17W−0.27).

References

    1. Jaggard K, Qi A, Armstrong M (2009) A meta-analysis of sugarbeet yield responses to nitrogen fertilizer measured in England since 1980. J Agric Sci-(Camb) 147: 287–301.
    1. Ghosh M, Mandal B, Mandal B, Lodh S, Dash A (2004) The effect of planting date and nitrogen management on yield and quality of aromatic rice (Oryza sativa). J Agric Sci-(Camb) 142: 183–191.
    1. Cabangon R, Castillo E, Tuong T (2011) Chlorophyll meter-based nitrogen management of rice grown under alternate wetting and drying irrigation. Field Crops Res 121: 136–146.
    1. Lin FF, Qiu LF, Deng JS, Shi YY, Chen LS, et al. (2010) Investigation of SPAD meter-based indices for estimating rice nitrogen status. Compu Electron Agric 71: S60–S65.
    1. Confalonieri R, Debellini C, Pirondini M, Possenti P, Bergamini L, et al. (2011) A new approach for determining rice critical nitrogen concentration. J Agric Sci-(Camb) 149: 633–638.

Publication types