Quantifying age-related rates of social contact using diaries in a rural coastal population of Kenya
- PMID: 25127257
- PMCID: PMC4134222
- DOI: 10.1371/journal.pone.0104786
Quantifying age-related rates of social contact using diaries in a rural coastal population of Kenya
Abstract
Background: Improved understanding and quantification of social contact patterns that govern the transmission dynamics of respiratory viral infections has utility in the design of preventative and control measures such as vaccination and social distancing. The objective of this study was to quantify an age-specific matrix of contact rates for a predominantly rural low-income population that would support transmission dynamic modeling of respiratory viruses.
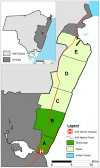
Methods and findings: From the population register of the Kilifi Health and Demographic Surveillance System, coastal Kenya, 150 individuals per age group (<1, 1-5, 6-15, 16-19, 20-49, 50 and above, in years) were selected by stratified random sampling and requested to complete a day long paper diary of physical contacts (e.g. touch or embrace). The sample was stratified by residence (rural-to-semiurban), month (August 2011 to January 2012, spanning seasonal changes in socio-cultural activities), and day of week. Usable diary responses were obtained from 568 individuals (∼50% of expected). The mean number of contacts per person per day was 17.7 (95% CI 16.7-18.7). Infants reported the lowest contact rates (mean 13.9, 95% CI 12.1-15.7), while primary school students (6-15 years) reported the highest (mean 20.1, 95% CI 18.0-22.2). Rates of contact were higher within groups of similar age (assortative), particularly within the primary school students and adults (20-49 years). Adults and older participants (>50 years) exhibited the highest inter-generational contacts. Rural contact rates were higher than semiurban (18.8 vs 15.6, p = 0.002), with rural primary school students having twice as many assortative contacts as their semiurban peers.
Conclusions and significance: This is the first age-specific contact matrix to be defined for tropical Sub-Saharan Africa and has utility in age-structured models to assess the potential impact of interventions for directly transmitted respiratory infections.
Conflict of interest statement
Figures


 with individuals in each age group
 . Part D: Population level numbers of contacts per day within and between age groups (estimated from the matrix defined in (C) scaled by the age-specific resident population size).
References
-
- Wallinga J, Teunis P, Kretzschmar M (2006) Using data on social contacts to estimate age-specific transmission parameters for respiratory-spread infectious agents. Am J Epidemiol 164: 936–944. - PubMed
-
- Keeling MJ, Danon L (2009) Mathematical modelling of infectious diseases. Br Med Bull 92: 33–42. - PubMed
-
- Del Valle SY, Hymanb JM, Hethcote HW, Eubank SG (2007) Mixing patterns between age groups in social networks. Social Networks 29: 539–554.
Publication types
MeSH terms
Grants and funding
LinkOut - more resources
Full Text Sources
Other Literature Sources
Medical

