

Characterizing Influenza surveillance systems performance: application of a Bayesian hierarchical statistical model to Hong Kong surveillance data
- PMID: 25127906
- PMCID: PMC4246552
- DOI: 10.1186/1471-2458-14-850
Characterizing Influenza surveillance systems performance: application of a Bayesian hierarchical statistical model to Hong Kong surveillance data
Abstract
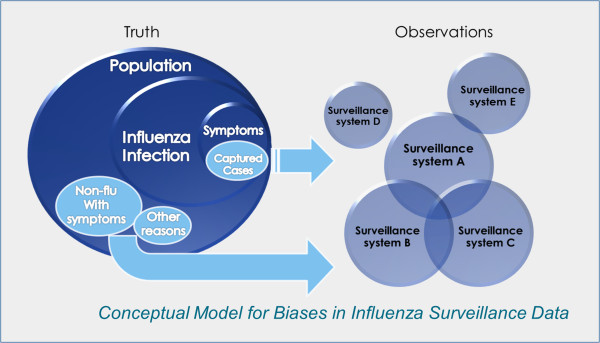
Background: Infectious disease surveillance is a process the product of which reflects both actual disease trends and public awareness of the disease. Decisions made by patients, health care providers, and public health professionals about seeking and providing health care and about reporting cases to health authorities are all influenced by the information environment, which changes constantly. Biases are therefore imbedded in surveillance systems; these biases need to be characterized to provide better situational awareness for decision-making purposes. Our goal is to develop a statistical framework to characterize influenza surveillance systems, particularly their correlation with the information environment.
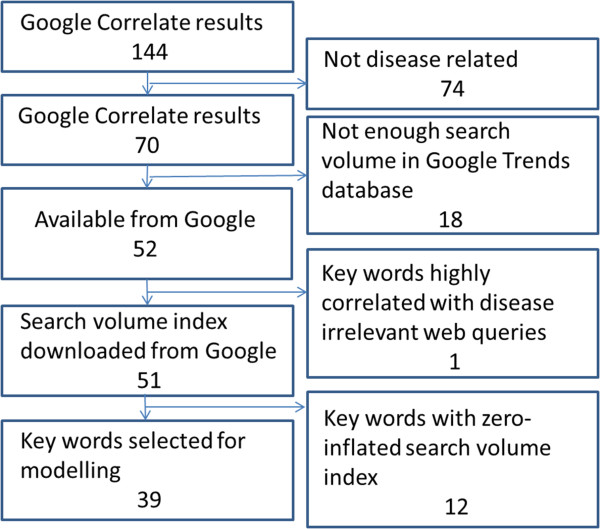
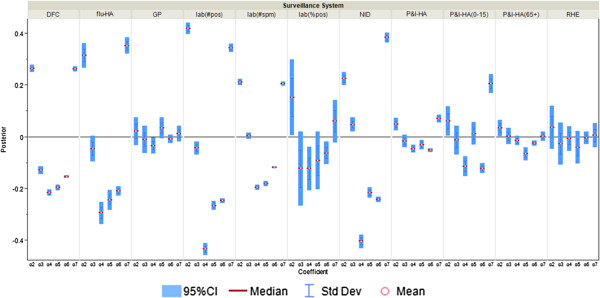
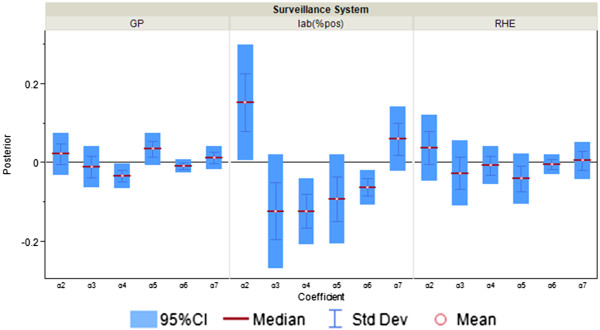
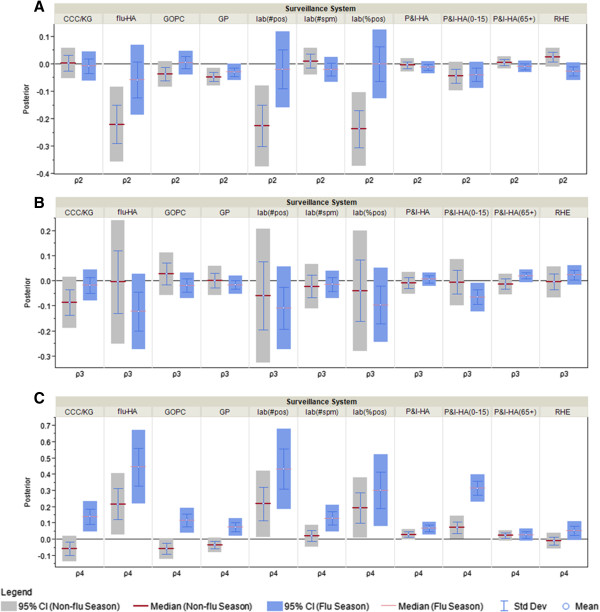
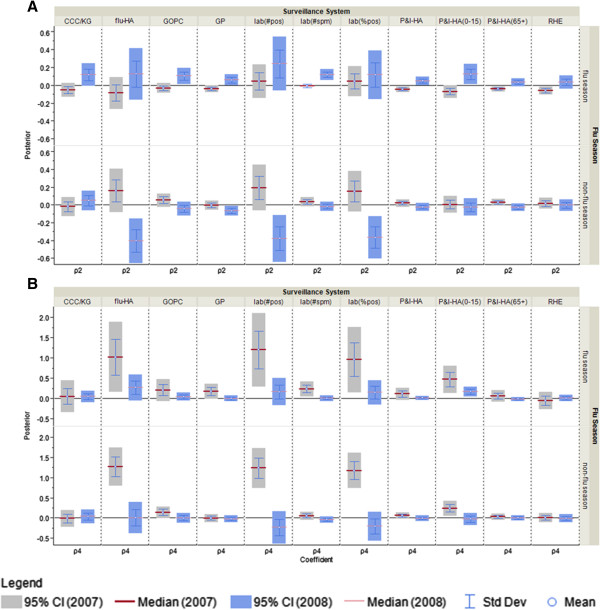
Methods: We identified Hong Kong influenza surveillance data systems covering healthcare providers, laboratories, daycare centers and residential care homes for the elderly. A Bayesian hierarchical statistical model was developed to examine the statistical relationships between the influenza surveillance data and the information environment represented by alerts from HealthMap and web queries from Google. Different models were fitted for non-pandemic and pandemic periods and model goodness-of-fit was assessed using common model selection procedures.
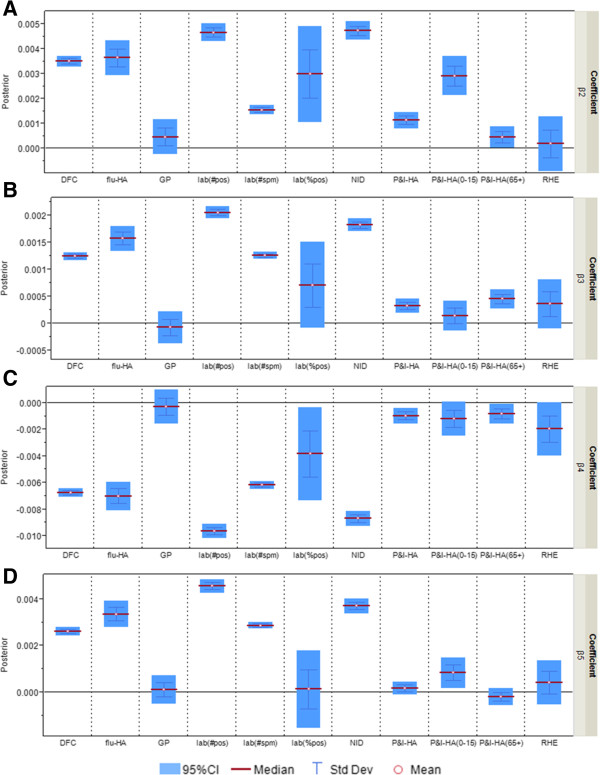
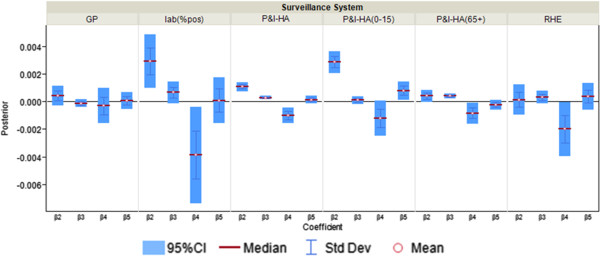
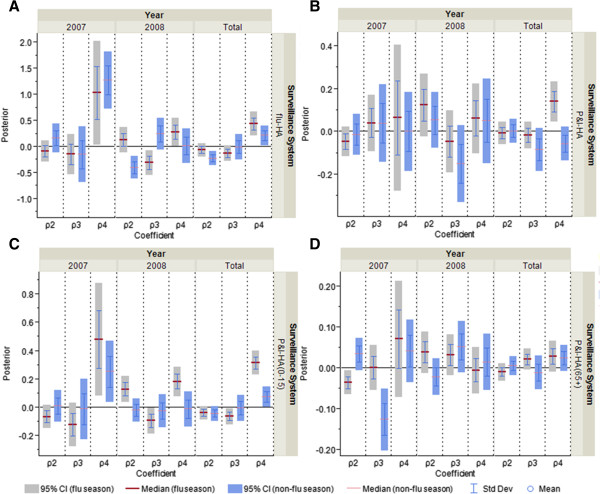
Results: Some surveillance systems - especially ad hoc systems developed in response to the pandemic flu outbreak - are more correlated with the information environment than others. General practitioner (percentage of influenza-like-illness related patient visits among all patient visits) and laboratory (percentage of specimen tested positive) seem to proportionally reflect the actual disease trends and are less representative of the information environment. Surveillance systems using influenza-specific code for reporting tend to reflect biases of both healthcare seekers and providers.
Conclusions: This study shows certain influenza surveillance systems are less correlated with the information environment than others, and therefore, might represent more reliable indicators of disease activity in future outbreaks. Although the patterns identified in this study might change in future outbreaks, the potential susceptibility of surveillance data is likely to persist in the future, and should be considered when interpreting surveillance data.
Figures
Similar articles
-
Part 4. Interaction between air pollution and respiratory viruses: time-series study of daily mortality and hospital admissions in Hong Kong.Res Rep Health Eff Inst. 2010 Nov;(154):283-362. Res Rep Health Eff Inst. 2010. PMID: 21446214
-
The effectiveness of U.S. public health surveillance systems for situational awareness during the 2009 H1N1 pandemic: a retrospective analysis.PLoS One. 2012;7(8):e40984. doi: 10.1371/journal.pone.0040984. Epub 2012 Aug 22. PLoS One. 2012. PMID: 22927904 Free PMC article.
-
Performance of eHealth data sources in local influenza surveillance: a 5-year open cohort study.J Med Internet Res. 2014 Apr 28;16(4):e116. doi: 10.2196/jmir.3099. J Med Internet Res. 2014. PMID: 24776527 Free PMC article.
-
The next influenza pandemic: lessons from Hong Kong, 1997.Emerg Infect Dis. 1999 Mar-Apr;5(2):195-203. doi: 10.3201/eid0502.990202. Emerg Infect Dis. 1999. PMID: 10221870 Free PMC article. Review.
-
Spanish flu, Asian flu, Hong Kong flu, and seasonal influenza in Japan under social and demographic influence: review and analysis using the two-population model.Jpn J Infect Dis. 2014;67(4):245-57. doi: 10.7883/yoken.67.245. Jpn J Infect Dis. 2014. PMID: 25056069 Review.
Cited by
-
Comparing the similarity and difference of three influenza surveillance systems in China.Sci Rep. 2018 Feb 12;8(1):2840. doi: 10.1038/s41598-018-21059-9. Sci Rep. 2018. PMID: 29434230 Free PMC article.
-
North to south gradient and local waves of influenza in Chile.Sci Rep. 2022 Feb 14;12(1):2409. doi: 10.1038/s41598-022-06318-0. Sci Rep. 2022. PMID: 35165325 Free PMC article.
References
-
- Stacey LK, Alison M, Adel M, Stanley ML. The threat of pandemic influenza: Are we ready? Workshop Summary. Washington, DC: The National Academies Press; 2005. - PubMed
Pre-publication history
-
- The pre-publication history for this paper can be accessed here: http://www.biomedcentral.com/1471-2458/14/850/prepub
Publication types
MeSH terms
Grants and funding
LinkOut - more resources
Full Text Sources
Other Literature Sources
Medical
