

Comparison of NaF and FDG PET/CT for assessment of treatment response in castration-resistant prostate cancers with osseous metastases
- PMID: 25128349
- PMCID: PMC4289415
- DOI: 10.1016/j.clgc.2014.07.001
Comparison of NaF and FDG PET/CT for assessment of treatment response in castration-resistant prostate cancers with osseous metastases
Abstract
Background: Assessment of skeletal metastases' response to therapy is a highly relevant but unresolved clinical problem. The main goal of this work was to compare pharmacodynamic responses to therapy assessed with positron emission tomography-computed tomography (PET/CT) using fluorine-18 sodium fluoride (NaF) and fluorine-18 fluorodeoxyglucose (FDG) as the tracers.
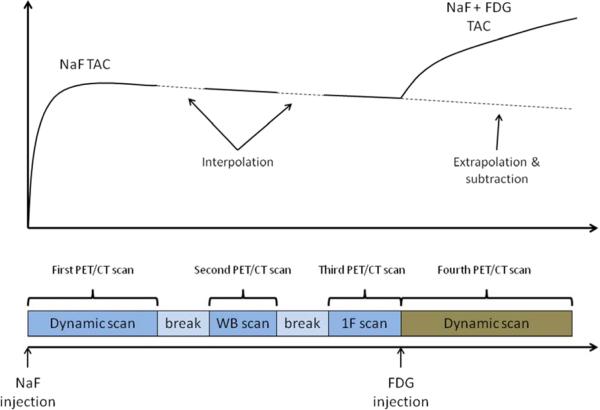
Materials and methods: Patients with prostate cancer with known osseous metastases were treated with zibotentan (ZD4054) and imaged with combined dynamic NaF/FDG PET/CT before therapy (baseline), after 4 weeks of therapy (week 4), and after 2 weeks of treatment break (week 6). Kinetic analysis allowed comparison of the voxel-based tracer uptake rate parameter Ki, the vasculature parameters K1 (measuring perfusion/permeability) and Vb (measuring vasculature fraction in the tissue), and the standardized uptake values (SUVs).
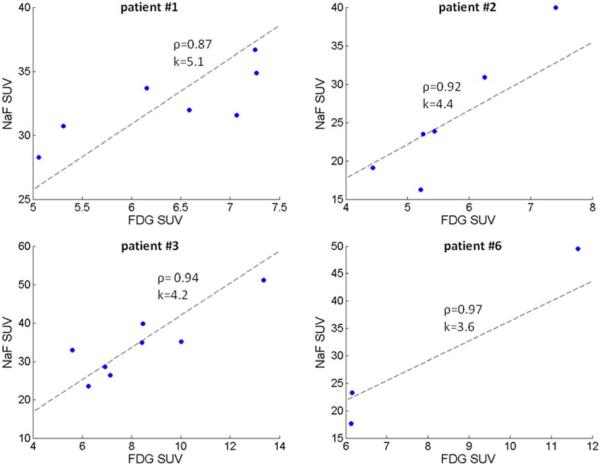
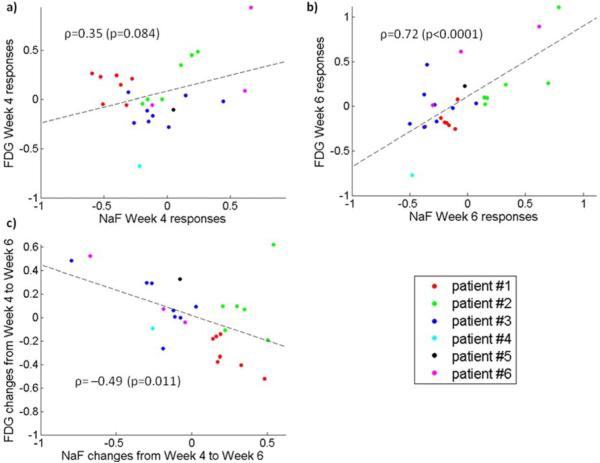
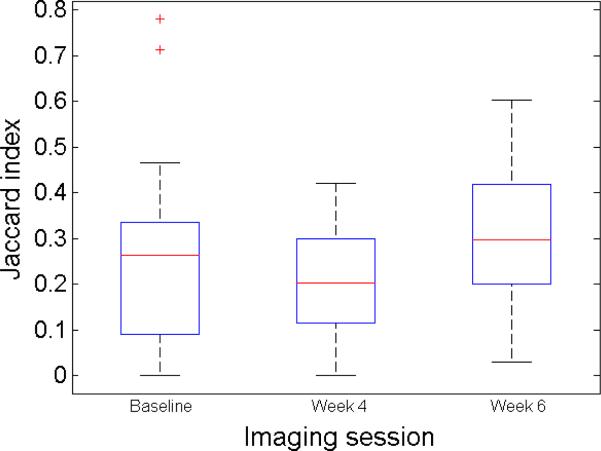
Results: Correlations were high for the NaF and FDG peak uptake parameters (Ki and SUV correlations ranged from 0.57 to 0.88) and for vasculature parameters (K1 and Vb correlations ranged from 0.61 to 0.81). Correlation was low between the NaF and FDG week 4 Ki responses (ρ = 0.35; P = .084) but was higher for NaF and FDG week 6 Ki responses (ρ = 0.72; P < .0001). Correlations for vasculature responses were always low (ρ < 0.35). NaF and FDG uptakes in the osseous metastases were spatially dislocated, with overlap in the range from 0% to 80%.
Conclusion: This study found that late NaF and FDG uptake responses are consistently correlated but that earlier uptake responses and all vasculature responses can be unrelated. This study also confirmed that FDG and NaF uptakes are spatially dislocated. Although treatment responses assessed with NaF and FDG may be correlated, using both tracers provides additional information.
Trial registration: ClinicalTrials.gov NCT01119118.
Keywords: Dual-tracer PET imaging; Kinetic analysis; Skeletal metastases; Therapy response assessment; Zibotentan.
Copyright © 2015 Elsevier Inc. All rights reserved.
Figures


References
-
- Siegel R, Naishadham D, Jemal A. Cancer statistics, 2013. CA Cancer J Clin. 2013;63:11–30. - PubMed
-
- Bubendorf L, Schopfer A, Wagner U, et al. Metastatic patterns of prostate cancer: an autopsy study of 1,589 patients. Hum Pathol. 2000;31:578–583. - PubMed
-
- Morisson C, Jeraj R, Liu G. Imaging of castration-resistant prostrate cancer: development of imaging response biomarkers. Curr Opin Urol. 2013;23:230–236. - PubMed
Publication types
MeSH terms
Substances
Associated data
Grants and funding
LinkOut - more resources
Full Text Sources
Other Literature Sources
Medical
