. 2014 Aug 15;3(4):e001024.
doi: 10.1161/JAHA.114.001024.

Lack of angiopoietin-like-2 expression limits the metabolic stress induced by a high-fat diet and maintains endothelial function in mice

Affiliations

Lack of angiopoietin-like-2 expression limits the metabolic stress induced by a high-fat diet and maintains endothelial function in mice

Carol Yu et al. J Am Heart Assoc. .

Abstract

Background: Angiopoietin-like-2 (angptl2) is produced by several cell types including endothelial cells, adipocytes and macrophages, and contributes to the inflammatory process in cardiovascular diseases. We hypothesized that angptl2 impairs endothelial function, and that lowering angptl2 levels protects the endothelium against high-fat diet (HFD)-induced fat accumulation and hypercholesterolemia.

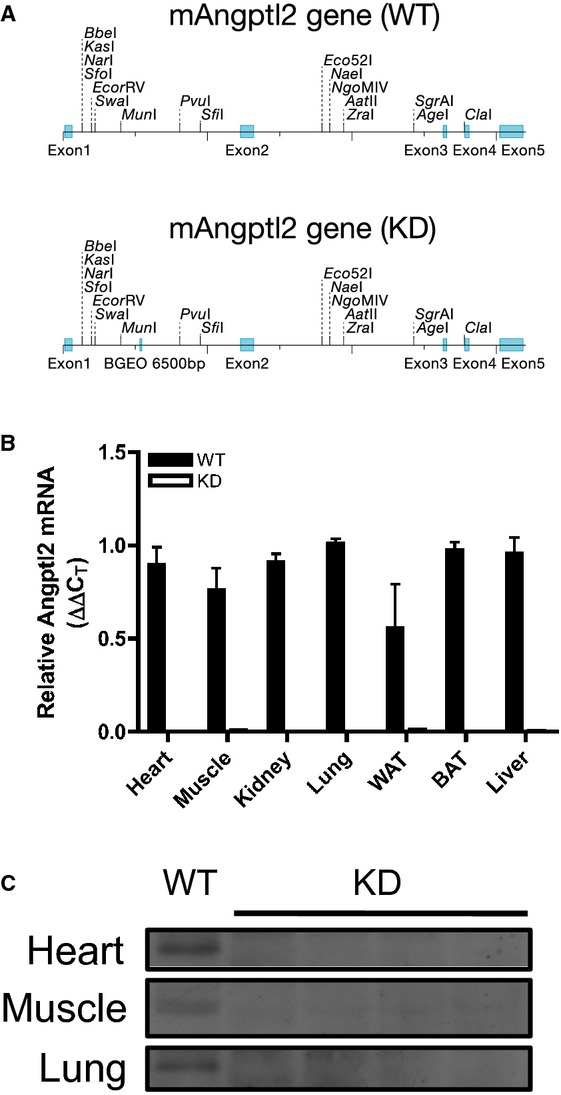
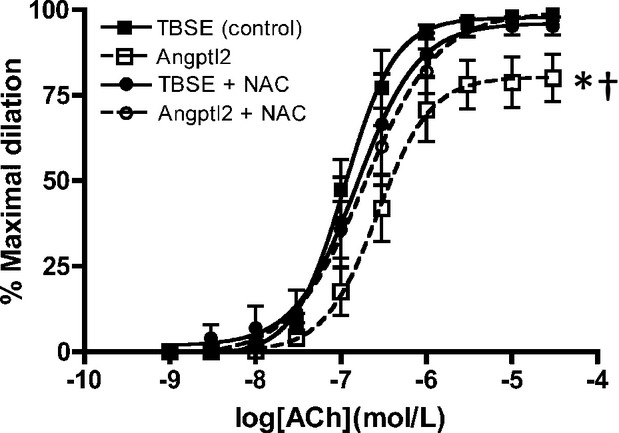
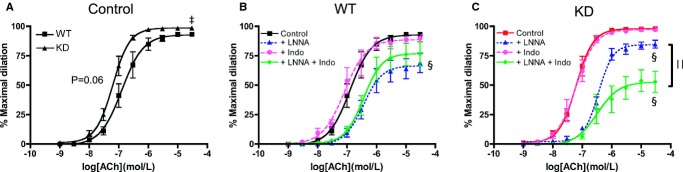
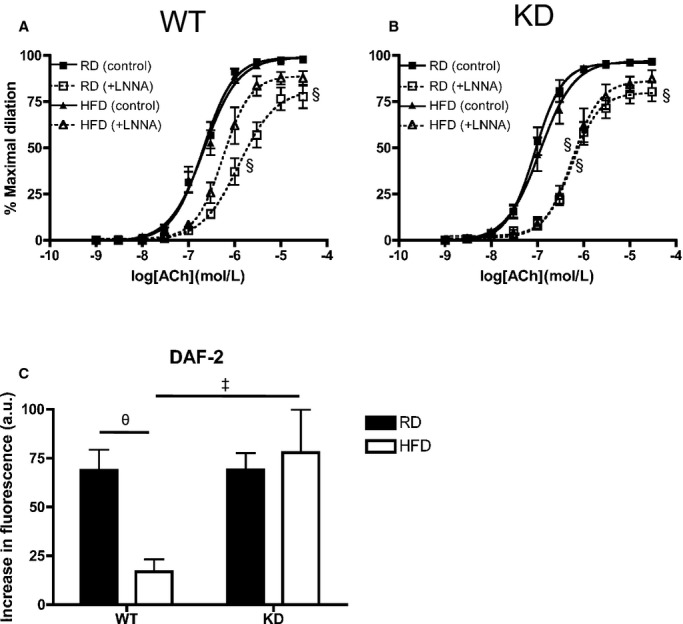
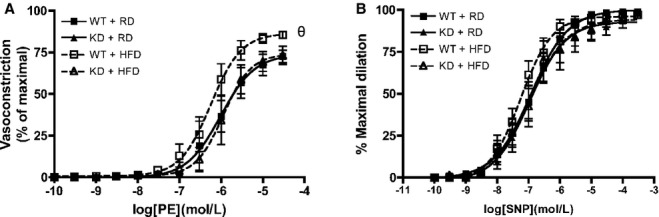
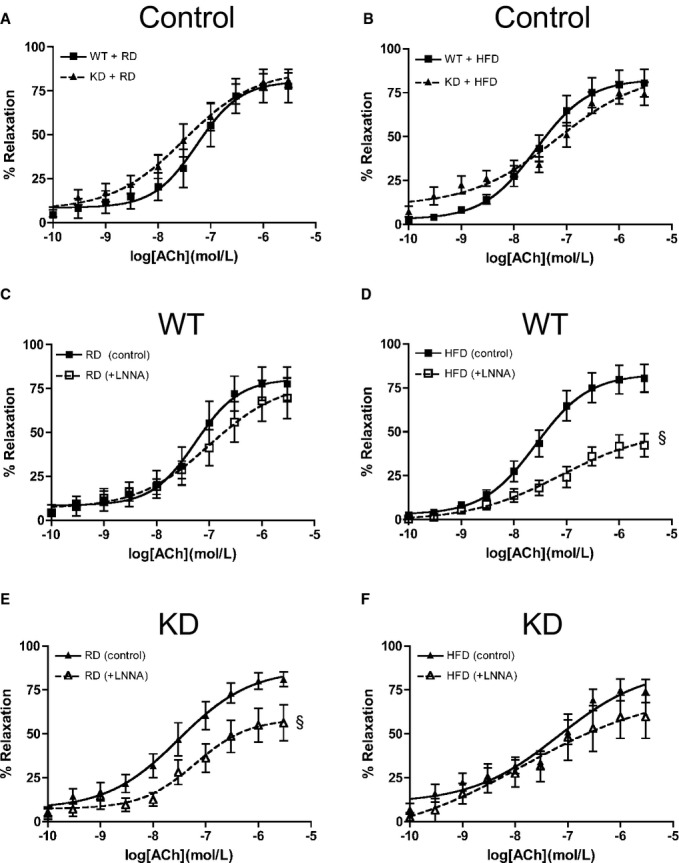
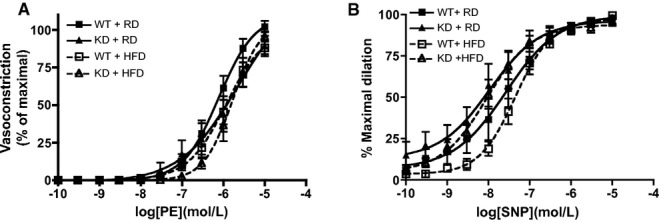
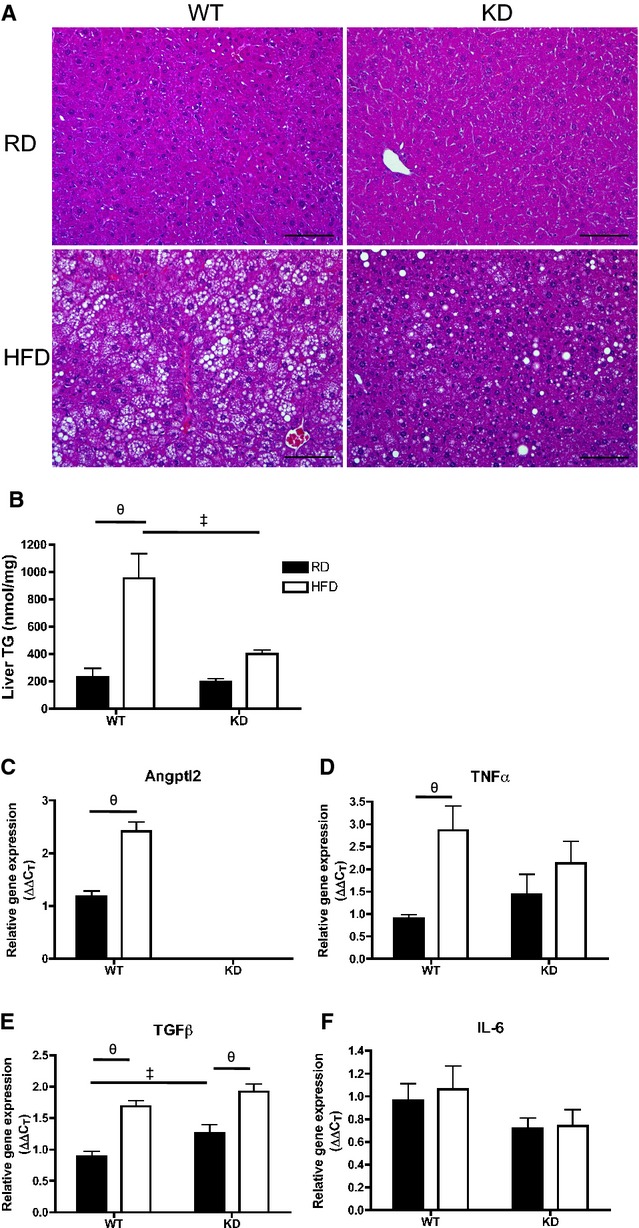
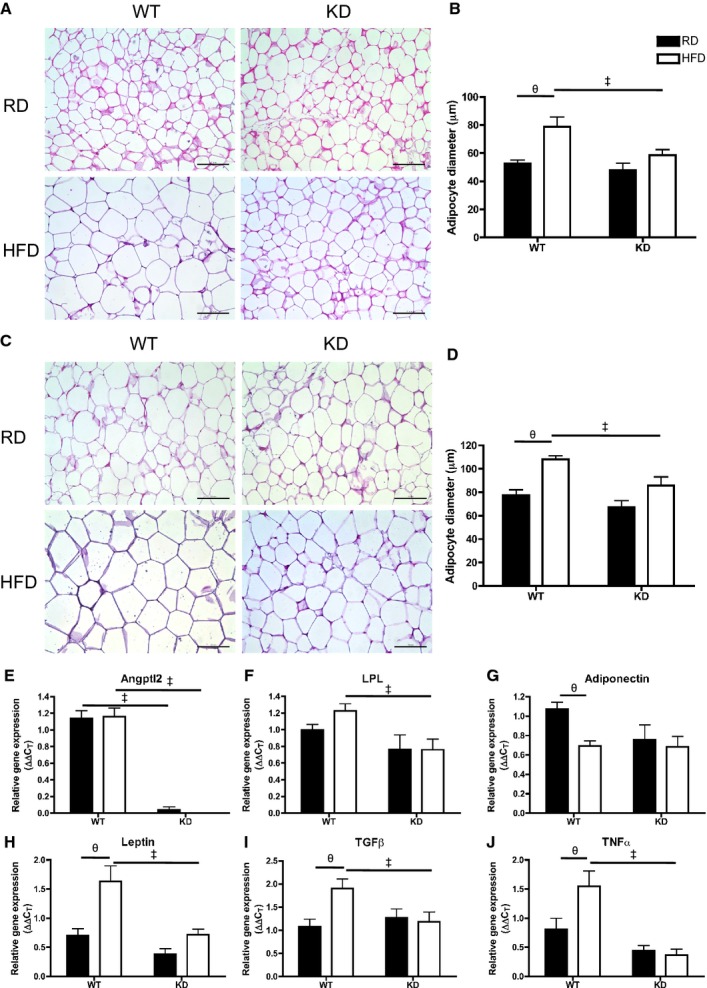
Methods and results: Acute recombinant angptl2 reduced (P<0.05) acetylcholine-mediated vasodilation of isolated wild-type (WT) mouse femoral artery, an effect reversed (P<0.05) by the antioxidant N-acetylcysteine. Accordingly, in angptl2 knockdown (KD) mice, ACh-mediated endothelium-dependent vasodilation was greater (P<0.05) than in WT mice. In arteries from KD mice, prostacyclin contributed to the overall dilation unlike in WT mice. After a 3-month HFD, overall vasodilation was not altered, but dissecting out the endothelial intrinsic pathways revealed that NO production was reduced in arteries isolated from HFD-fed WT mice (P<0.05), while NO release was maintained in KD mice. Similarly, endothelium-derived hyperpolarizing factor (EDHF) was preserved in mesenteric arteries from HFD-fed KD mice but not in those from WT mice. Finally, the HFD increased (P<0.05) total cholesterol-to-high-density lipoprotein ratios, low-density lipoprotein-to-high-density lipoprotein ratios, and leptin levels in WT mice only, while glycemia remained similar in the 2 strains. KD mice displayed less triglyceride accumulation in the liver (P<0.05 versus WT), and adipocyte diameters in mesenteric and epididymal white adipose tissues were smaller (P<0.05) in KD than in WT fed an HFD, while inflammatory gene expression increased (P<0.05) in the fat of WT mice only.

Conclusions: Lack of angptl2 expression limits the metabolic stress induced by an HFD and maintains endothelial function in mice.

Keywords: adipokines; endothelium‐derived relaxing factors; inflammation; isolated arteries.


Figures

Figure 1.
Figure 1.
A, Schematic representation showing insertion of a promoterless trapping β‐geo cassette of 6500 bp in size into the mouse angptl2 locus, downstream of exon 1; top and bottom representation show angptl2 wild‐type (WT) and knock‐down (KD) scheme, respectively. B, Verification of angptl2 knock‐down in various mouse tissues by qPCR analysis; white adipose tissue (WAT), brown adipose tissue (BAT); n=3 to 4. C, Verification of angptl2 knock‐down in various mouse tissues by Western blot. qPCR indicates quantitative polymerase chain reaction.
Figure 2.
Figure 2.
Vascular reactivity of pressurized femoral arteries measured by ACh‐mediated dilation in 3‐ to 4‐month‐old WT (n=4 to 5) with addition of Tris‐buffered saline EDTA (control) or angptl2‐Glutathion S‐transferase (50 nmol/L) with or without antioxidant NAC (10 μmol/L). The z‐score method followed by the d'Agostino–Pearson omnibus test was used to test normality of data sets, after which the 1‐way ANOVA followed by the Bonferonni posttest were used. *P<0.05 vs control; †P<0.05 vs + NAC. ACh indicates acetylcholine; Angptl2, angiopoietin‐like‐2; GST, Glutathion S‐transferase; NAC, N‐acetylcysteine; TBSE, Tris‐buffered saline EDTA; WT, wild‐type.
Figure 3.
Figure 3.
Vascular reactivity as measured by ACh‐mediated dilation in femoral arteries of WT (n=7) and angptl2 KD (n=8) mice at 3 to 4 months of age in no‐drug control condition (A) and in the presence of LNNA (100 μmol/L), indomethacin (Indo, 10 μmol/L), or their combination in arteries isolated from WT mice (B) and KD mice (C). The z‐score method followed by the d'Agostino–Pearson omnibus test was used to test normality of data sets, after which the unpaired Student t test (A) and the 1‐way ANOVA followed by the Bonferonni posttest were used (B and C). ‡P<0.05 vs WT; §P<0.05 vs control; ||P<0.05 vs +LNNA. ACh indicates acetylcholine; KD, knockdown; LNNA, Nω‐nitro‐l‐arginine; WT, wild‐type.
Figure 4.
Figure 4.
Vascular reactivity as measured by ACh‐mediated dilation in femoral arteries under no‐drug control condition and with LNNA of 6‐month‐old (A) WT (n=7 to 10) and (B) angptl2 KD (n=9 to 13) mice fed an RD or HFD. The Kruskal–Wallis test followed by the Dunn's posttest were used for data sets not normally distributed. §P<0.05 vs control. C, Production of NO was measured by loading femoral arteries with DAF‐2 with average increases in fluorescence intensities during addition of 10 μmol/L ACh (n=6). The z‐score method followed by the d'Agostino–Pearson omnibus test was used to test normality of data sets, after which the 2‐way ANOVA followed by the Bonferonni posttest were used. ‡P<0.05 vs WT; θP<0.05 vs RD. ACh indicates acetylcholine; DAF‐2, 4,5‐diaminoflorescein diacetate; HFD, high‐fat diet; KD, knockdown; LNNA, Nω‐nitro‐l‐arginine; NO, nitric oxide; RD, regular diet; WT, wild‐type.
Figure 5.
Figure 5.
Vascular smooth muscle cell function was assessed in femoral arteries from WT and angptl2 KD mice, by (A) vasoconstriction to phenylephrine (PE), and (B) dilation to sodium nitroprusside (SNP) in the absence of the endothelium. Data are mean±SEM of n=4 to 6 mice, and compared using the Mann–Whitney U test. θP<0.05 vs RD. KD indicates knockdown; RD, regular diet; WT, wild‐type.
Figure 6.
Figure 6.
A, DHE staining in femoral arteries of WT and KD mice fed an RD or HFD, and (B) quantifications of DHE intensities in femoral arteries; n=3 to 5. DHE indicates dihydroethidium; HFD, high‐fat diet; KD, knockdown; RD, regular diet; WT, wild‐type.
Figure 7.
Figure 7.
ACh‐mediated relaxation in mesenteric arteries of 6‐month‐old mice fed an (A) RD, (B) HFD under no‐drug control condition and with LNNA in WT (n=6) fed an (C) RD or (D) HFD, and in KD (n=6 to 10) fed an (E) RD or (F) HFD. The z‐score method followed by the d'Agostino–Pearson omnibus test was used to test normality of data sets, after which the 2‐way ANOVA followed by the Bonferonni posttest were used. §P<0.05 vs control. ACh indicates acetylcholine; HFD, high‐fat diet; KD, knockdown; LNNA, Nω‐nitro‐l‐arginine; RD, regular diet; WT, wild‐type.
Figure 8.
Figure 8.
Vascular smooth muscle cell function was assessed in mesenteric arteries from WT and angptl2 KD mice, by (A) vasoconstriction to phenylephrine (PE) and (B) dilation to sodium nitroprusside (SNP) in the absence of the endothelium. Data are mean±SEM of n=4 to 6 mice. KD indicates knockdown; WT, wild‐type.
Figure 9.
Figure 9.
A, H&E‐stained liver sections (scale bar=100 μm) and (B) quantification of triglyceride (TG) content in liver of 6‐month‐old WT and angptl2 KD mice fed a regular diet (RD) or a 3‐month high‐fat diet (HFD); n=4 to 5. C through F, Quantitative RT‐PCR of mRNAs encoding for angptl2 and various inflammatory markers in liver of WT or angptl2 KD mice fed an RD or HFD; n=6 to 7. The z‐score method followed by the d'Agostino–Pearson omnibus test was used to test normality of data sets, after which the 2‐way ANOVA followed by the Bonferonni posttest were used. ‡P<0.05 vs WT; θP<0.05 vs RD. KD indicates knockdown; RT‐PCR, real‐time quantitative polymerase chain reaction; TGF, transforming growth factor; WT, wild‐type.
Figure 10.
Figure 10.
A through L, Expression of genes coding for proteins involved in lipid metabolism regulation in the liver by qPCR; n=6 to 7. Data sets were tested for normality using the z‐score method and the d'Agostino–Pearson omnibus test, after which 2‐way ANOVA followed by the Bonferroni posttest was used. All except I passed the normality test, where the Krustal–Wallis followed by Dunn's posttest were used. ‡P<0.05 vs WT; θP<0.05 vs RD. FXR indicates farnesoid X receptor; HFD, high‐fat diet; HMG‐CoA, 3‐hydroxy‐3‐methylglutaryl coenzyme‐A; HSL, hormone‐sensitive lipase; KD, knockdown; LPL, lipoprotein lipase; PPAR, peroxisome proliferator‐activated receptor; qPCR, quantitative polymerase chain reaction; RD, regular diet; SREBP, sterol regulatory element binding protein.
Figure 11.
Figure 11.
A, Hematoxylin‐eosin–stained mesenteric white adipose tissue (mWAT) in different groups (scale bar=100 μm) and (B) quantification of adipocyte size of diameter measurements (average of 3 quantifying analyses was used per animal) in mWAT; n=3 to 5. C, Hematoxylin‐eosin–stained epididymal WAT (eWAT) in different groups (scale bar=100 μm) and (D) quantification of adipocyte diameters in eWAT; n=3 to 6. E through J, Gene expression analysis by qPCR in eWAT of WT and KD mice fed an RD or HFD; n=6 to 7. The z‐score method followed by the d'Agostino–Pearson omnibus test was used to test normality of data sets, after which the 2‐way ANOVA followed by the Bonferonni posttest were used, except in E, where the Kruskal–Wallis followed by Dunn's posttest were used as it did not pass normality test. ‡P<0.05 vs WT; θP<0.05 vs RD. HFD indicates high‐fat diet; KD, knockdown; qPCR, quantitative polymerase chain reaction; RD, regular diet; WT, wild‐type.
Figure 12.
Figure 12.
A through F, Expression of genes coding for proteins involved in lipid metabolism regulation in the eWAT by qPCR; n=6 to 7. Data sets were tested for normality using the z‐score method and the d'Agostino–Pearson omnibus test, after which 2‐way ANOVA followed by Bonferroni's posttest were used. ‡P<0.05 vs WT; θP<0.05 vs RD. eWAT indicates epididymal white adipose tissue; HSL, hormone‐sensitive lipase; KD, knockdown; PPAR, peroxisome proliferator‐activated receptor; qPCR, quantitative polymerase chain reaction; RD, regular diet; WT, wild‐type.

References

    1. Reaven GM. Banting Lecture 1988. Role of insulin resistance in human disease. Diabetes. 1988; 1988:1595-1607. - PubMed
    1. Krauss RM, Winston M, Fletcher RN, Grundy SM. Obesity: impact of cardiovascular disease. Circulation. 1998; 98:1472-1476. - PubMed
    1. Tabata M, Kadomatsu T, Fukuhara S, Miyata K, Ito Y, Endo M, Urano T, Zhu HJ, Tsukano H, Tazume H, Kaikita K, Miyashita K, Iwawaki T, Shimabukuro M, Sakaguchi K, Ito T, Nakagata N, Yamada T, Katagiri H, Kasuga M, Ando Y, Ogawa H, Mochizuki N, Itoh H, Suda T, Oike Y. Angiopoietin‐like protein 2 promotes chronic adipose tissue inflammation and obesity‐related systemic insulin resistance. Cell Metab. 2009; 10:178-188. - PubMed
    1. Farhat N, Thorin‐Trescases N, Mamarbachi M, Villeneuve L, Yu C, Martel C, Duquette N, Gayda M, Nigam A, Juneau M, Allen BG, Thorin E. Angiopoietin‐like 2 promotes atherogenesis in mice. J Am Heart Assoc. 2013; 2:e00020110.1161/JAHA.113.000201 - PMC - PubMed
    1. Horio E, Kadomatsu T, Miyata K, Arai Y, Hosokawa K, Doi Y, Ninomiya T, Horiguchi H, Endo M, Tabata M, Tazume H, Tian Z, Takahashi O, Terada K, Takeya M, Hao H, Hirose N, Minami T, Suda T, Kiyohara Y, Ogawa H, Kaikita K, Oike Y. Role of endothelial cell‐derived Angptl2 in vascular inflammation leading to endothelial dysfunction and atherosclerosis progression. Arterioscler Thromb Vasc Biol. 2014; 34:790-800. - PubMed

Publication types

MeSH terms