. 2014 Aug 15;28(16):1800-14.
doi: 10.1101/gad.244368.114.

CDK9-mediated transcription elongation is required for MYC addiction in hepatocellular carcinoma

Affiliations

CDK9-mediated transcription elongation is required for MYC addiction in hepatocellular carcinoma

Chun-Hao Huang et al. Genes Dev. .

Abstract

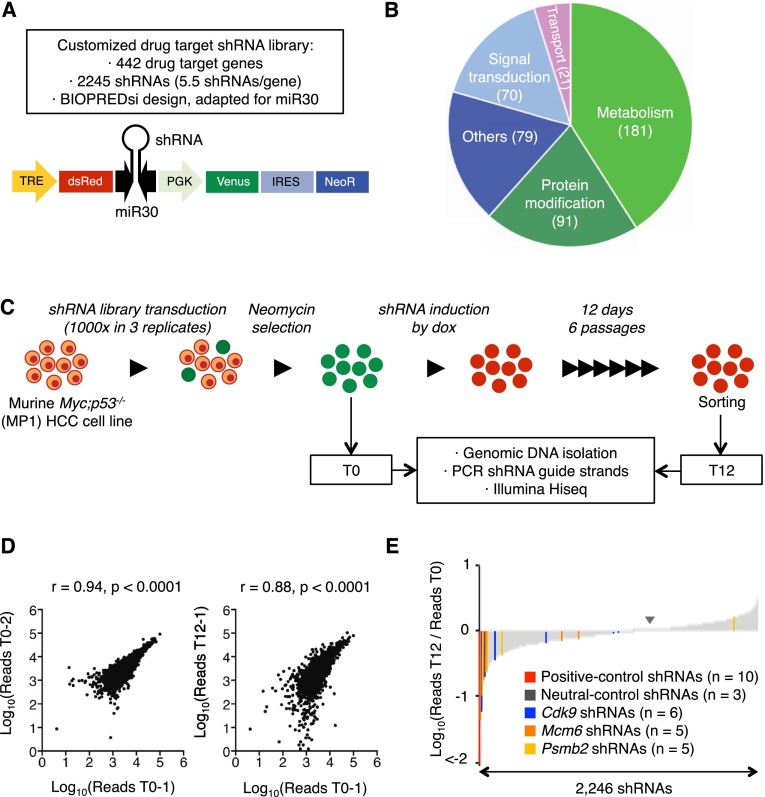
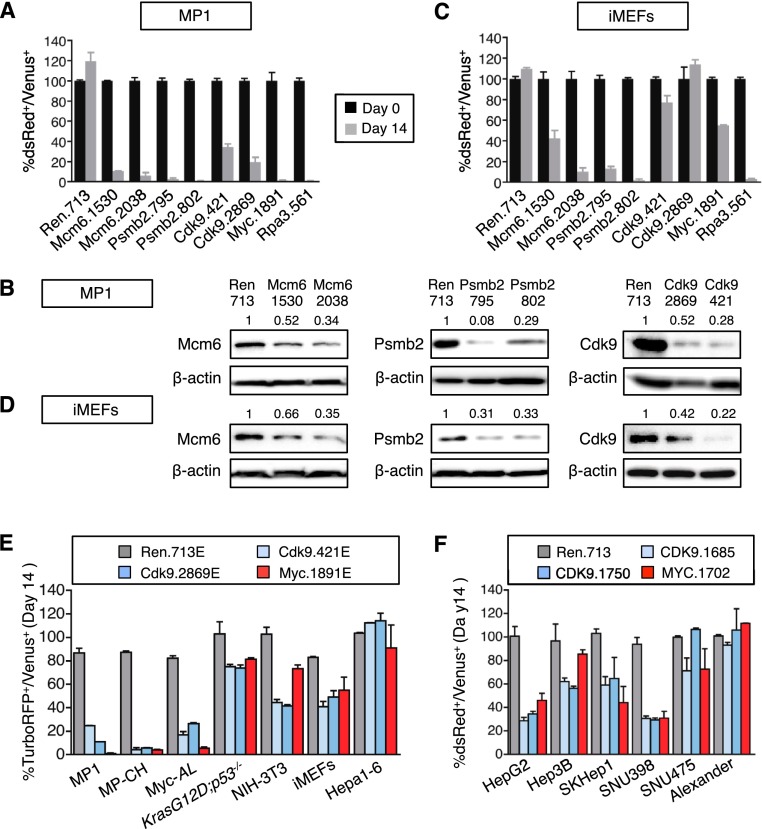
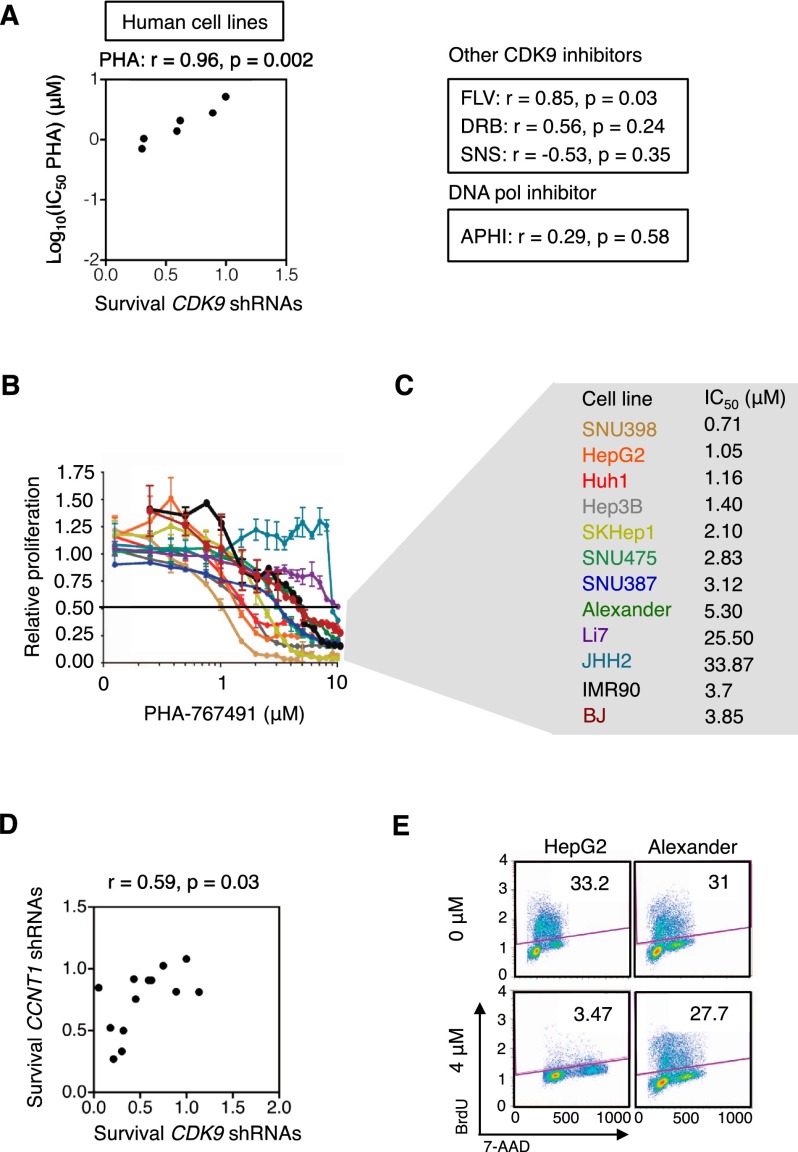
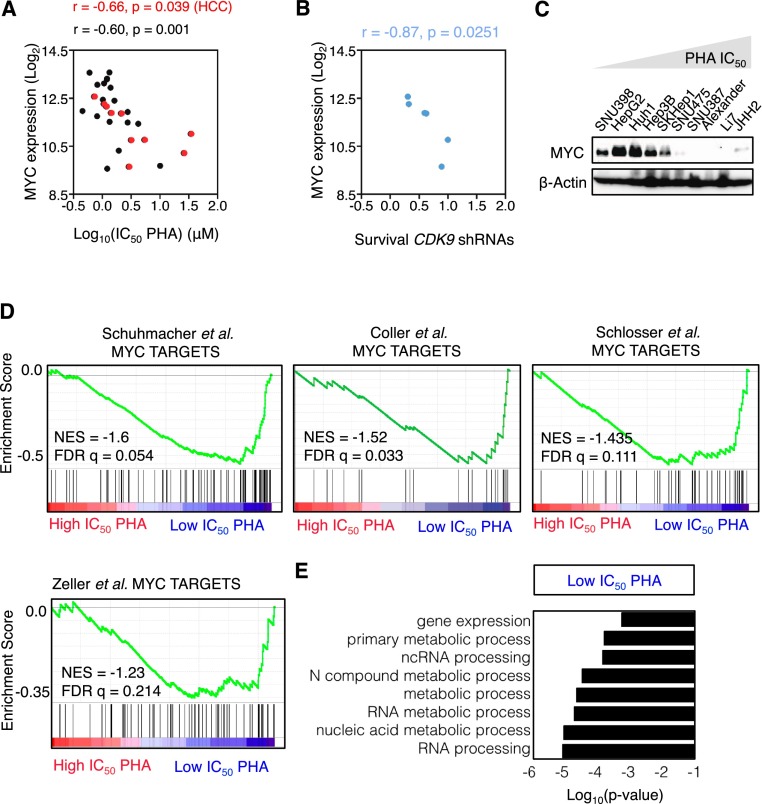
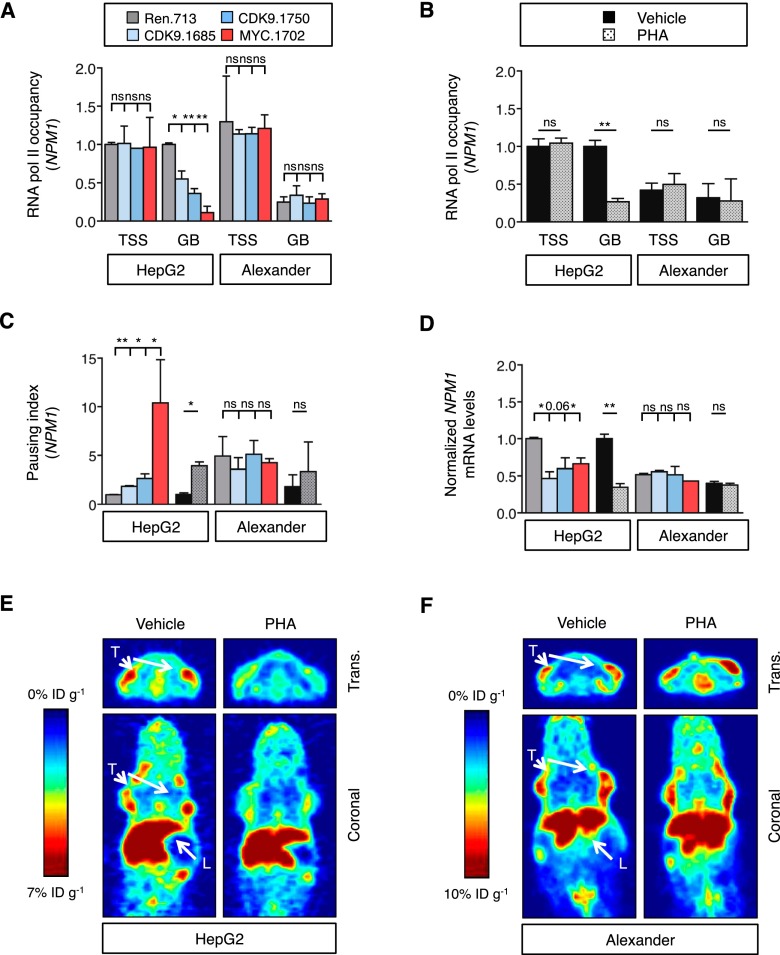
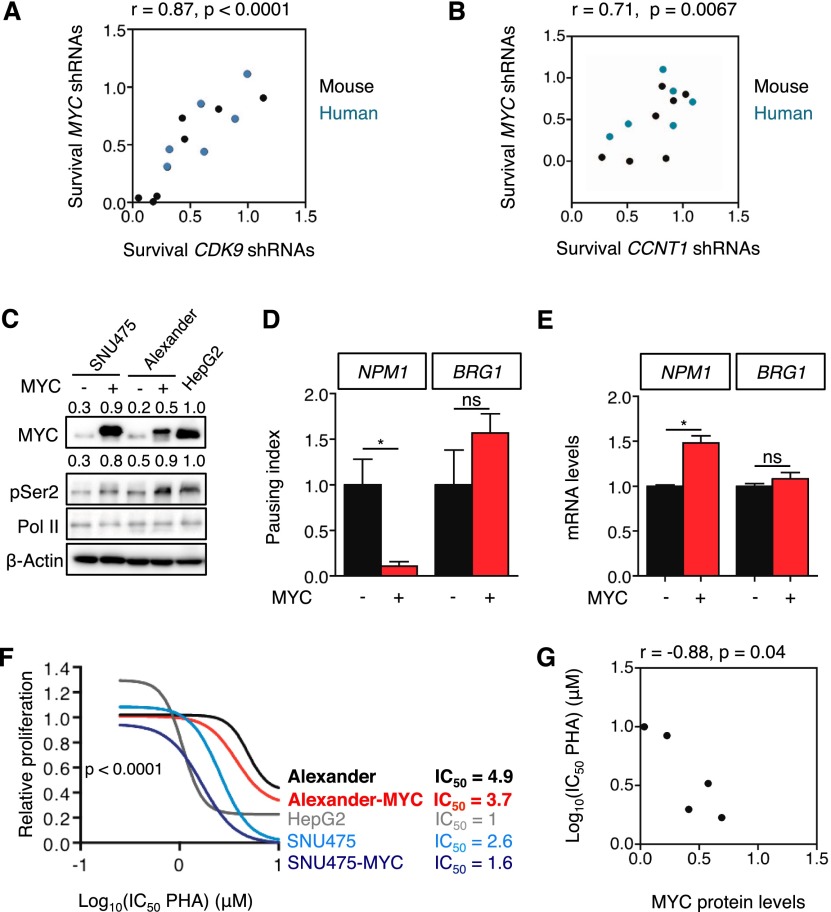
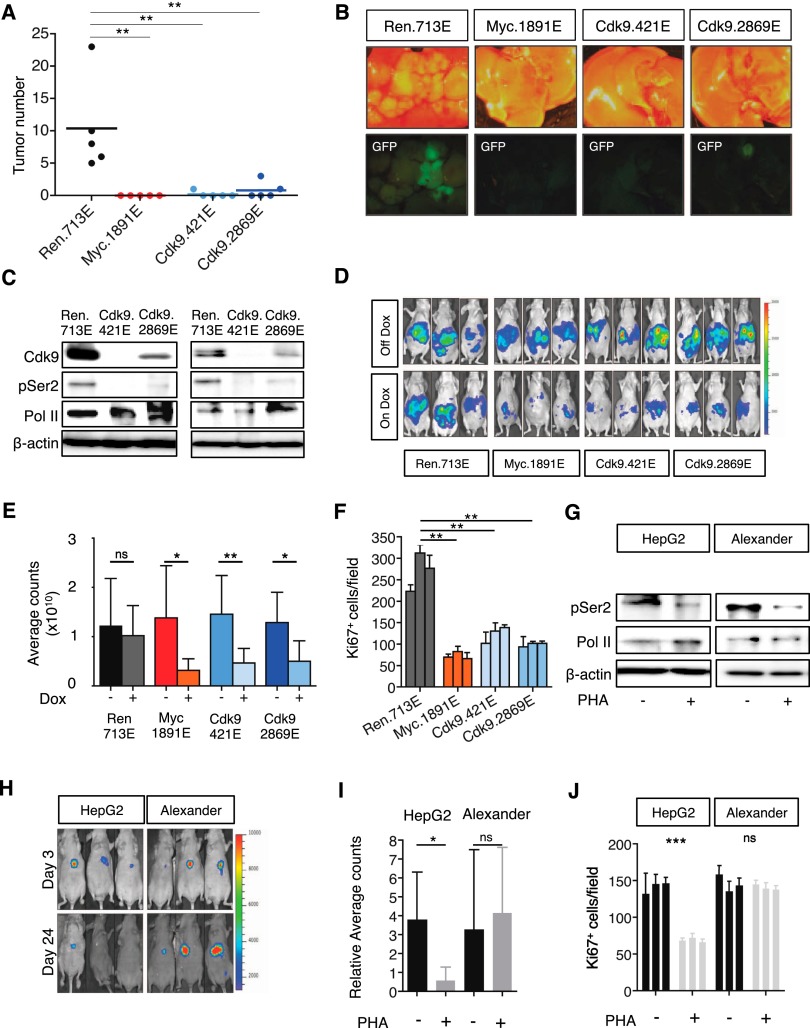
One-year survival rates for newly diagnosed hepatocellular carcinoma (HCC) are <50%, and unresectable HCC carries a dismal prognosis owing to its aggressiveness and the undruggable nature of its main genetic drivers. By screening a custom library of shRNAs directed toward known drug targets in a genetically defined Myc-driven HCC model, we identified cyclin-dependent kinase 9 (Cdk9) as required for disease maintenance. Pharmacological or shRNA-mediated CDK9 inhibition led to robust anti-tumor effects that correlated with MYC expression levels and depended on the role that both CDK9 and MYC exert in transcription elongation. Our results establish CDK9 inhibition as a therapeutic strategy for MYC-overexpressing liver tumors and highlight the relevance of transcription elongation in the addiction of cancer cells to MYC.

Keywords: CDK9; MYC; RNAi screen; oncogene addiction; transcription elongation.


Figures

Figure 1.
Figure 1.
RNAi screen for genes encoding known drug targets. (A) Library features and schematic of the TRMPV-neo vector. (B) Pathway categories of “drug target” genes included in the library. Numbers indicate the number of genes in each category. All shRNA sequences are provided in Supplemental Table 1. (C) RNAi screening strategy. (D) Representative scatter plots illustrating the correlation of normalized reads per shRNA between replicates at the beginning of the experiment (left) and replicates at different time points (right) (related to Supplemental Table 2). (E) Pooled negative selection screening results in MP1 (Myc;p53−/− clone 1 murine HCC cells) murine HCC cells. After eliminating underrepresented shRNAs at T0 (beginning of the experiment), shRNA abundance ratios of 2246 shRNAs were calculated as the number of normalized reads after 12 d of culture on dox (T12, end) divided by the number of normalized reads before dox treatment (T0) and are plotted as the mean of three replicates in ascending order.
Figure 2.
Figure 2.
CDK9 is required for the proliferation of some HCC cell lines. (A) Competitive proliferation assay. G418-selected Venus+ cells were mixed with untransduced cells at 1:1 ratio and subsequently cultured in the presence of dox. The percentage of Venus+dsRed+ (shRNA-expressing) cells was determined at different time points (results at day 0 and day 14 are shown and are relative to day 0). Changes were used as readout of growth inhibitory effects. Values are mean + SD of three independent experiments. The graphs show the validation of the candidate shRNAs as well as control shRNAs (Ren.713, Myc.1891, and Rpa3.561) in MP1 murine HCC cells. (B) Immunoblots showing the knockdown induced by shRNAs expressed from TRMPV-neo in MP1 murine HCC cells. β-Actin was used as loading control. The numbers indicate protein levels relative to β-actin. (C) Competitive proliferation assay of control and candidate shRNAs expressed from TRMPV-neo in iMEFs, as described in A. Color code is as in A. (D) Immunoblots showing the knockdown induced by shRNAs expressed from TRMPV-neo in iMEFs. β-Actin was used as loading control. The numbers indicate protein levels relative to β-actin. (E,F) Competitive proliferation assay of control (Renilla and MYC) and CDK9 shRNAs expressed from TRMPV-neo-miR-E (E) or TRMPV-neo (F) in different murine (E) and human (F) cell lines, as described in A. The percentage of shRNA-expressing cells at day 14 relative to day 0 is shown. Values are mean + SD from two independent experiments.
Figure 3.
Figure 3.
Pharmacological inhibition of CDK9 in HCC cell lines. (A) Scatter plot illustrating the correlation between anti-proliferative effects of CDK9 shRNAs and the IC50 of PHA-767491 in six human cell lines (from Fig. 2F). The correlation and P-values of three additional CDK9 inhibitors and one DNA replication inhibitor (aphidicolin) are also shown in the right panel. The survival is defined as the average of the survival ratio of two shRNAs in competitive proliferation assay. (FLV) Flavopiridol; (PHA) PHA-767491; (SNS) SNS-032; (APHI) aphidicolin. (B) Proliferation rates of PHA-767491-treated human cells, calculated by measuring the change in viable cell number after 72 h in culture and fitting data to an exponential growth curve. Results were normalized to the proliferation rate of vehicle (H2O)-treated cells, set to 1. Values are mean ± SD of three independent replicates. (C) Summary of PHA-767491 IC50 values of human cell lines in B. (D) Scatter plot illustrating the correlation between survival with CDK9 shRNAs and survival with CCNT1 shRNAs in murine and human cell lines (from Fig. 2E,F). (E) Representative flow cytometry plots showing cell cycle analysis (BrdU+7-AAD+ double staining) of cells after 48 h of PHA-767491 treatment. The experiment was performed twice, and values indicate the mean ± SD.
Figure 4.
Figure 4.
MYC expression predicts response to CDK9 inhibition. (A) Scatter plot illustrating the correlation between PHA-767491 (PHA) IC50 values and MYC expression levels in human HCC (red; from Fig. 3B,C), leukemia, lymphoma, and lung cancer cell lines (n = 28). (B) Scatter plot illustrating the correlation between survival with CDK9 shRNAs and MYC expression levels in a panel of different human HCC cell lines (from Fig. 2F). The survival is defined as the average of the survival ratio of two shRNAs in competitive proliferation assay. (C) Immunoblots showing MYC protein levels in 10 human HCC cell lines. β-Actin was used as loading control. (D) GSEA plot evaluating the association between low IC50 of PHA-767491 and MYC targets. (NES) Normalized enrichment score; (FDR) false discovery rate. (E) GO term analysis of the genes that are significantly associated with sensitivity to PHA-767491.
Figure 5.
Figure 5.
CDK9 mediates transcription elongation of MYC targets in MYC-overexpressing cancer cells. (A,B) Chromatin immunoprecipitation combined with quantitative PCR (ChIP-qPCR) performed in human HCC cells expressing CDK9 and MYC shRNAs (A) or treated with PHA-767491 (PHA; 6 h at 4.5 μM) (B), with RNA Pol II antibody and primers located in either the transcription start site (TSS) or the gene body (GB) of NPM1. RNA Pol II occupancy relative to control condition in HepG2 cells is shown. Values are mean + SD from two independent experiments. (C) Pausing index of NPM1 in human HCC cell lines. The pausing index, also known as traveling ratio, was calculated as the ratio between the RNA Pol II bound to the TSS and the RNA Pol II bound to the GB. Values are mean + SD from two independent experiments. Color code and statistics are as in A and B. (D) Quantitative RT–PCR of NPM1 in human HCC cell lines treated with PHA-767491 (16 h at 4.5 μM) or with CDK9 shRNAs. Data are relative to expression in the untreated cells or Renilla-shRNA in HepG2 cells, normalized to the average expression of the housekeeping gene GAPDH. Values are mean + SD from two independent experiments. Color code and statistics are as in A and B. (E,F) PET imaging with 89Zr-transferrin of HepG2 (E) or Alexander (F) tumors with or without 3-d treatment with PHA-767491. (L) Liver; (T) tumor; (trans.) transverse. The color scale for all PET image data shows radiotracer uptake in units of injected dose per gram (%ID/g), with red corresponding to the highest activity, and blue corresponding to the lowest activity.
Figure 6.
Figure 6.
Transcription elongation is required to maintain proliferation in MYC-overexpressing HCC. (A,B) Scatter plot illustrating the correlation between survival with MYC shRNAs and survival with CDK9 shRNAs (A) or CCNT1 shRNAs (B) in mouse (black) and human (blue) cell lines (from Fig. 2E,F). The survival is defined as the ratio of surviving cells in the competitive proliferation assays. In the case of CDK9 and CCNT1, the average of the survival of two different shRNAs was used. (C) Immunoblots showing the effect of MYC overexpression on Ser2 phosphorylation of RNA Pol II in low-MYC-expressing SNU475 and Alexander cells. β-Actin was used as loading control. Values indicate normalized protein levels, normalized with β-actin or RNA Pol II and relative to the levels in HepG2 cells. (D) Pausing index of NPM1 and BRG1 in Alexander cells overexpressing MYC. Pausing index, also known as traveling ratio, was calculated as the ratio between the RNA Pol II bound to the TSS and the RNA Pol II bound to the gene body. Values are mean + SD from two independent experiments. (E) Quantitative RT–PCR of NPM1 and BRG1 in Alexander cells overexpressing MYC. Data are relative to expression in the cells expressing an empty vector, normalized to the average expression of the housekeeping gene GAPDH. Values are mean + SD from two independent experiments. (F) Proliferation rates of PHA-767491 (PHA)-treated cells in C, calculated by measuring the increase in viable cell number after 72 h in culture and fitting data to an exponential growth curve. Results are normalized to the proliferation rate of vehicle (H2O)-treated cells, set to 1. Values are mean ± SD of two independent replicates. The IC50 values are included at the right in micromolar (μM). (G) Scatter plot illustrating the correlation between MYC protein levels and the IC50 of PHA-767491 on the different cell lines (related to C and F).
Figure 7.
Figure 7.
CDK9 is required for initiation and maintenance of MYC-overexpressing liver tumors. (A) Dot plot representation of the number of liver tumors after the hydrodynamic injection of Myc oncogene and the corresponding shRNAs. Bars represent the mean ± SD of five independent mice. (B) Representative bright-field and fluorescent images of the livers in A. Tumors are positive for GFP. (C) Immunoblots showing the knockdown induced by Cdk9 shRNAs in two representative tumors. Cdk9 inhibition leads to a decrease in the levels of phosphorylation of Ser2 of RNA Pol II (pSer2) and mild changes in total RNA Pol II levels (Pol II). β-Actin was used as loading control. (D) Bioluminescent imaging of representative mice orthotopically transplanted with MP1 (Myc;p53−/− murine HCC clone #1) cells harboring the indicated TRMPV-Neo-miR-E shRNAs 8 d after dox treatment. Dox was administered upon disease onset, 7 d after transplant. (E) Quantification of bioluminescent imaging responses with or without dox treatment. Values are mean + SD of six independent tumors. (F) Quantification of the number of Ki67-positive cells per field after analyzing three fields per animal and three animals per condition. Values are mean + SD. (G) Immunoblot showing the effects caused by PHA-767491 in two representative tumors. PHA-767491 treatment leads to a decrease in the levels of phosphorylation of Ser2 of RNA Pol II (pSer2) and mild changes in total RNA Pol II levels (Pol II). β-Actin was used as loading control. (H) Bioluminescent imaging of representative mice orthotopically transplanted with either HepG2 or Alexander HCC cells. PHA-767491 was administered upon disease onset (considered as day 0), 28 d after transplant. Days 3 and 24 of treatment are shown. (I) Quantification of bioluminescent imaging responses with or without PHA-767491 treatment. Values are mean + SD of seven or eight independent tumors. (J) Quantification of the number of Ki67-positive cells per field after analyzing three fields per animal and three animals per condition. Values are mean + SD.

References

    1. Ashworth A, Bernards R. 2010. Using functional genetics to understand breast cancer biology. Cold Spring Harb Perspect Biol 2: a003327. - PMC - PubMed
    1. Barretina J, Caponigro G, Stransky N, Venkatesan K, Margolin AA, Kim S, Wilson CJ, Lehar J, Kryukov GV, Sonkin D, et al. . 2012. The Cancer Cell Line Encyclopedia enables predictive modelling of anticancer drug sensitivity. Nature 483: 603–607 - PMC - PubMed
    1. Beroukhim R, Mermel CH, Porter D, Wei G, Raychaudhuri S, Donovan J, Barretina J, Boehm JS, Dobson J, Urashima M, et al. . 2010. The landscape of somatic copy-number alteration across human cancers. Nature 463: 899–905 - PMC - PubMed
    1. Bisgrove DA, Mahmoudi T, Henklein P, Verdin E. 2007. Conserved P-TEFb-interacting domain of BRD4 inhibits HIV transcription. Proc Natl Acad Sci 104: 13690–13695 - PMC - PubMed
    1. Bracken AP, Dietrich N, Pasini D, Hansen KH, Helin K. 2006. Genome-wide mapping of Polycomb target genes unravels their roles in cell fate transitions. Genes Dev 20: 1123–1136 - PMC - PubMed

Publication types

MeSH terms

Substances