. 2014 Oct 15;592(20):4575-89.
doi: 10.1113/jphysiol.2014.275545. Epub 2014 Aug 15.

PGC1-α over-expression prevents metabolic alterations and soleus muscle atrophy in hindlimb unloaded mice

Affiliations

PGC1-α over-expression prevents metabolic alterations and soleus muscle atrophy in hindlimb unloaded mice

Jessica Cannavino et al. J Physiol. .

Abstract

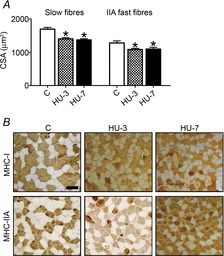
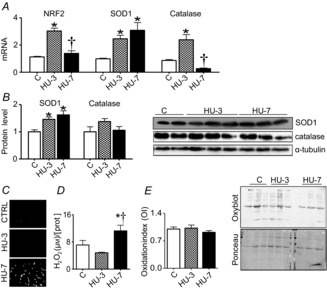
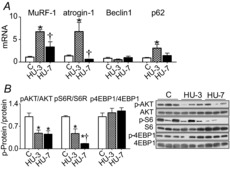
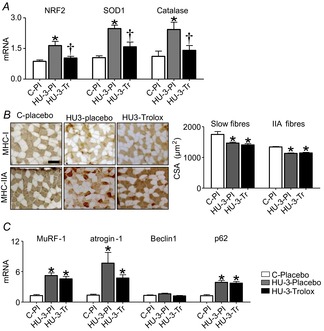
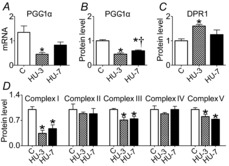
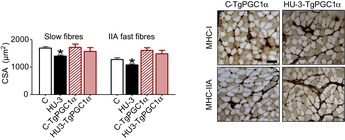
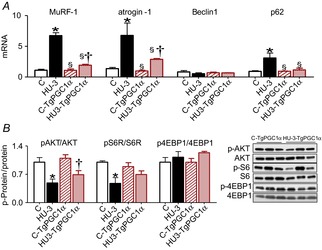
Prolonged skeletal muscle inactivity causes muscle fibre atrophy. Redox imbalance has been considered one of the major triggers of skeletal muscle disuse atrophy, but whether redox imbalance is actually the major cause or simply a consequence of muscle disuse remains of debate. Here we hypothesized that a metabolic stress mediated by PGC-1α down-regulation plays a major role in disuse atrophy. First we studied the adaptations of soleus to mice hindlimb unloading (HU) in the early phase of disuse (3 and 7 days of HU) with and without antioxidant treatment (trolox). HU caused a reduction in cross-sectional area, redox status alteration (NRF2, SOD1 and catalase up-regulation), and induction of the ubiquitin proteasome system (MuRF-1 and atrogin-1 mRNA up-regulation) and autophagy (Beclin1 and p62 mRNA up-regulation). Trolox completely prevented the induction of NRF2, SOD1 and catalase mRNAs, but not atrophy or induction of catabolic systems in unloaded muscles, suggesting that oxidative stress is not a major cause of disuse atrophy. HU mice showed a marked alteration of oxidative metabolism. PGC-1α and mitochondrial complexes were down-regulated and DRP1 was up-regulated. To define the link between mitochondrial dysfunction and disuse muscle atrophy we unloaded mice overexpressing PGC-1α. Transgenic PGC-1α animals did not show metabolic alteration during unloading, preserving muscle size through the reduction of autophagy and proteasome degradation. Our results indicate that mitochondrial dysfunction plays a major role in disuse atrophy and that compounds inducing PGC-1α expression could be useful to treat/prevent muscle atrophy.


Figures

Figure 1
Figure 1. CSA is reduced in soleus in the early phases of HU
A, mean (±SEM) CSA of slow and fast fibres of soleus in control (C) and following 3 (HU-3) and 7 (HU-7) days of unloading; *significantly different from control (P < 0.05). B, representative cross-cryosections of soleus muscles using anti-MHC-I (BA-F8) and anti-MHC-IIA (SC-71) monoclonal antibodies. Scale bar: 100 μm.
Figure 2
Figure 2. Redox imbalance occurs in soleus muscle following HU
A, quantification of mRNA levels of NRF2, SOD1 and catalase by real-time PCR. B, quantification of protein levels of SOD1 and catalase by Western blot. C, superoxides accumulation on muscle cryosections stained with fluorescent dye DHE. D, H2O2 concentration. E, level of protein carbonylation in muscle by oxidation index and relative oxyblot. C, control; HU-3, 3 days of hindlimb unloading; HU-7, 7 days of hindlimb unloading. In A, B, D and E: *significantly different from C (P < 0.05); †significantly different from HU-3 (P < 0.05). Data are presented as means ± SEM.
Figure 3
Figure 3. Catabolic pathways are induced and protein synthesis is reduced in soleus muscle in the early phases of HU
A, quantification of mRNA levels of MuRF-1 and atrogin-1 (ubiquitin proteasome system) and of Beclin1 and p62 (autophagy system) by real-time PCR. B, activity levels of AKT, S6R and 4EBP1 by Western blot analysis of the ratio between the content in the phosphorylated (p) and total forms. C, control; HU-3, 3 days of hindlimb unloading; HU-7, 7 days of hindlimb unloading. *Significantly different from C (P < 0.05); †significantly different from HU-3 (P < 0.05). Data are presented as means ± SEM.
Figure 4
Figure 4. Antioxidant treatment does not prevent catabolic systems induction and atrophy in the early phases of HU
A, quantification of mRNA levels of NRF2, SOD1 and catalase by real-time PCR. B, Cross-cryosections of soleus muscles using anti-MHC-I (BA-F8) and anti-MHC-IIA (SC-71) monoclonal antibodies and relative CSA measurements. C, quantification of mRNA of MuRF-1, atrogin-1 (ubiquitin proteasome system), Beclin1 and p62 (autophagy system) by real-time PCR. C-Pl, placebo control; HU-3-Pl, placebo 3 days of hindlimb unloading; HU-3-Tr, Trolox 3 days of hindlimb unloading. *Significantly different from C-placebo (P < 0.05); †significantly different from HU-3-Pl (P < 0.05). Data are presented as means ± SEM.
Figure 5
Figure 5. Mitochondrial dysfunction is established early during HU in soleus muscle
A, quantification of mRNA levels of PGC-1α by real-time PCR. B, quantification of protein levels of PGC-1α by Western blot. C, quantification of protein levels of DRP1 involved in fission machinery by Western blot. D, quantification of protein levels of mitochondrial complexes by Western blot. C, control; HU-3, 3 days of hindlimb unloading; HU-7, 7 days of hindlimb unloading. *Significantly different from control (P < 0.05); †significantly different from HU-3 (P < 0.05). Data are presented as means ± SEM.
Figure 6
Figure 6. Increased PGC-1α expression in muscle prevents muscle atrophy during HU
CSA of slow and fast fibres of soleus stained anti-MHC-I (BA-F8) and anti-MHC-IIA (SC-71) monoclonal antibodies and relative measurements of CSA. Scale bar: 100 μm. C, control, wild type; HU-3, 3 days of hindlimb unloading, wild type; C-TgPGC-1α, control, transgenic PGC-1α; HU3-TgPGC-1α, 3 days of hindlimb unloading, transgenic PGC-1α. *Significantly different from control (P < 0.05). Data are presented as means ± SEM.
Figure 7
Figure 7. Increased PGC-1α expression in muscle prevents the activation of catabolic systems and mitigates decrease of protein synthesis
A, quantification of mRNA levels of MuRF-1 and atrogin-1 (ubiquitin proteasome system) and of Beclin1 and p62 (autophagy system) by real-time PCR. B, activity levels of AKT, S6R and 4EBP1 by Western blot analysis of the ratio between the content in the phosphorylated (p) and total forms. C, control, wild type; HU-3, 3 days of hindlimb unloading, wild type; C-TgPGC-1α, control, transgenic PGC-1α; HU3-TgPGC-1α, 3 days of hindlimb unloading, transgenic PGC-1α. *Significantly different from control (P < 0.05); §significantly different from HU-3 (P < 0.05); †significantly different from C-TgPGC-1α (P < 0.05). Data are presented as means ± SEM.

Comment in

References

    1. Alford EK, Roy RR, Hodgson JA, Edgerton VR. Electromyography of rat soleus, medial gastrocnemius, and tibialis anterior during hind limb suspension. Exp Neurol. 1987;96:635–649. - PubMed
    1. Anderson R, Prolla T. PGC-1α in aging and anti-aging interventions. Biochim Biophys Acta. 2009;1790:1059–1066. - PMC - PubMed
    1. Andrianjafiniony T, Dupre-Aucouturier S, Letexier D, Couchoux H, Desplanches D. Oxidative stress, apoptosis, and proteolysis in skeletal muscle repair after unloading. Am J Physiol Cell Physiol. 2010;299:C307–C315. - PubMed
    1. Baird L, Dinkova-Kostova AT. The cytoprotective role of the Keap1-Nrf2 pathway. Arch Toxicol. 2011;85:241–272. - PubMed
    1. Balasubramanian VP, Varkey B. Chronic obstructive pulmonary disease: effects beyond the lungs. Curr Opin Pulm Med. 2006;12:106–112. - PubMed

Publication types

MeSH terms

Substances