. 2014 Nov 1;592(21):4639-55.
doi: 10.1113/jphysiol.2014.278127. Epub 2014 Aug 15.

Catecholamine exocytosis during low frequency stimulation in mouse adrenal chromaffin cells is primarily asynchronous and controlled by the novel mechanism of Ca2+ syntilla suppression

Affiliations

Catecholamine exocytosis during low frequency stimulation in mouse adrenal chromaffin cells is primarily asynchronous and controlled by the novel mechanism of Ca2+ syntilla suppression

Jason J Lefkowitz et al. J Physiol. .

Abstract

Adrenal chromaffin cells (ACCs), stimulated by the splanchnic nerve, generate action potentials (APs) at a frequency near 0.5 Hz in the resting physiological state, at times described as 'rest and digest'. How such low frequency stimulation in turn elicits sufficient catecholamine exocytosis to set basal sympathetic tone is not readily explained by the classical mechanism of stimulus-secretion coupling, where exocytosis is synchronized to AP-induced Ca(2+) influx. By using simulated action potentials (sAPs) at 0.5 Hz in isolated patch-clamped mouse ACCs, we show here that less than 10% of all catecholaminergic exocytosis, measured by carbon fibre amperometry, is synchronized to an AP. The asynchronous phase, the dominant phase, of exocytosis does not require Ca(2+) influx. Furthermore, increased asynchronous exocytosis is accompanied by an AP-dependent decrease in frequency of Ca(2+) syntillas (i.e. transient, focal Ca(2+) release from internal stores) and is ryanodine sensitive. We propose a mechanism of disinhibition, wherein APs suppress Ca(2+) syntillas, which themselves inhibit exocytosis as they do in the case of spontaneous catecholaminergic exocytosis.


Figures

Figure 1
Figure 1. Detection of catecholamine exocytosis and two sources of cytosolic Ca2+ in mouse ACCs
A, representative sAP and the elicited Na+ current (INa) and Ca2+ current (ICa) in a freshly isolated mouse chromaffin cell at a holding potential of −80 mV. sAPs were composed of a three step ramp as follows (start potential (mV), end potential (mV), duration (ms)): −80, 50, 2.5; 50, −90, 2.5; −90, −80, 2.5. B, representative Ca2+ syntilla arising from ryanodine-sensitive intracellular stores imaged at 50 Hz with Fluo-3 Ca2+ indicator dye from a freshly isolated mouse ACC and rendered on a pseudo-colour scale as change in fluorescence over baseline (ΔF/F0). Scale bar, 1 μm. The image of the entire ACC was fitted with a black mask for background contrast. C, representative amperometric records of catecholamine release from individual vesicles with and without stimulation by sAPs at 0.5 Hz from the same ACC. (Small hash marks occurring regularly at 0.5 Hz on amperometric traces during stimulation are artifacts indicating the onset of an sAP.) D, individual amperometric event types magnified. SAFs at left indicate ‘kiss and run’ exocytosis, while spikes (middle) can represent full fusion or ‘kiss and run’. Some spikes are preceded by a foot (right). An artifact is shown in the current trace of the spike on the right, which indicates the onset time of an sAP.
Figure 2
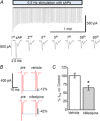
Figure 2. sAPs evoke Na+ and Ca2+ currents identical to native action potentials in freshly isolated mouse ACCs
A (top), representative current trace generated from a train of sAPs delivered at 0.5 Hz for 2 min. (Bottom) Na+ current typically attenuates during the first 5–7 sAPs, while the Ca2+ current remains constant throughout the entire 2 min of stimulation (e.g. −208.1 ± 18.8 pA at the 5th sAP vs. −186.6 ± 15.7 pA at the last sAP; n = 22 cells). The current trace above has been expanded at the location of select sAPs. B, representative current traces elicited by an sAP after 2 min in the presence (bottom panel) and absence (top panel) of 5 μm nifedipine, a dihydropyridine known to selectively inhibit Cav1.2 (L-type) currents in mouse chromaffin cells (Perez-Alvarez et al. 2011). Nifedipine was prepared from a 1000× stock solution in DMSO and applied to the cell by exchanging the bath solution. C, 5 μm nifedipine reduced the starting Ca2+ current evoked by an sAP to 65.2 ± 7% vs. the vehicle (1:1000 dilution of DMSO) which on average did not, 101.2 ± 7% of the starting Ca2+ current (P = 0.012, n = 4). The effects of nifedipine did not wash off after exchanging the bath for 2 min with the normal external solution. The percentage of starting Ca2+ current after the vehicle wash was 98.3 ± 13% vs. after nifedipine wash, 59.8 ± 13% (P = 0.0885, n = 4).
Figure 3
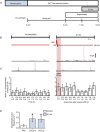
Figure 3. Spontaneous exocytosis and two phases of elicited exocytosis in response to 0.5 Hz sAP stimulation
A, representative traces of amperometric events from two cells unstimulated (left) and then during stimulation with sAPs at 0.5 Hz for 120 s (right). The upper and lower sets of traces are from two separate cells. On the right the 120 s traces were divided into 60 segments of 2 s and overlaid, such that the onset of each trace is synchronized with the sAP as shown in the schematic above, i.e. 60 segments of 2 s where each starts at the initiation of an sAP. On the left the traces are similarly accumulated but in the absence of stimulation. (Note that the duration of the sAP in the schematic is longer than its actual duration, 7.5 ms (Fig.1A), for purposes of clarity and to indicate its form. The onset of the traces below the schematic begin at the peak of the sAP.) B, right, amperometric events in each 2 s segment were binned into 200 ms increments according to their latency from the last sAP during 0.5 Hz stimulation. The first bin (coloured overlay) contains events within 200 ms of an sAP which are considered as synchronized exocytosis (n = 22 cells, 1320 sAPs, 412 events). Left, control, pre-stimulation data from the same cells from each 2 s sweep were binned into 200 ms intervals beginning at the onset of each sweep, with no sAPs (177 events). C, effect of 0.5 Hz stimulation on asynchronous vs. synchronous release frequency. Events that occurred within 200 ms of an sAP (i.e. synchronous release events) increased from a spontaneous frequency of 0.07 ± 0.02 s−1 (Pre) to 0.25 ± 0.05 s−1 (P = 0.004), while events that occurred after 200 ms of an sAP (i.e. asynchronous events) more than doubled, compared to spontaneous frequency, to 0.15 ± 0.03 s−1 (P = 0.008) (paired t tests corrected for multiple comparisons).
Figure 4
Figure 4. Amperometric latency histograms binned at 15 ms intervals reveal a synchronized burst phase
A, composite amperometric latency histograms from 22 ACCs before stimulation and stimulated at 0.5 Hz with sAPs according to the schematic above. Right, amperometric events in each 2 s segment of a 120 s amperometric trace were binned into 15 ms increments according to their latency from the last sAP during 0.5 Hz stimulation (n = 22 cells, 1320 sAPs, 412 events). Latencies were defined as the time from the peak of the last sAP. A synchronized burst occurs within 60 ms of an sAP (red bars). Left, control, pre-stimulation data from the same cells from each 2 s segment starting at the beginning of a 120 s amperometric trace with no sAPs were binned into 15 ms intervals (177 events). B, effect of 0.5 Hz stimulation on asynchronous and synchronous vs. spontaneous release. The mean number of events per bin that occurred within 60 ms of an sAP (i.e. the synchronous burst) increased from 1.32 ± 0.11 (Pre or spontaneous) to 6.75 ± 2.25 (P = 4.78 × 10−12), while the mean number of events per bin that occurred after 60 ms of an sAP (i.e. asynchronous events) more than doubled, compared to the spontaneous condition, to 2.96 ± 0.1 (P = 3.99 × 10−16) (paired t tests corrected for multiple comparisons). C, amperometric events were similarly binned into 15 ms increments according to their latency from the last sAP during 0.5 Hz stimulation, but in a Ca2+-free external solution (n = 18 cells, 1080 sAPs, 295 events). Note that there is no burst phase.
Figure 5
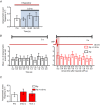
Figure 5. 0.5 Hz sAPs increase exocytosis in the absence of Ca2+ influx
A, experiment schematic. ACCs were patched in normal external solution (with Ca2+). The whole cell configuration was achieved after the chamber was rapidly exchanged (within 3 min) with 30–40 ml of Ca2+-free external solution. The ACC and internal solution were allowed to equilibrate for 5 min and then 2 min amperometric recordings were performed, first in the absence of stimulation, followed by simultaneous stimulation with sAPs at 0.5 Hz. B, representative traces of amperometric events from two cells unstimulated (left) and then during stimulation with sAPs at 0.5 Hz for 120 s (right). The upper and lower sets of traces are from two separate cells. On the right the 120 s traces were divided into 60 segments of 2 s and overlaid, such that the onset of each trace is synchronized with the sAP as shown in the schematic above, i.e. 60 segments of 2 s where each starts at the initiation of an sAP. On the left the traces are similarly accumulated but in the absence of stimulation. C, data from B binned in the same fashion and according to the same conventions as in Fig.2B. Amperometric events in each 2 s segment were binned into 200 ms increments according to their latency from the last sAP during 0.5 Hz stimulation. Right, the first bin (coloured overlay) contains events within 200 ms of an sAP, which are considered as synchronized exocytosis (n = 22 cells, 1320 sAPs, 412 events). Left, control, pre-stimulation data from the same cells from each 2 s sweep were binned into 200 ms intervals beginning at the onset of each sweep, with no sAPs (177 events). D, effect of 0.5 Hz stimulation on asynchronous vs. synchronous release frequency. Events within 200 ms of an sAP increase from 0.047 ± 0.02 s−1 (Pre) to 0.176 ± 0.05 s−1 (P = 0.043); events after 200 ms of an sAP increase to 0.169 ± 0.05 s−1 (P = 0.042) (Bonferroni-corrected, paired sample t tests).
Figure 6
Figure 6. Low frequency stimulation in the presence of ryanodine does not promote additional asynchronous exocytosis compared to the blockade of RyRs alone
A, 0.5 Hz stimulation does not further increase amperometric frequency in the presence of 100 μm ryanodine: P = 0.66 Pre vs. 0–30 s; P = 0.40 Pre vs. 30–60 s; P = 0.66 Pre vs. 60–120 s (n = 14, paired t test). B, effect of ryanodine on asynchronous release. Data from A binned in the same fashion and according to the same conventions as in Fig.2B. C, no additional effect of 0.5 Hz stimulation on asynchronous or synchronous release frequency. Events within 200 ms of an sAP increased from 0.131 ± 0.04 s−1 (Pre) to 0.185 ± 0.05 s−1 (P = 0.311), while events after 200 ms of an sAP increased to 0.15 ± 0.04 s−1 (P = 0.656) (paired sample t tests).
Figure 7
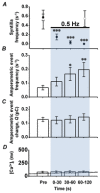
Figure 7. Low frequency stimulation by simulated APs suppresses syntillas and increases exocytosis
A, 0.5 Hz stimulation completely suppresses syntillas within 2 min. Closed circles: syntilla frequency before (Pre) and during stimulation at 0.5 Hz: Pre (0.573 ± 0.07 s−1) vs. 0–30 s (0.15 ± 0.06 s−1), P = 1.55 × 10−6; vs. 30–60 s (0.033 ± 0.03 s−1), P = 1.07 × 10−8; vs. 60–120 s (0 s−1), P = 2.62 × 10−9 (N = 15 cells). Open circles: syntilla frequency in the absence of stimulation at 0 s (0.523 ± 0.2 s−1), 120 s (0.545 ± 0.17 s−1), 7 min (0.591 ± 0.19 s−1, not shown) and 12 min (0.607 ± 0.14 s−1, not shown) (n = 11 cells). B, 0.5 Hz stimulation causes a 3-fold increase in amperometric frequency over the same time course as syntilla suppression. Pairwise comparisons of amperometric frequency were made within each cell and the means were compared: Pre (0.067 ± 0.016 s−1) vs. 0–30 s (0.111 ± 0.032 s−1), P = 0.37; vs. 30–60 s (0.165 ± 0.047 s−1), P = 0.044; Pre vs. 60–120 s (0.197 ± 0.051 s−1), P = 0.008 (n = 22). C, 0.5 Hz stimulation for 2 min does not significantly alter quantal charge, Q, of amperometric events. The mean charge of all amperometric events before and during stimulation from the same 22 cells presented in Fig.1C: Pre vs. 0–30 s, P = 0.865; Pre vs. 30–60 s, P = 0.966; Pre vs. 60–120 s, P = 0.521. D, 0.5 Hz stimulation does not alter mean global [Ca2+]i as detected by Fura-2 dye: pre (81.0 ± 13.4 nm) vs. 0.5 Hz stimulation during 0–30 s (85.6 ± 16.1 nm); 30–60 s (87.3 ± 17.2 nm); 60–120 s (86.1 ± 15.8 nm), P = 0.514, 0.484 and 0.483, respectively, paired t tests (P = 1 after correction for multiple comparisons) (n = 12 cells). A representative trace of the un-averaged global [Ca2+]i is overlaid.
Figure 8
Figure 8. Syntilla suppression by 0.5 Hz sAPs increases exocytosis in the absence of Ca2+ influx
A, 0.5 Hz stimulation effectively suppresses syntillas within 2 min. Syntilla frequency recordings before (Pre) and during stimulation: Pre (1.1 ± 0.14 s−1) vs. 0–30 s (0.1 ± 0.08 s−1), P = 8.42 × 10−10; vs. 30–60 s (0.1 ± 0.08 s−1), P = 8.42 × 10−10; vs. 60–120 s (0.025 ± 0.025 s−1), P = 1.84 × 10−10 (n = 10 cells). B, 0.5 Hz stimulation over the same time course as syntilla suppression increases amperometric frequency in the absence of Ca2+ influx: Pre (0.047 ± 0.02 s−1) vs. 0–30 s (0.239 ± 0.1 s−1), P = 0.016; vs. 30–60 s (0.211 ± 0.07 s−1), P = 0.038; vs. 60–120 s (0.126 ± 0.03 s−1), P = 0.312 (n = 18). C, quantal charge, Q, of amperometric events is significantly altered during the first 30 s of 0.5 Hz stimulation. The mean charge of events from the same 18 cells presented in B over the same time course: Pre (0.057 ± 0.01 pC) vs. 0–30 s (0.14 ± 0.04 pC), P = 0.019; vs. 30–60 s (0.129 ± 0.03 pC), P = 0.209; vs. 60–120 s (0.112 ± 0.03 pC), P = 0.139 (Student's t test).
Figure 9
Figure 9. Model for elicited exocytosis at low frequency, physiological stimulation through syntilla suppression
APs elicit asynchronous or synchronous exocytosis by two separate pathways. During low frequency stimulation the major path for catecholamine secretion is the asynchronous one, accounting for about 90% of exocytosis. This path employs a disinhibition mechanism wherein APs inhibit syntillas, relieving their inhibition on exocytosis, which leads to an increase in the asynchronous phase. APs also elicit synchronized exocytosis, to a lesser extent, via a classical Ca2+ influx pathway (black arrow).

Similar articles

Cited by

References

    1. Becker PL. Fay FS. Photobleaching of fura-2 and its effect on determination of calcium concentrations. Am J Physiol. 1987;253:C613–618. - PubMed
    1. Cannell MB, Cheng H. Lederer WJ. The control of calcium release in heart muscle. Science. 1995;268:1045–1049. - PubMed
    1. Chan SA. Smith C. Physiological stimuli evoke two forms of endocytosis in bovine chromaffin cells. J Physiol. 2001;537:871–885. - PMC - PubMed
    1. Chan SA. Smith C. Low frequency stimulation of mouse adrenal slices reveals a clathrin-independent, protein kinase C-mediated endocytic mechanism. J Physiol. 2003;553:707–717. - PMC - PubMed
    1. Cheng H, Lederer WJ. Cannell MB. Calcium sparks: elementary events underlying excitation–contraction coupling in heart muscle. Science. 1993;262:740–744. - PubMed

Publication types

LinkOut - more resources