

The role of magnetic resonance imaging in diagnosing optic nerve hypoplasia
- PMID: 25128595
- PMCID: PMC4252492
- DOI: 10.1016/j.ajo.2014.08.013
The role of magnetic resonance imaging in diagnosing optic nerve hypoplasia
Abstract
Purpose: To establish objective lower limits of normal optic nerve (ON) size in children based on high-resolution orbital magnetic resonance imaging (MRI).
Design: Case-control study of patients with ON hypoplasia vs normal controls.
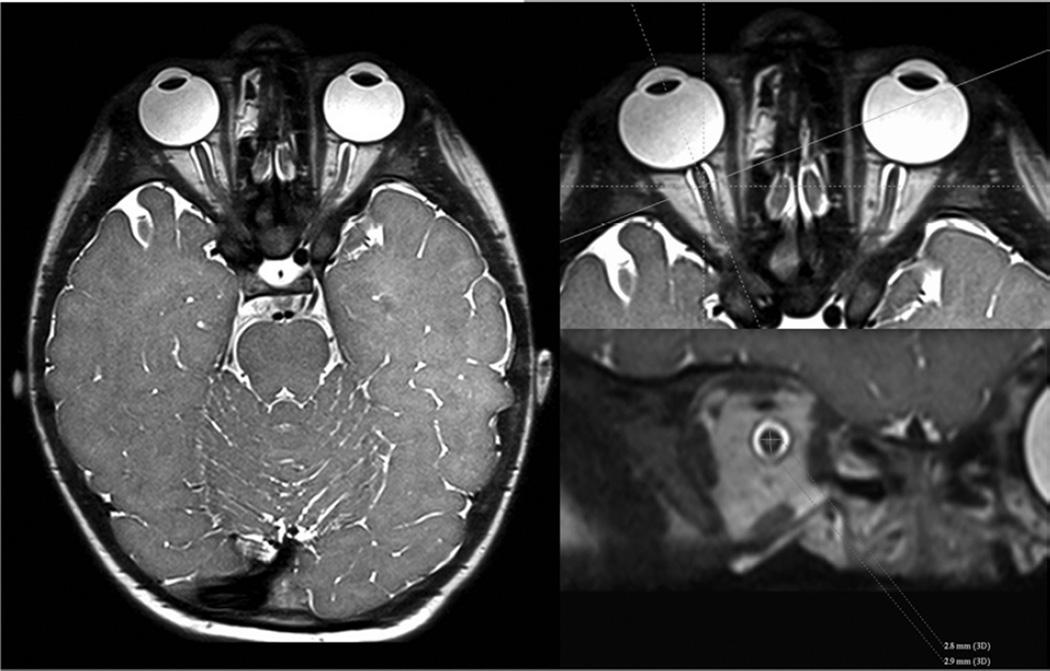
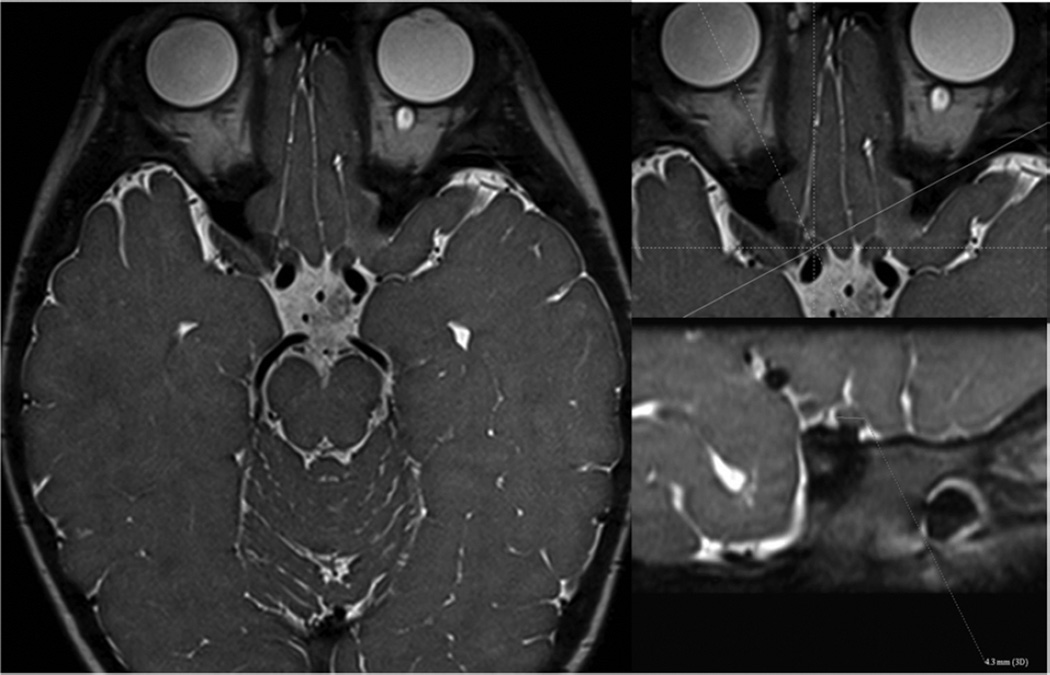
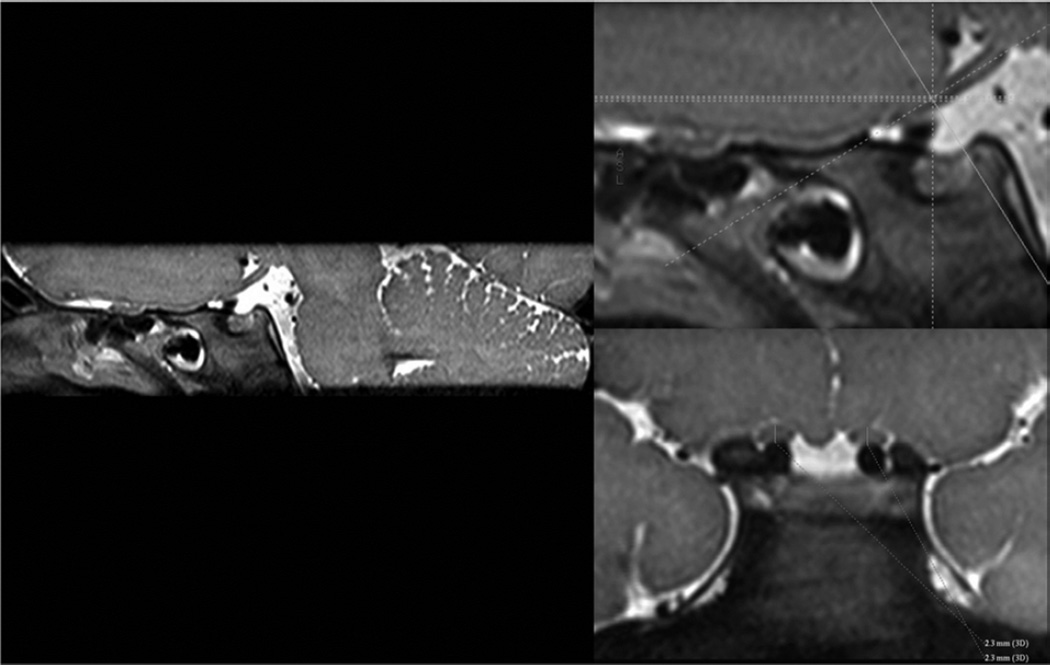
Methods: A neuroradiologist made 4 measurements of each ON at 2 locations (5 mm posterior to the optic disc and just posterior to the optic canal) in patients with ON hypoplasia and controls aged 0-17 years from an academic eye center and children's hospital. Primary analyses were performed using mixed linear models.
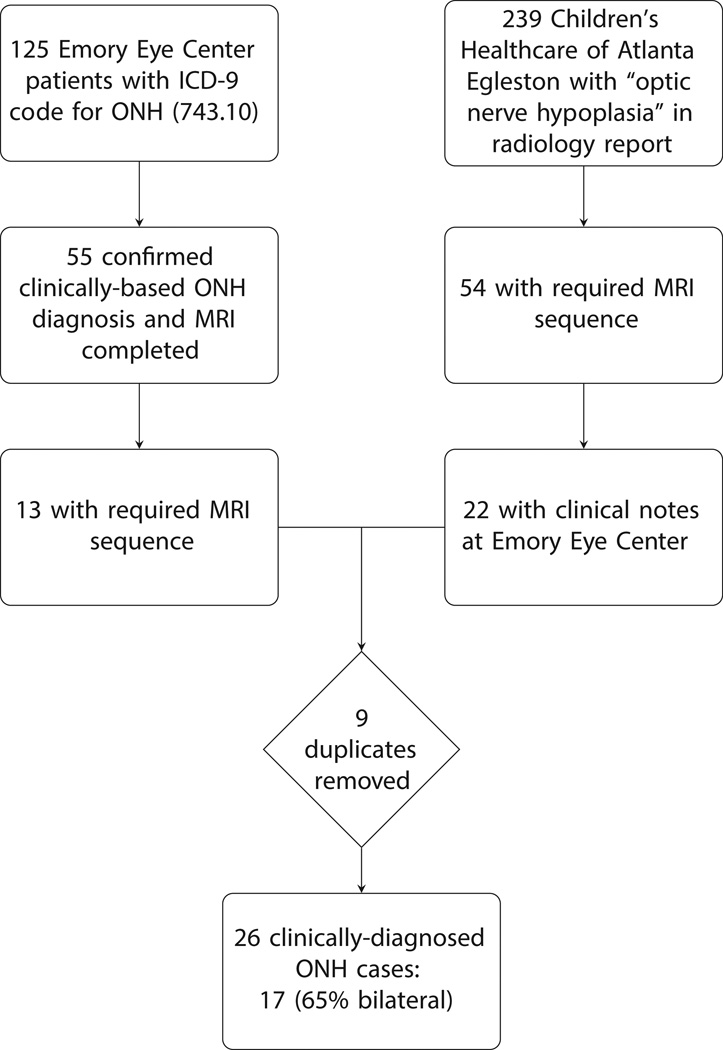
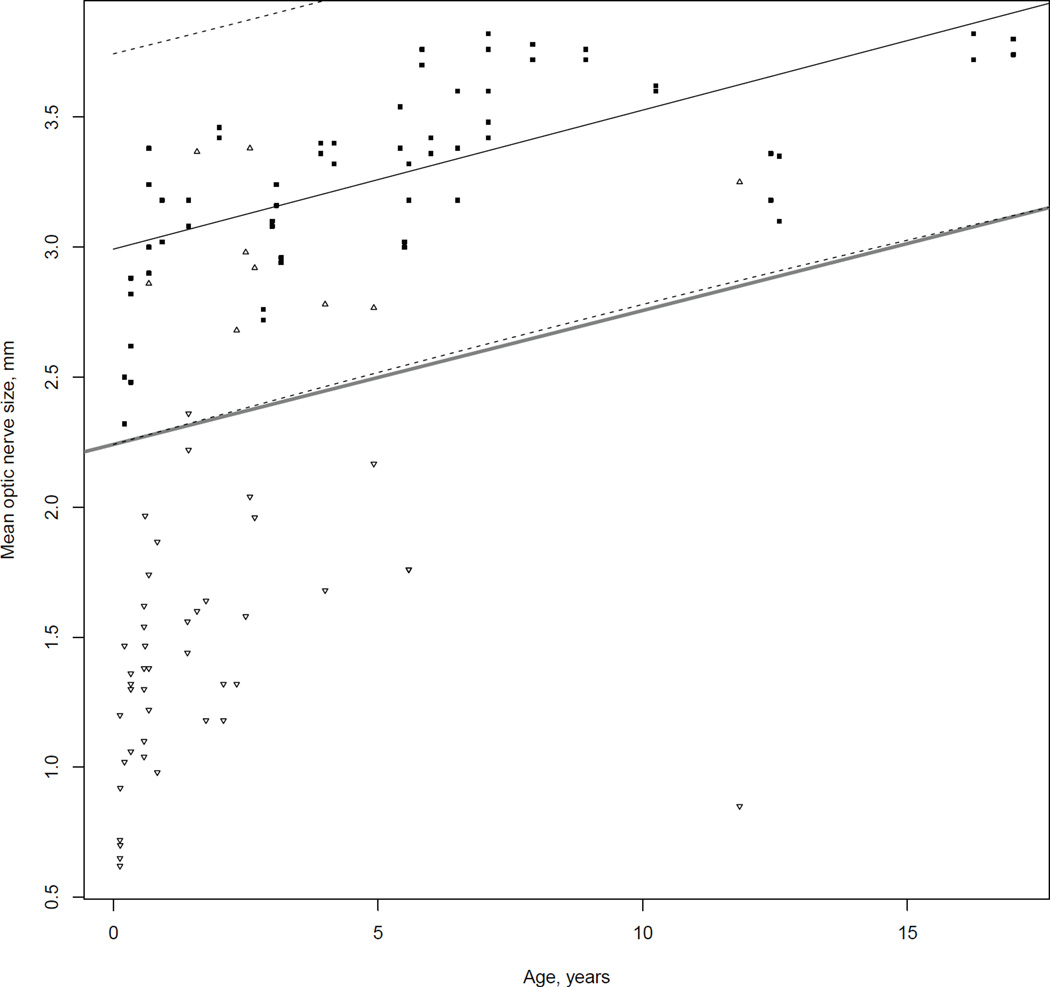
Results: Measurements were made in 26 cases of clinically confirmed ON hypoplasia and 31 controls (median age: ON hypoplasia, 1 year; controls, 5.5 years). Nine of 26 cases (35%) and 19 of 31 controls (61%) underwent high-resolution T2-weighted imaging of the orbits. Mean ON diameter was 1.36 mm (95% CI: 1.19-1.54; P < .001) smaller for clinically hypoplastic ONs than for controls. Optic nerve diameter increased by 0.05 mm per year of age (95% CI: 0.03-0.07; P < .001). A lower bound to the 95% prediction interval for normal optic nerves was (2.24 mm + 0.052 × [age in years]) mm and excluded all but 1 case.
Conclusions: Age was independently associated with normal ON size by MRI and should be taken into consideration when evaluating ON hypoplasia, based on MRI criteria. We have provided a formula to assist clinicians in objectively determining if ON hypoplasia is present.
Copyright © 2014 Elsevier Inc. All rights reserved.
Figures
Similar articles
-
Comparison of Heidelberg Retina Tomograph with disc-macula distance to disc diameter ratio in diagnosing optic nerve hypoplasia.Ophthalmic Physiol Opt. 2016 May;36(3):317-23. doi: 10.1111/opo.12274. Epub 2016 Jan 21. Ophthalmic Physiol Opt. 2016. PMID: 26799143
-
Diagnostic value of magnetic resonance imaging and planimetric measurement of optic disc size in confirming optic nerve hypoplasia.J AAPOS. 1999 Apr;3(2):104-8. doi: 10.1016/s1091-8531(99)70079-0. J AAPOS. 1999. PMID: 10221804
-
Large cups in normal-sized optic discs: a variant of optic nerve hypoplasia in children with periventricular leukomalacia.Arch Ophthalmol. 1997 Oct;115(10):1263-9. doi: 10.1001/archopht.1997.01100160433007. Arch Ophthalmol. 1997. PMID: 9338671
-
Congenital disorders of the optic nerve: excavations and hypoplasia.Eye (Lond). 2004 Nov;18(11):1038-48. doi: 10.1038/sj.eye.6701545. Eye (Lond). 2004. PMID: 15534588 Review.
-
Congenital optic nerve anomalies.Curr Opin Ophthalmol. 1998 Dec;9(6):18-26. doi: 10.1097/00055735-199812000-00004. Curr Opin Ophthalmol. 1998. PMID: 10387331 Review.
Cited by
-
Quantitative characterization of optic nerve atrophy in patients with multiple sclerosis.Mult Scler J Exp Transl Clin. 2017 Sep 13;3(3):2055217317730097. doi: 10.1177/2055217317730097. eCollection 2017 Jul-Sep. Mult Scler J Exp Transl Clin. 2017. PMID: 28932410 Free PMC article.
-
Disruptive SCYL1 Mutations Underlie a Syndrome Characterized by Recurrent Episodes of Liver Failure, Peripheral Neuropathy, Cerebellar Atrophy, and Ataxia.Am J Hum Genet. 2015 Dec 3;97(6):855-61. doi: 10.1016/j.ajhg.2015.10.011. Epub 2015 Nov 12. Am J Hum Genet. 2015. PMID: 26581903 Free PMC article.
-
Neuro-Ophthalmological Manifestations Of Septo-Optic Dysplasia: Current Perspectives.Eye Brain. 2019 Oct 18;11:37-47. doi: 10.2147/EB.S186307. eCollection 2019. Eye Brain. 2019. PMID: 31695544 Free PMC article. Review.
-
Automatic segmentation and quantification of the optic nerve on MRI using a 3D U-Net.J Med Imaging (Bellingham). 2023 May;10(3):034501. doi: 10.1117/1.JMI.10.3.034501. Epub 2023 May 15. J Med Imaging (Bellingham). 2023. PMID: 37197374 Free PMC article.
-
Normal measurements of the optic nerve, optic nerve sheath and optic chiasm in the adult population.SA J Radiol. 2019 Nov 5;23(1):1772. doi: 10.4102/sajr.v23i1.1772. eCollection 2019. SA J Radiol. 2019. PMID: 31754545 Free PMC article.
References
-
- Hatton DD, Schwietz E, Boyer B, Rychwalski P. Babies count: the national registry for children with visual impairments, birth to 3 years. J AAPOS. 2007;11(4):351–355. - PubMed
-
- Kong L, Fry M, Al-Samarraie M, Gilbert C, Steinkuller PG. An update on progress and the changing epidemiology of causes of childhood blindness worldwide. J AAPOS. 2012;16(6):501–507. - PubMed
-
- Lambert S, Hoyt C, Narahara M. Optic nerve hypoplasia. Surv Ophthalmol. 1987;32(1):1–8. - PubMed
-
- Brodsky MC. Congenital optic disc anomalies. In: Brodsky MC, editor. Pediatric Neuro-Ophthalmology. 2nd ed. New York: Springer; 2010. pp. 59–96.
Publication types
MeSH terms
Supplementary concepts
Grants and funding
LinkOut - more resources
Full Text Sources
Other Literature Sources
Medical
Miscellaneous
