

Lung cancer transcriptomes refined with laser capture microdissection
- PMID: 25128906
- PMCID: PMC4215031
- DOI: 10.1016/j.ajpath.2014.06.028
Lung cancer transcriptomes refined with laser capture microdissection
Abstract
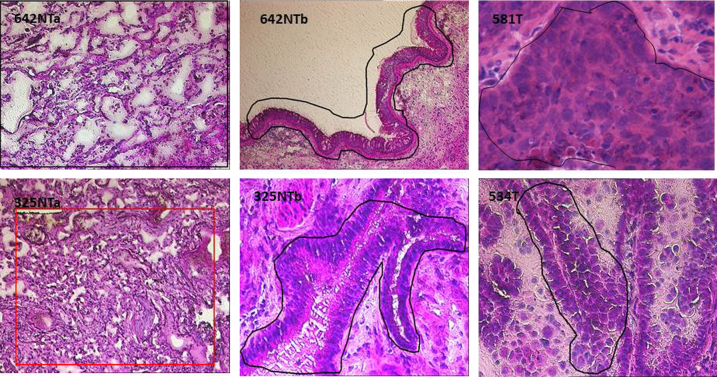
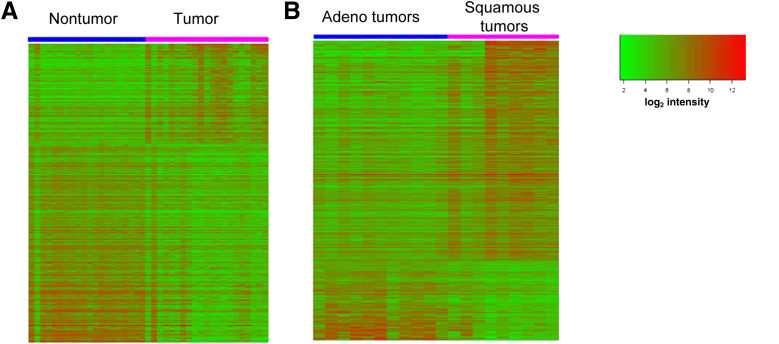
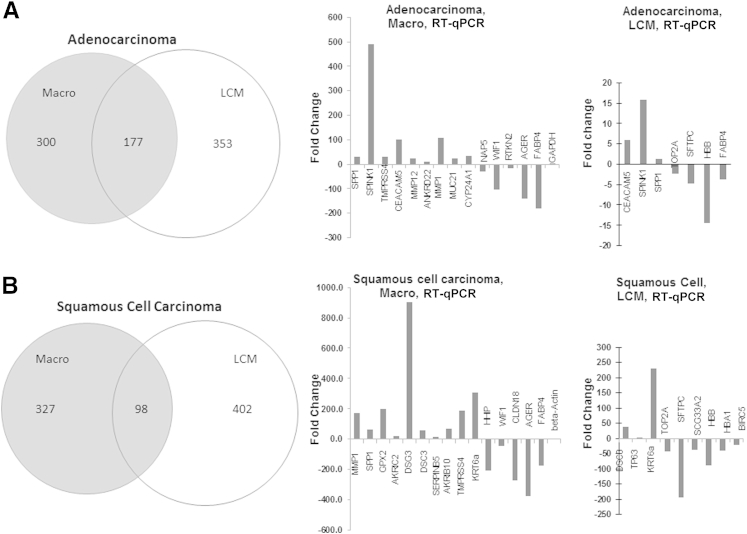
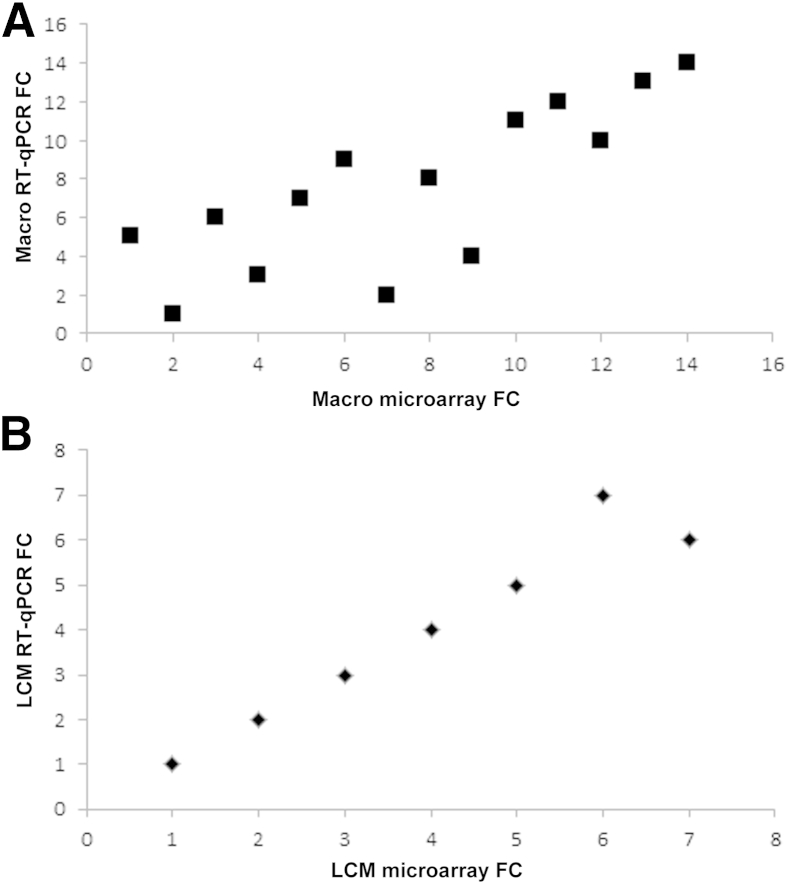
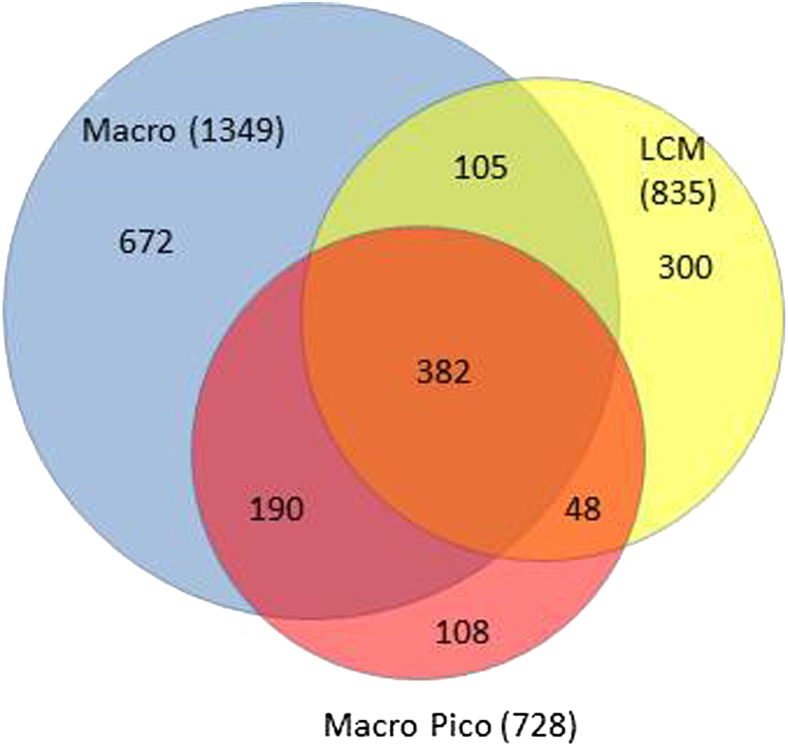
We evaluated the importance of tumor cell selection for generating gene signatures in non-small cell lung cancer. Tumor and nontumor tissue from macroscopically dissected (Macro) surgical specimens (31 pairs from 32 subjects) was homogenized, extracted, amplified, and hybridized to microarrays. Adjacent scout sections were histologically mapped; sets of approximately 1000 tumor cells and nontumor cells (alveolar or bronchial) were procured by laser capture microdissection (LCM). Within histological strata, LCM and Macro specimens exhibited approximately 67% to 80% nonoverlap in differentially expressed (DE) genes. In a representative subset, LCM uniquely identified 300 DE genes in tumor versus nontumor specimens, largely attributable to cell selection; 382 DE genes were common to Macro, Macro with preamplification, and LCM platforms. RT-qPCR validation in a 33-gene subset was confirmatory (ρ = 0.789 to 0.964, P = 0.0013 to 0.0028). Pathway analysis of LCM data suggested alterations in known cancer pathways (cell growth, death, movement, cycle, and signaling components), among others (eg, immune, inflammatory). A unique nine-gene LCM signature had higher tumor-nontumor discriminatory accuracy (100%) than the corresponding Macro signature (87%). Comparison with Cancer Genome Atlas data sets (based on homogenized Macro tissue) revealed both substantial overlap and important differences from LCM specimen results. Thus, cell selection via LCM enhances expression profiling precision, and confirms both known and under-appreciated lung cancer genes and pathways.
Figures
Similar articles
-
Steroid receptor and growth factor receptor expression in human nonsmall cell lung cancers using cells procured by laser-capture microdissection.Adv Exp Med Biol. 2008;617:377-84. doi: 10.1007/978-0-387-69080-3_36. Adv Exp Med Biol. 2008. PMID: 18497061
-
Relationships of ESR1 and XBP1 expression in human breast carcinoma and stromal cells isolated by laser capture microdissection compared to intact breast cancer tissue.Endocrine. 2011 Oct;40(2):212-21. doi: 10.1007/s12020-011-9522-x. Epub 2011 Aug 21. Endocrine. 2011. PMID: 21858728
-
Impact of upfront cellular enrichment by laser capture microdissection on protein and phosphoprotein drug target signaling activation measurements in human lung cancer: Implications for personalized medicine.Proteomics Clin Appl. 2015 Oct;9(9-10):928-37. doi: 10.1002/prca.201400056. Epub 2015 Mar 24. Proteomics Clin Appl. 2015. PMID: 25676683 Free PMC article.
-
Profiling cell-type specific gene expression in post-mortem human brain samples through laser capture microdissection.Methods. 2022 Nov;207:3-10. doi: 10.1016/j.ymeth.2022.08.013. Epub 2022 Sep 3. Methods. 2022. PMID: 36064002 Review.
-
Laser Capture Proteomics: spatial tissue molecular profiling from the bench to personalized medicine.Expert Rev Proteomics. 2021 Oct;18(10):845-861. doi: 10.1080/14789450.2021.1984886. Epub 2021 Dec 14. Expert Rev Proteomics. 2021. PMID: 34607525 Free PMC article. Review.
Cited by
-
CD73 Severed as a Potential Prognostic Marker and Promote Lung Cancer Cells Migration via Enhancing EMT Progression.Front Genet. 2021 Nov 17;12:728200. doi: 10.3389/fgene.2021.728200. eCollection 2021. Front Genet. 2021. PMID: 34868205 Free PMC article.
-
Identifying General Tumor and Specific Lung Cancer Biomarkers by Transcriptomic Analysis.Biology (Basel). 2022 Jul 20;11(7):1082. doi: 10.3390/biology11071082. Biology (Basel). 2022. PMID: 36101460 Free PMC article.
-
Bioinformatics analysis and experimental validation of TTK as a biomarker for prognosis in non-small cell lung cancer.Biosci Rep. 2020 Oct 30;40(10):BSR20202711. doi: 10.1042/BSR20202711. Biosci Rep. 2020. PMID: 32969465 Free PMC article.
-
Identification of key candidate tumor biomarkers in non-small-cell lung cancer by in silico analysis.Oncol Lett. 2020 Jan;19(1):1008-1016. doi: 10.3892/ol.2019.11169. Epub 2019 Dec 2. Oncol Lett. 2020. PMID: 31897214 Free PMC article.
-
Screening and identification of key biomarkers in lung squamous cell carcinoma by bioinformatics analysis.Oncol Lett. 2019 Nov;18(5):5185-5196. doi: 10.3892/ol.2019.10873. Epub 2019 Sep 16. Oncol Lett. 2019. PMID: 31612029 Free PMC article.
References
-
- Klee E.W., Erdogan S., Tillmans L., Kosari F., Sun Z., Wigle D.A., Yang P., Aubry M.C., Vasmatzis G. Impact of sample acquisition and linear amplification on gene expression profiling of lung adenocarcinoma: laser capture micro-dissection cell-sampling versus bulk tissue-sampling. BMC Med Genomics. 2009;2:13. - PMC - PubMed
-
- Rohrbeck A., Neukirchen J., Rosskopf M., Pardillos G.G., Geddert H., Schwalen A., Gabbert H.E., von Haeseler A., Pitschke G., Schott M., Kronenwett R., Haas R., Rohr U.P. Gene expression profiling for molecular distinction and characterization of laser captured primary lung cancers. J Transl Med. 2008;6:69. - PMC - PubMed
-
- Kobayashi K., Nishioka M., Kohno T., Nakamoto M., Maeshima A., Aoyagi K., Sasaki H., Takenoshita S., Sugimura H., Yokota J. Identification of genes whose expression is upregulated in lung adenocarcinoma cells in comparison with type II alveolar cells and bronchiolar epithelial cells in vivo. Oncogene. 2004;23:3089–3096. - PubMed
-
- Selamat S.A., Chung B.S., Girard L., Zhang W., Zhang Y., Campan M., Siegmund K.D., Koss M.N., Hagen J.A., Lam W.L., Lam S., Gazdar A.F., Laird-Offringa I.A. Genome-scale analysis of DNA methylation in lung adenocarcinoma and integration with mRNA expression. Genome Res. 2012;22:1197–1211. - PMC - PubMed
Publication types
MeSH terms
Grants and funding
LinkOut - more resources
Full Text Sources
Other Literature Sources
Medical
Molecular Biology Databases
