

doi: 10.1038/nmeth.3068.
Epub 2014 Aug 17.
Multiplexed aberration measurement for deep tissue imaging in vivo
Affiliations
- PMID: 25128976
- PMCID: PMC4180771
- DOI: 10.1038/nmeth.3068
Item in Clipboard
Multiplexed aberration measurement for deep tissue imaging in vivo
Nat Methods.
2014 Oct.
Abstract
We describe an adaptive optics method that modulates the intensity or phase of light rays at multiple pupil segments in parallel to determine the sample-induced aberration. Applicable to fluorescent protein-labeled structures of arbitrary complexity, it allowed us to obtain diffraction-limited resolution in various samples in vivo. For the strongly scattering mouse brain, a single aberration correction improved structural and functional imaging of fine neuronal processes over a large imaging volume.
Conflict of interest statement
The authors declare no competing financial interests.
Figures
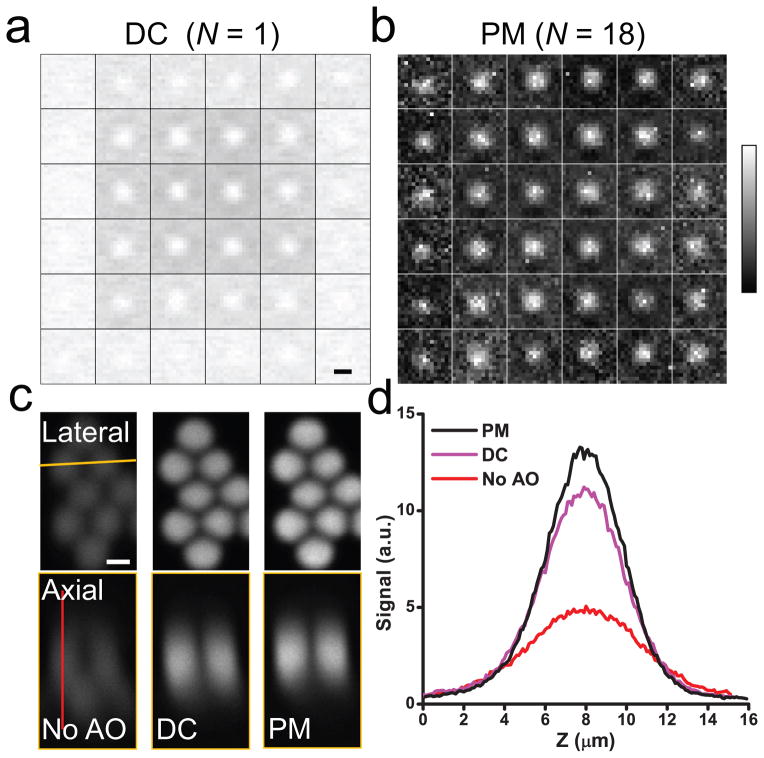
Multiplexed aberration measurement with parallel modulation (PM) of light ray intensity at multiple pupil segments. (a) and (b) “Signal vs. displacement” maps for 36 pupil segments obtained from the DC signal (“DC (N=1)”) and from the Fourier magnitudes (“PM (N=18)”, 18 pupil segments modulated simultaneously with DMD), respectively. Each map is normalized between 0 and its maximum. (c) Lateral and axial (along the yellow line) images of 2-μm-diameter beads obtained without AO, with the corrective wavefront from the DC method (“DC”), and with the corrective wavefront from the multiplexed method (“PM”), respectively. (d) Signal profiles along the red line in c. Scale bar: 2 μm.
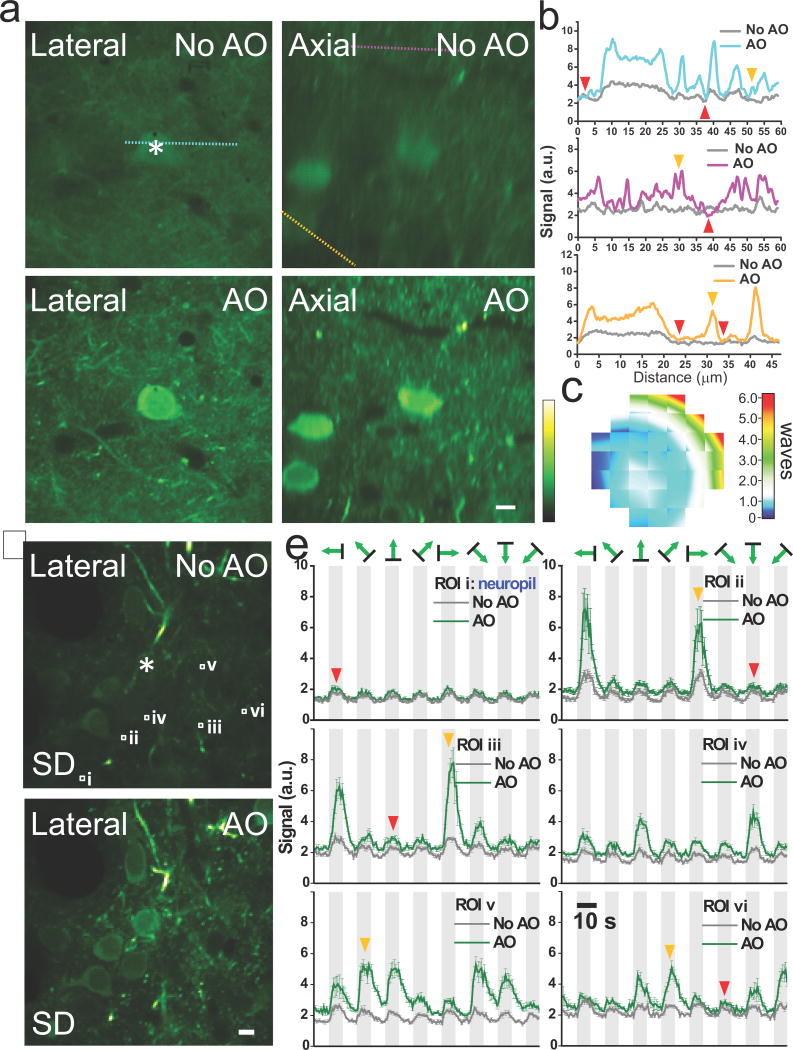
AO correction with multiplexed aberration measurement at layer 2/3 of a GCaMP6s-expressing mouse brain in vivo. (a) Lateral and axial images at 115 μm below dura without and with AO correction. (b) Signal profiles along the cyan, purple, and orange lines in a. Orange arrowheads label the structures rendered invisible by the diffusely-labeled background (red arrowheads). (c) Corrective wavefront in units of waves. (d) Lateral images at 150 μm depth without and with AO correction. Pixel brightness reflects the standard deviation (SD) of pixel values across 800 calcium imaging frames, with larger SD values indicating higher neuronal activity. (e) Fluorescent signals reflecting calcium transients measured without (dark gray curves) and with (green curves) AO correction at 6 regions of interest (ROIs) (white squares i–vi in d) under visual stimulations of gratings moving in eight different directions. Orange arrowheads mark the example responses from dendrites at the preferred directions of grating motion, while the red arrowheads label example responses dominated by neuropil contamination. Light gray denotes the duration with stimuli on. Signals are averages of five trials of calcium imaging with the error bars indicating the standard errors of the mean. Signals at the asterisks were used to measure aberration through multiplexed intensity modulation via DMD. Greenhot lookup table in ImageJ is used for all images. Scale bar: 10 μm.
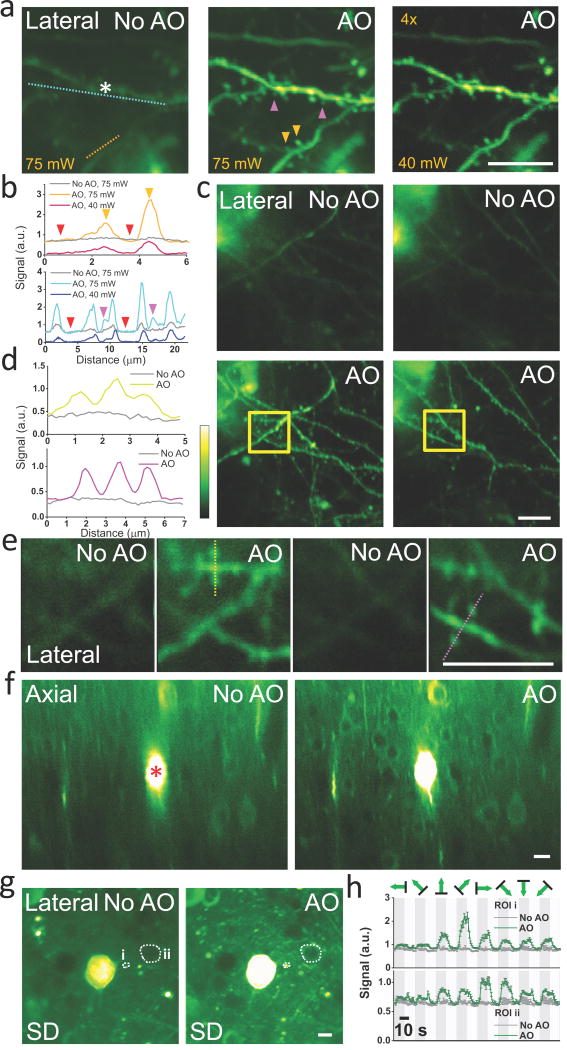
AO correction with multiplexed aberration measurement at layers 4 and 5 of the mouse brain in vivo. (a) Maximal intensity projections of dendrites at 376–395 μm below dura measured without and with AO at excitation powers 75 mW and 40 mW, respectively. The gain of the image taken at 40 mW is increased 4×. (b) Line intensity profiles along the orange and cyan lines in a. Purple and orange arrowheads label dendritic spines invisible before AO correction. Red arrowheads indicate the out-of-focus background level at 75 mW excitation. (c) Maximal intensity projections of basal dendrites at 473–481 μm (left column) and 481–490 μm (right column) measured without and with AO correction. (d) Line intensity profiles along the yellow and violet lines in e. (e) Images taken inside the yellow squares in c at 480 μm (left) and 484 μm (right) depths without and with AO correction. (f) Axial images at 427–547 μm depth measured without and with AO. (g) From f, lateral images at 490 μm depth without and with AO correction. Pixel brightness reflects the SD of pixel values across 800 calcium imaging frames. (h) Calcium transients measured without (dark gray curves) and with (green curves) AO correction at the two ROIs in g (ROI1: i, dendrite; ROI2: ii, soma). a,f, corrective wavefront was measured at the asterisk; c, correction was at 30 μm above the imaging volume. a,c, phase modulation with SDM; f, intensity modulation with SDM. a–e, thy1-YFP-H mice; f–h, wild-type mouse expressing GCaMP6s. Greenhot lookup table in ImageJ is used for all images. Scale bar: 10 μm.
References
-
- Kubby J, editor. Adaptive Optics for Biological Imaging. CRC Press; 2013.
-
- Milkie DE, Betzig E, Ji N. Opt Lett. 2011;36:4206–4208. - PubMed
-
- Ji N, Milkie DE, Betzig E. Nat Methods. 2010;7:141–147. - PubMed
-
- Liu R, Milkie DE, Kerlin A, MacLennan B, Ji N. Opt Express. 2014;22:1619–1628. - PubMed
-
- Bridges WB, et al. Appl Opt. 1974;13:291–300. - PubMed
Publication types
MeSH terms
Substances
Grants and funding
LinkOut - more resources
Full Text Sources
Other Literature Sources
Molecular Biology Databases
