

Collective and individual migration following the epithelial-mesenchymal transition
- PMID: 25129619
- PMCID: PMC4209198
- DOI: 10.1038/nmat4062
Collective and individual migration following the epithelial-mesenchymal transition
Abstract
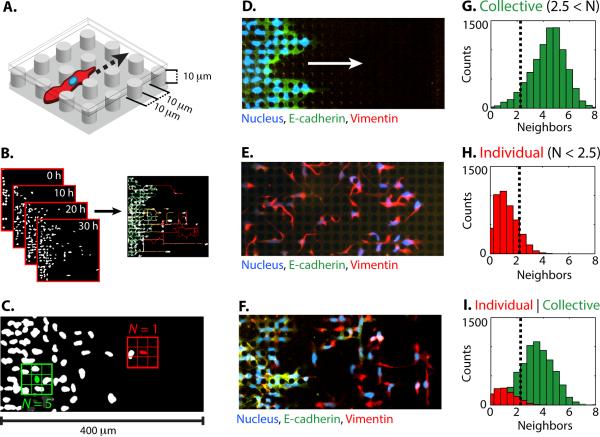
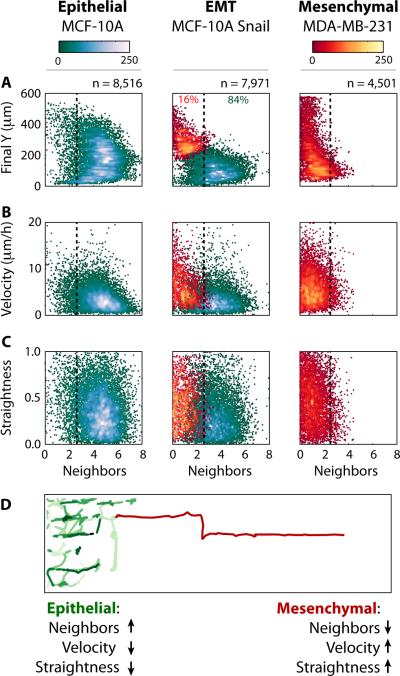
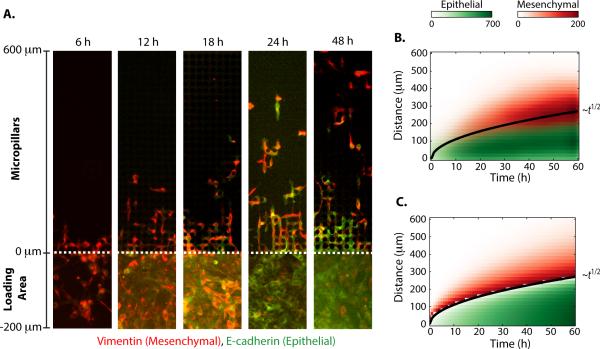
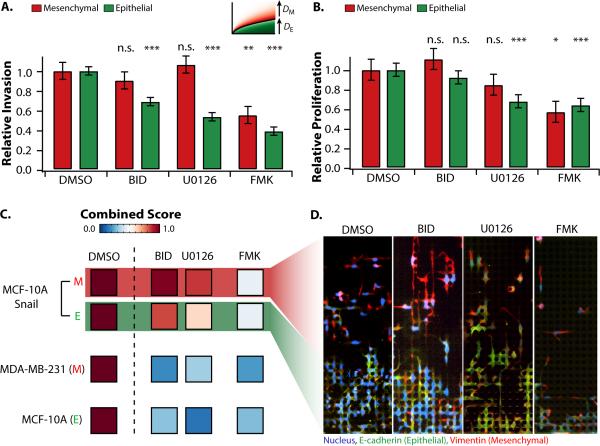
During cancer progression, malignant cells in the tumour invade surrounding tissues. This transformation of adherent cells to a motile phenotype has been associated with the epithelial-mesenchymal transition (EMT). Here, we show that EMT-activated cells migrate through micropillar arrays as a collectively advancing front that scatters individual cells. Individual cells with few neighbours dispersed with fast, straight trajectories, whereas cells that encountered many neighbours migrated collectively with epithelial biomarkers. We modelled these emergent dynamics using a physical analogy to phase transitions during binary-mixture solidification, and validated it using drug perturbations, which revealed that individually migrating cells exhibit diminished chemosensitivity. Our measurements also indicate a degree of phenotypic plasticity as cells interconvert between individual and collective migration. The study of multicellular behaviours with single-cell resolution should enable further quantitative insights into heterogeneous tumour invasion.
Figures
Similar articles
-
A common framework for EMT and collective cell migration.Development. 2016 Dec 1;143(23):4291-4300. doi: 10.1242/dev.139071. Development. 2016. PMID: 27899506 Review.
-
A Biophysical Model Uncovers the Size Distribution of Migrating Cell Clusters across Cancer Types.Cancer Res. 2019 Nov 1;79(21):5527-5535. doi: 10.1158/0008-5472.CAN-19-1726. Epub 2019 Sep 3. Cancer Res. 2019. PMID: 31481500
-
Hypoxia Induces a HIF-1-Dependent Transition from Collective-to-Amoeboid Dissemination in Epithelial Cancer Cells.Curr Biol. 2017 Feb 6;27(3):392-400. doi: 10.1016/j.cub.2016.11.057. Epub 2017 Jan 12. Curr Biol. 2017. PMID: 28089517
-
N-cadherin-mediated cell-cell adhesion promotes cell migration in a three-dimensional matrix.J Cell Sci. 2012 Aug 1;125(Pt 15):3661-70. doi: 10.1242/jcs.103861. Epub 2012 Mar 30. J Cell Sci. 2012. PMID: 22467866 Free PMC article.
-
Cadherin profiling for therapeutic interventions in Epithelial Mesenchymal Transition (EMT) and tumorigenesis.Exp Cell Res. 2018 Jul 15;368(2):137-146. doi: 10.1016/j.yexcr.2018.04.014. Epub 2018 Apr 16. Exp Cell Res. 2018. PMID: 29674112 Review.
Cited by
-
Kidney-on-a-Chip: Mechanical Stimulation and Sensor Integration.Sensors (Basel). 2022 Sep 13;22(18):6889. doi: 10.3390/s22186889. Sensors (Basel). 2022. PMID: 36146238 Free PMC article. Review.
-
Morphological single cell profiling of the epithelial-mesenchymal transition.Integr Biol (Camb). 2016 Nov 7;8(11):1133-1144. doi: 10.1039/c6ib00139d. Integr Biol (Camb). 2016. PMID: 27722556 Free PMC article.
-
Microchip Cytometry for Multiplexed Single-Cell Protein Detection in a Low-Resource Setting toward Point of Care Diagnosis.ACS Sens. 2018 Dec 28;3(12):2604-2612. doi: 10.1021/acssensors.8b01015. Epub 2018 Nov 27. ACS Sens. 2018. PMID: 30421607 Free PMC article.
-
Chronic Leptin Treatment Induces Epithelial-Mesenchymal Transition in MCF10A Mammary Epithelial Cells.J Mammary Gland Biol Neoplasia. 2022 Mar;27(1):19-36. doi: 10.1007/s10911-022-09515-9. Epub 2022 Feb 23. J Mammary Gland Biol Neoplasia. 2022. PMID: 35195812
-
Motility-driven glass and jamming transitions in biological tissues.Phys Rev X. 2016 Apr-Jun;6(2):021011. doi: 10.1103/PhysRevX.6.021011. Epub 2016 Apr 21. Phys Rev X. 2016. PMID: 28966874 Free PMC article.
References
-
- Fidler IJ, Hart IR. Biological diversity in metastatic neoplasms: origins and implications. Science. 1982;217:998–1003. - PubMed
-
- Willis RA. The spread of tumours in the human body. 3d edn Butterworths; 1973.
-
- Thiery JP, Acloque H, Huang RYJ, Nieto MA. Epithelial-Mesenchymal Transitions in Development and Disease. Cell. 2009;139:871–890. doi:10.1016/j.cell.2009.11.007. - PubMed
-
- Polyak K, Weinberg RA. Transitions between epithelial and mesenchymal states: acquisition of malignant and stem cell traits. Nat Rev Cancer. 2009;9:265–273. doi:10.1038/nrc2620. - PubMed
-
- Yilmaz M, Christofori G. EMT, the cytoskeleton, and cancer cell invasion. Cancer Metastasis Rev. 2009;28:15–33. doi:10.1007/s10555-008-9169-0. - PubMed
Publication types
MeSH terms
Grants and funding
LinkOut - more resources
Full Text Sources
Other Literature Sources
