Review
. 2014 Sep;39(9):381-99.
doi: 10.1016/j.tibs.2014.07.002. Epub 2014 Aug 14.

Absence of a simple code: how transcription factors read the genome

Affiliations
Review

Absence of a simple code: how transcription factors read the genome

Matthew Slattery et al. Trends Biochem Sci. 2014 Sep.

Abstract

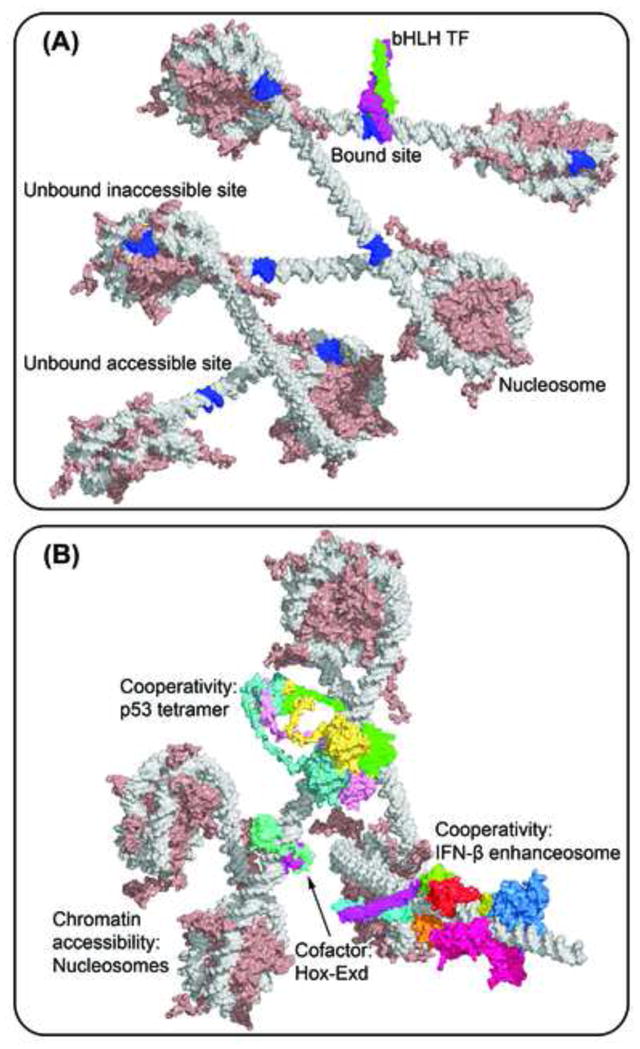
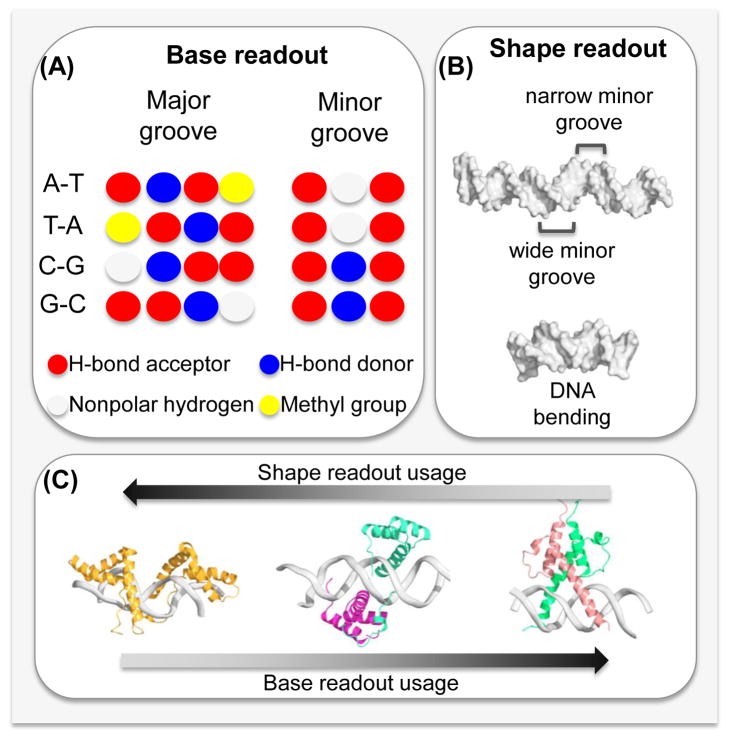
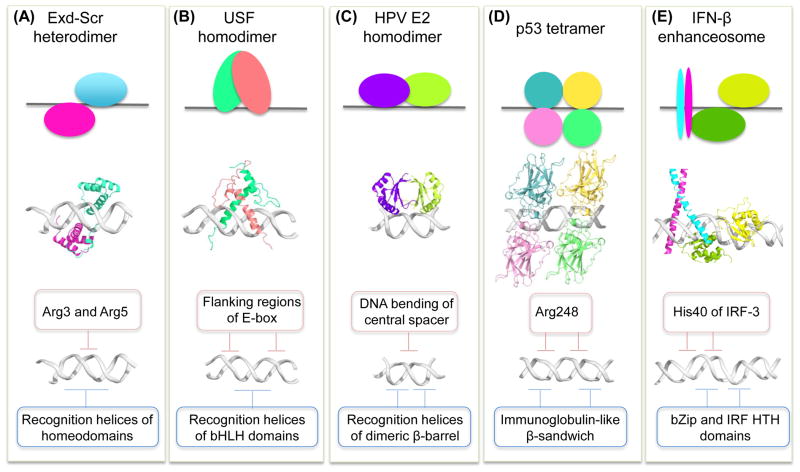
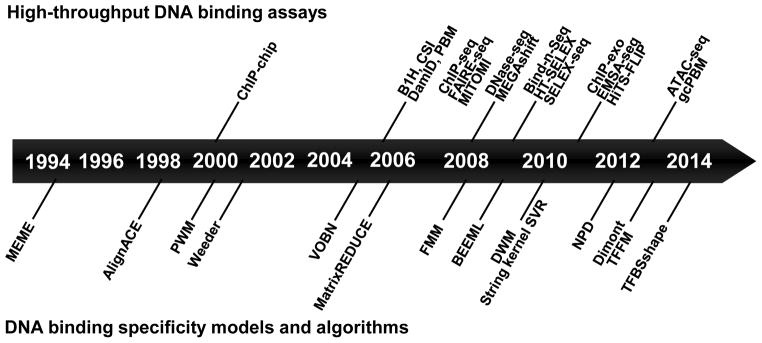
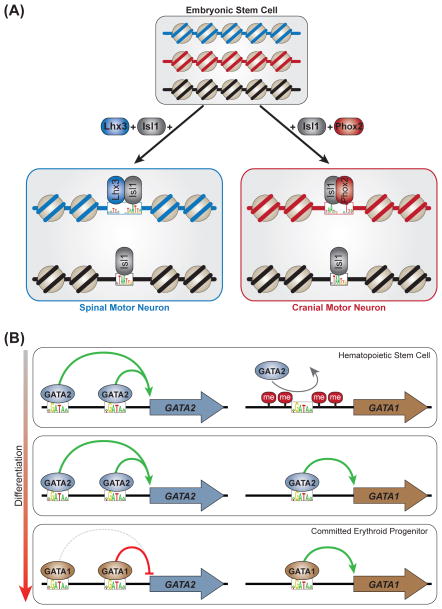
Transcription factors (TFs) influence cell fate by interpreting the regulatory DNA within a genome. TFs recognize DNA in a specific manner; the mechanisms underlying this specificity have been identified for many TFs based on 3D structures of protein-DNA complexes. More recently, structural views have been complemented with data from high-throughput in vitro and in vivo explorations of the DNA-binding preferences of many TFs. Together, these approaches have greatly expanded our understanding of TF-DNA interactions. However, the mechanisms by which TFs select in vivo binding sites and alter gene expression remain unclear. Recent work has highlighted the many variables that influence TF-DNA binding, while demonstrating that a biophysical understanding of these many factors will be central to understanding TF function.

Keywords: DNA binding specificity models; chromatin; cofactor; cooperativity; high-throughput binding assays; protein-DNA recognition.


Figures

Figure 1
Figure 1. Structure-based illustration of multiple levels of TF-DNA binding specificity
(A) The basic helix-loop-helix (bHLH) Mad-Max heterodimer (PDB ID 1nlw) binds to only a subset of putative binding sites (blue). Some TFBSs are inaccessible due to nucleosome formation (PDB ID 1kx5), while other accessible TFBSs are not selected by the TF. (B) Higher-order determinants of TF binding include cooperativity with cofactors (e.g., Hox-Exd heterodimer; PDB ID 2r5z), multimeric binding (e.g., p53 tetramer; modeled based on PDB IDs 2ady and 1aie [228]), cooperativity through TF-TF interactions (e.g., IFN-β enhanceosome; modeled based on PDB IDs 1t2k, 2pi0, 2o6g and 2o61 [16]) and chromatin accessibility due to nucleosome formation (PDB ID 1kx5) [229].
Figure 2
Figure 2. Base and shape readout contribute to TF-DNA binding specificity
(A) Base readout describes direct interactions between amino acids and the functional groups of the bases. Whereas the pattern of hydrogen bond acceptors (red) and donors (blue), heterocyclic hydrogen atoms (white) and the hydrophobic methyl group (yellow) is base pair-specific in the major groove, the pattern is degenerate in the minor groove. (B) Shape readout includes any form of structural readout, based on global and local DNA shape features, including conformational flexibility and shape-dependent electrostatic potential. The IFN-β enhanceosome (PDB ID 1t2k; top) varies in minor groove shape. The human papillomavirus E2 protein (PDB ID 1jj4; bottom) binds to a binding site with intrinsic curvature. (C) Most DNA binding proteins use interplay between the base- and shape-readout modes to recognize their DNA binding sites. However, the contribution of each mechanism to binding specificity might vary across TF families. Shape readout dominates for the minor groove-binding HMG box protein (PDB ID 2gzk; left). Base readout is a major contribution in DNA recognition by the bHLH protein Pho4 (PDB ID 1a0a; right). Both readout modes are more or less equally present in the DNA binding of a Hox-Exd heterodimer (PDB ID 2r5z; center).
Figure 3
Figure 3. Interplay of base and shape readout varies among TF families
(A) A heterodimer of the homeodomain proteins (PDB ID 2r5z) Hox protein Sex combs reduced (Scr; cyan; top and center) and its cofactor Extradenticle (Exd; magenta; top and center) binds with its recognition helices through base readout to the major groove (blue box; bottom), whereas arginine residues of the N-terminal Scr linker read minor groove shape and electrostatic potential as a form of shape readout (beige box; bottom). (B) A homodimer of the bHLH protein USF (PDB ID 1an4; green and pink; top and center) binds with its recognition helices through base readout to the E-box core-binding site (blue box; bottom) and recognizes flanking sequences (beige box; bottom) through extended linkers that connect the two α-helices of each USF monomer. (C) The human papillomavirus (HPV) E2 homodimer (PDB ID 1jj4; purple and chartreuse; top and center) recognizes with its recognition helices the half-sites of its binding site through base readout (blue box; bottom), whereas the intrinsic curvature of the central spacer contributes to binding through shape readout (beige box; bottom). (D) The four DBDs of the p53 tetramer (PDB ID 3kz8; cyan, yellow, pink, and green; top and center) bind to the major groove through base readout (blue box; bottom), whereas the Arg248 residues recognize the minor groove through shape readout (beige box; bottom). (E) The c-Jun and ATF-2 TFs (cyan and magenta, respectively; top and center) of the IFN-β enhanceosome (PDB ID 1t2k) recognize the major groove through base readout (blue box; bottom), whereas the adjacent IRF-3 TFs (green and yellow; top and center) use their His40 residues to recognize the minor groove through shape readout (beige box; bottom).
Figure 4
Figure 4. Timeline of genomic approaches for experimental and computational studies of TF-DNA binding specificity
Development of experimental high-throughput DNA binding assays (above timeline axis) and computational DNA binding specificity models and algorithms (below timeline axis). Further examples of these experimental approaches and computational methods are provided in Table 1.
Figure 5
Figure 5. Distinct cis-regulatory structure of unicellular and metazoan model organisms
(A) Percentages of coding and noncoding DNA in select genomes, adapted from [116]. (B) Typical regulatory structure of a Saccharomyces cerevisiae gene, with most regulatory DNA binding sites falling within a few hundred bases of the gene’s TSS. (C) Typical regulatory structure of a human gene, with several clusters of regulatory DNA sites (enhancers) distal to the TSS. For (B) and (C), green dashed lines represent activating regulatory inputs, and red dashed lines represent repressive inputs.
Figure 6
Figure 6. In vitro versus in vivo transcription factor-DNA interactions
(A) Standard and high-throughput in vitro DNA binding assays provide a motif or model representing a TF’s DNA binding preferences. (B) Genomic DNA sequences matching a TF’s in vitro-derived motif represent potential TFBSs. (C) Potential in vivo binding sites determined from a TF’s in vitro-derived motif far outnumber the actual number of in vivo binding sites as measured by ChIP-seq. In general, <5% of potential binding sites are identified as bound in vivo. In addition, in vivo binding strength does not always correlate with motif strength, and not all in vivo binding sites contain the expected motif. Non-DNA variables, such as nucleosomes and cofactor interactions, explain part of the difference between predicted and actual binding. (D) Not all in vivo binding events have a regulatory impact on gene expression. Productive, functional binding must be validated experimentally using standard reporter assays or other measures of cis-regulatory function. In this hypothetical example, only Regions W and Y drive gene expression that is responsive to the TF being tested.
Figure 7
Figure 7. Transcription factor-DNA binding strategies
(A) Pioneer TFs can bind inaccessible, nucleosome-associated DNA sites. Pioneer factors then create an open chromatin environment that is permissive for the binding of nonpioneer factors (settler and migrant TFs). (B) Settler TFs bind to essentially all accessible copies of their DNA target sites. (C) Migrant TFs only bind a subset of their accessible target DNA sites. (D) High- and low-affinity binding are driven by a TF’s specific DNA recognition properties. Nonspecific binding is driven by the electrostatic attraction between negatively charged DNA and positively charged DNA binding domains. Nonconsensus binding is driven by the attraction of TFs to repeated homo-oligomeric tracts. Indirect binding, or tethering, is driven by the interaction of TFs with another DNA binding factor (in this schematic, TF’).
Figure 8
Figure 8. Models of transcription factor assembly on enhancer DNA
(A) Left: The enhanceosome model is characterized by cooperative TF binding and highly constrained binding site positioning. Right: Minor changes in enhancer sequence (i.e., inversion in this case, but insertions, deletions, mutations, etc., also apply) can lead to collapse of TF assembly and enhancer function. (B) Left: The billboard model is characterized by highly flexible binding-site grammars. Although all TFs are important for enhancer function, TF binding and enhancer function are not affected by significant changes in binding site positioning or orientation.
Figure 9
Figure 9. Cellular context and transcription factor-DNA binding
(A) Isl1 is an essential factor in two separate embryonic stem cell (ESC) reprogramming modules, which generate spinal (left) and cranial (right) motor neurons, respectively. The genome-wide DNA targeting of Isl1 is markedly influenced by interaction with spinal- and cranial-specific TFs (Lhx3 and Phox2, respectively). DNA at different loci is represented in blue, red or black. DNA accessibility profiles of the reprogrammed stem cells resemble brain, not ESC, accessibility profiles, suggesting that the reprogramming TFs can induce DNA accessibility. However, this possibility remains to be functionally tested. (B) Left column: GATA “switch” sites at the GATA2 locus remain continually bound by GATA factors through multiple stages of erythroid differentiation. GATA2 acts as an autoregulatory activator at these enhancers, and GATA1 is either repressive (red line) or neutral (gray dashed line). Right column: At the GATA1 locus, DNA methylation and, presumably, chromatin compaction prevent GATA2 from binding a “switch” enhancer in hematopoietic stem cells. As the epigenetic environment becomes permissive, GATA2 binds this enhancer and activates GATA1 expression. GATA1 then displaces GATA2 and acts as an autoregulatory activator at this enhancer.

References

    1. Slattery M, et al. Cofactor binding evokes latent differences in DNA binding specificity between Hox proteins. Cell. 2011;147:1270–1282. - PMC - PubMed
    1. Gordân R, et al. Genomic regions flanking E-box binding sites influence DNA binding specificity of bHLH transcription factors through DNA shape. Cell Rep. 2013;3:1093–1104. - PMC - PubMed
    1. Heinz S, et al. Simple combinations of lineage-determining transcription factors prime cis-regulatory elements required for macrophage and B cell identities. Mol Cell. 2010;38:576–589. - PMC - PubMed
    1. Yanez-Cuna JO, et al. Uncovering cis-regulatory sequence requirements for context-specific transcription factor binding. Genome Res. 2012;22:2018–2030. - PMC - PubMed
    1. Stormo GD. DNA binding sites: representation and discovery. Bioinformatics. 2000;16:16–23. - PubMed

Publication types