. 2014 Aug 18:5:4632.
doi: 10.1038/ncomms5632.

Myc inhibition is effective against glioma and reveals a role for Myc in proficient mitosis

Affiliations

Myc inhibition is effective against glioma and reveals a role for Myc in proficient mitosis

Daniela Annibali et al. Nat Commun. .

Abstract

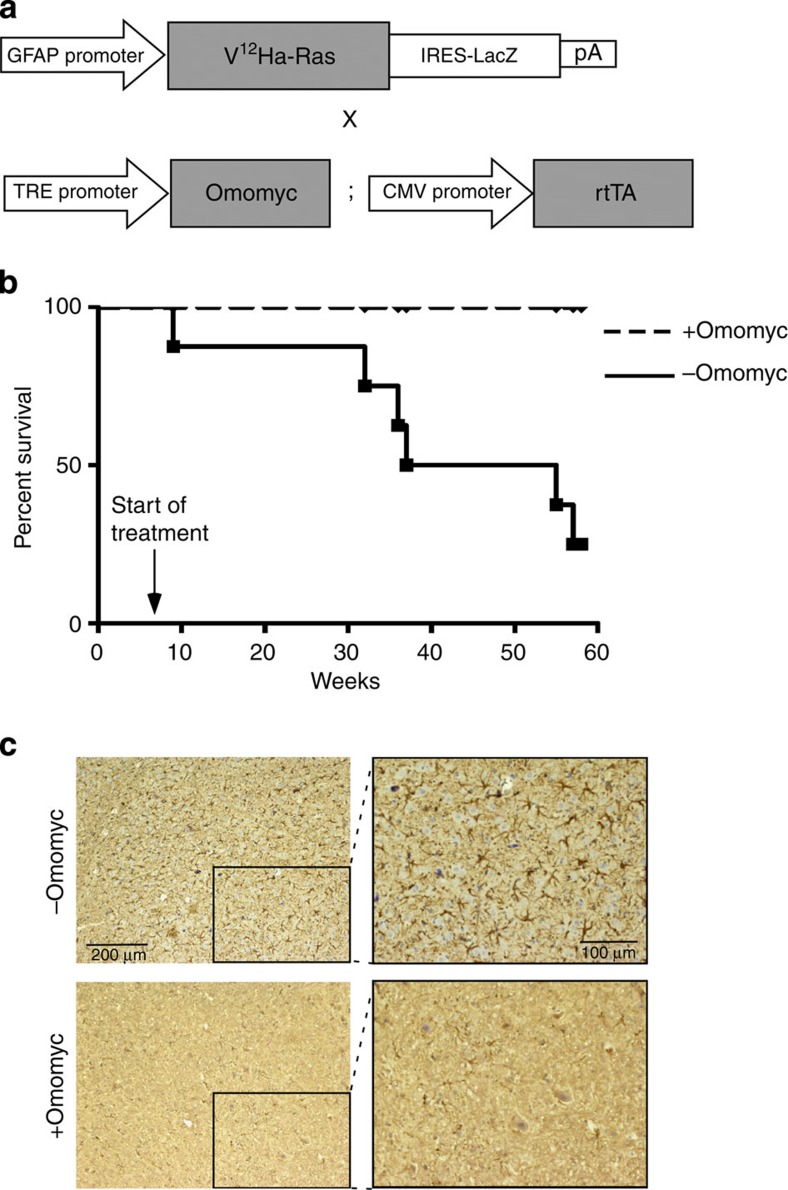
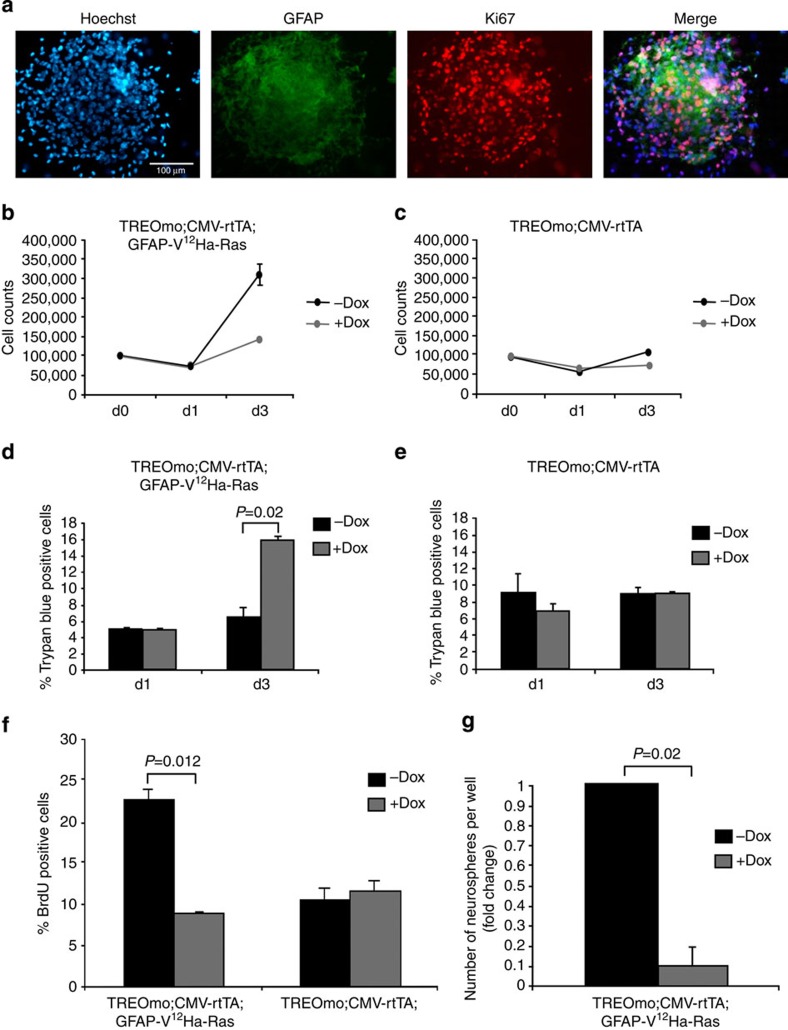
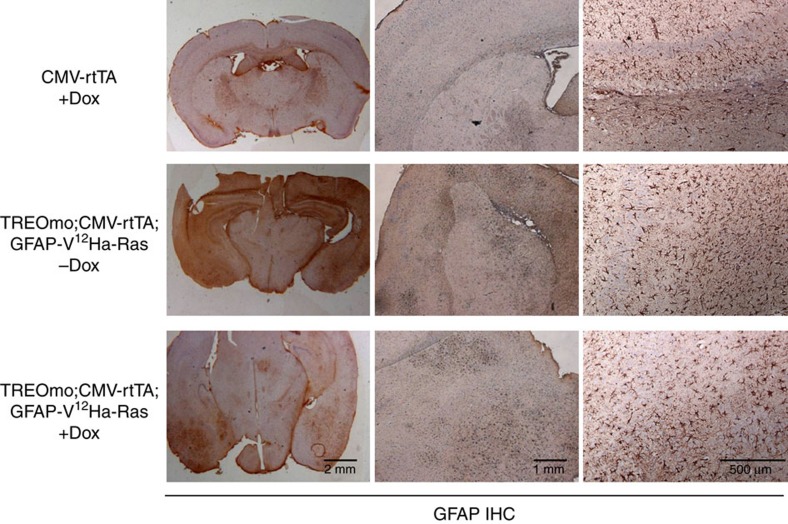
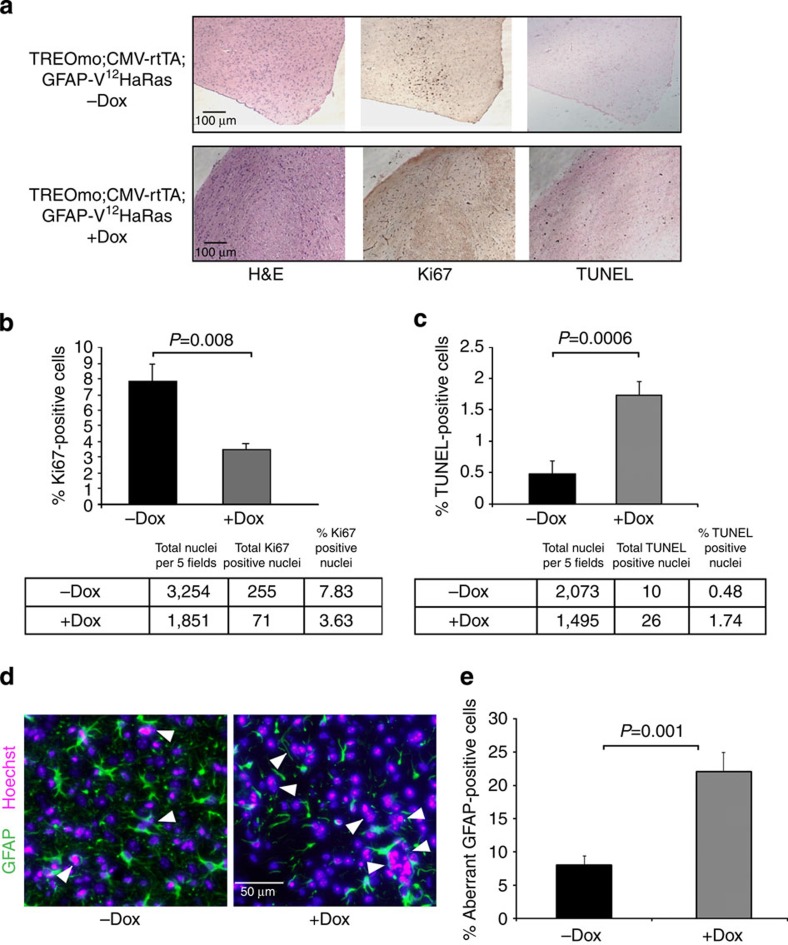
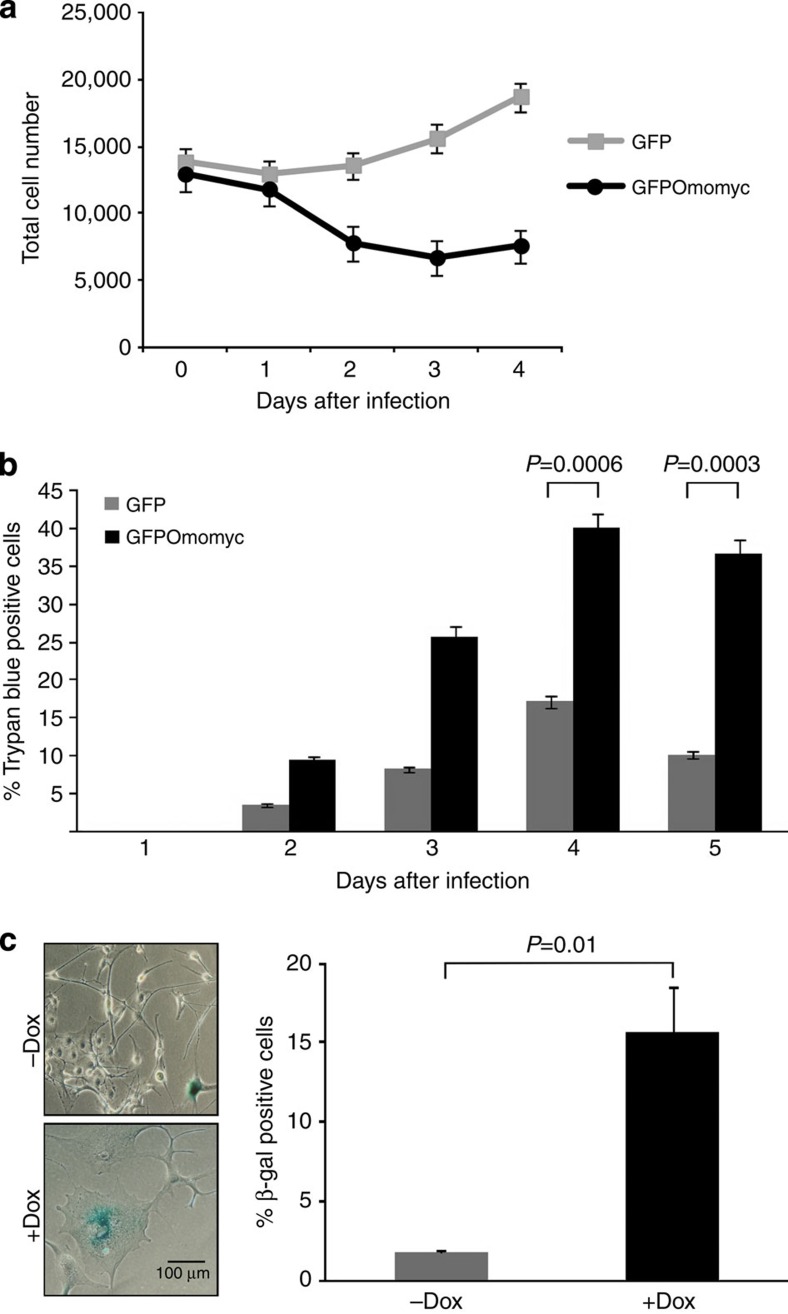
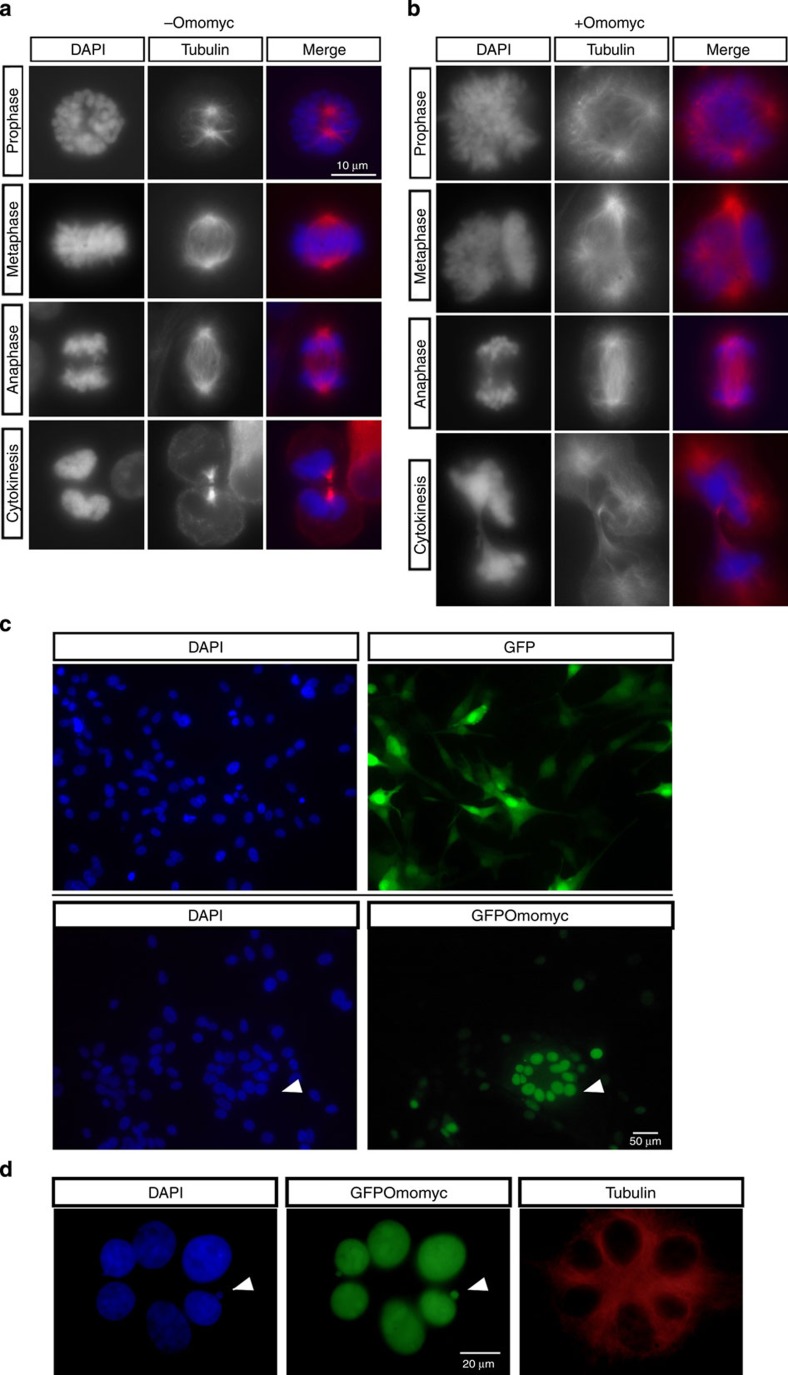
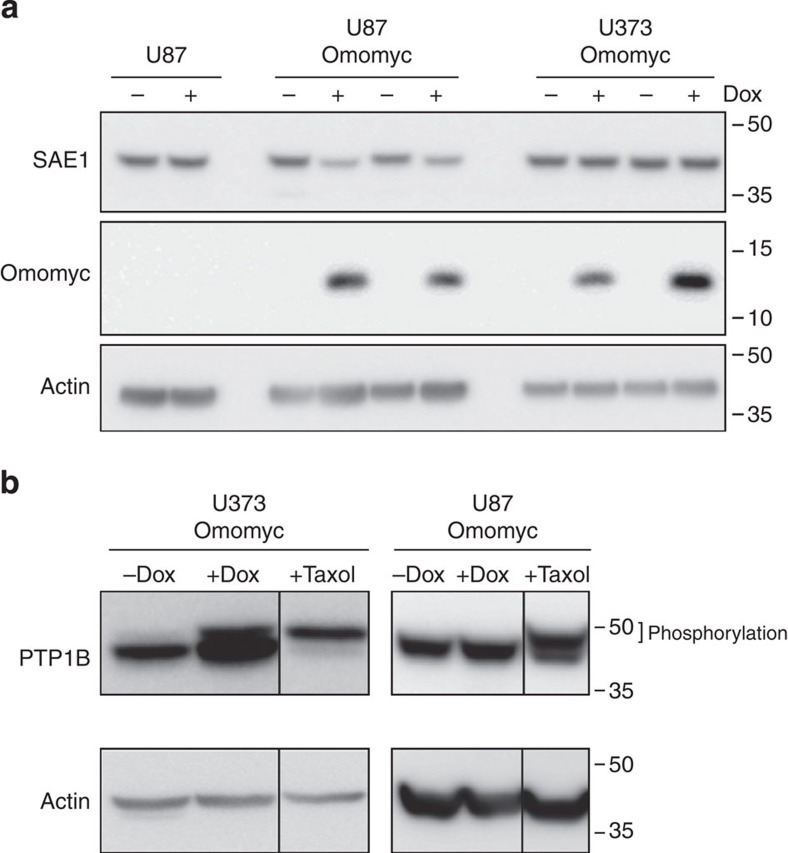
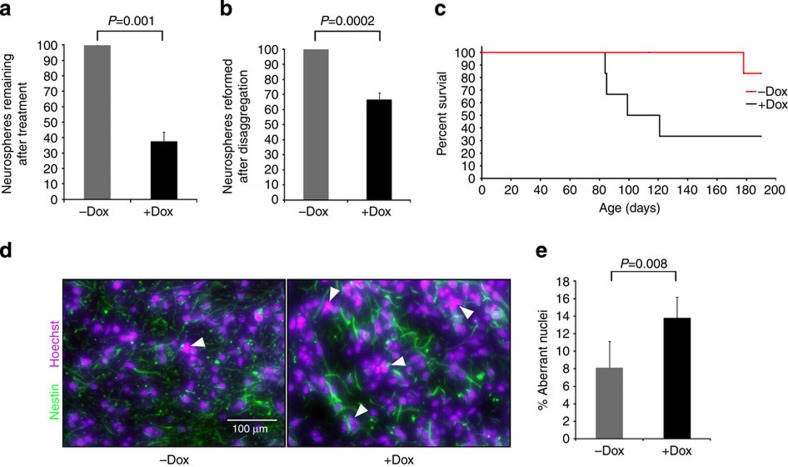
Gliomas are the most common primary tumours affecting the adult central nervous system and respond poorly to standard therapy. Myc is causally implicated in most human tumours and the majority of glioblastomas have elevated Myc levels. Using the Myc dominant negative Omomyc, we previously showed that Myc inhibition is a promising strategy for cancer therapy. Here, we preclinically validate Myc inhibition as a therapeutic strategy in mouse and human glioma, using a mouse model of spontaneous multifocal invasive astrocytoma and its derived neuroprogenitors, human glioblastoma cell lines, and patient-derived tumours both in vitro and in orthotopic xenografts. Across all these experimental models we find that Myc inhibition reduces proliferation, increases apoptosis and remarkably, elicits the formation of multinucleated cells that then arrest or die by mitotic catastrophe, revealing a new role for Myc in the proficient division of glioma cells.


Figures

Figure 1
Figure 1. Myc inhibition confers a survival advantage in GFAP-V12Ha-Ras mice.
(a) To obtain a mouse model of spontaneous glioma in which Omomyc expression could be activated upon doxycycline treatment, TRE-Omomyc;CMVrtTA mice were crossed with GFAP-V12Ha-Ras mice, giving the triple transgenic TRE-Omomyc;CMVrtTA;GFAP-V12Ha-Ras. (b) Kaplan–Meier curve showing that Omomyc expression confers a significant survival advantage to V12Ha-Ras expressing mice. Eight-week-old mice, untreated or treated with Omomyc, were monitored for symptom-free survival up to 57 weeks of age.+Omomyc: TRE-Omomyc;CMVrtTA; GFAP-V12Ha-Ras triple transgenics plus doxycycline (n=8).−Omomyc: six vehicle-treated TRE-Omomyc;CMVrtTA;GFAP-V12Ha-Ras triple transgenics and two CMVrtTA;GFAP-V12Ha-Ras treated with doxycycline, to control for any doxycycline effect (n=8) P=0.014 by log-rank test. No effect of doxycycline was observed on tumour latency. (c) Representative pictures of GFAP immunostaining from the brains of mice included in the survival curve above. The panels on the right are higher magnification images of regions indicated by the black boxes. Control mice present dense GFAP-positive cells compared with Omomyc-treated mice.
Figure 2
Figure 2. Myc inhibition reduces proliferation and viability of V12Ha-Ras neuroprogenitors.
(a) Neuroprogenitor cells freshly isolated from the subventricular zone (SVZ) of adult (3 months old) asymptomatic triple transgenic TRE-Omomyc;CMVrtTA;GFAP-V12Ha-Ras control mice were grown as neurospheres in culture in serum-free medium supplemented with growth factors (EGF and FGF). Immunostaining for GFAP (green) and Ki67 (red) are shown. Nuclei were counterstained with Hoechst (blue). (b,c) NPG growth curves. Neuroprogenitors were plated as single cells in 12-well plates and treated with doxycycline (+Dox) or untreated (–Dox) for 3 days. Triple transgenic TRE-Omomyc;CMVrtTA;GFAP-V12Ha-Ras cells expressing Omomyc show a significant reduction in the total number of cells after 3 days of treatment, compared with the untreated cultures. (P-value=0.0168, calculated by t-test; b). Notably, 3 days of Omomyc expression in control TRE-Omomyc;CMVrtTA does not affect significantly their growth rate (c). Data are shown as means±s.e. of triplicates (n=2). (d,e) Cell death was assessed by Trypan blue staining. Triple transgenic TRE-Omomyc;CMVrtTA;GFAP-V12Ha-Ras NPGs have elevated numbers of dead cells after Omomyc expression for 3 days (d), whereas there is no difference in double transgenic TRE-Omomyc;CMVrtTA NPGs (e). Data are shown as mean+s.e. of triplicates. P-values were calculated by t-test. (f) BrdU staining of triple transgenic TRE-Omomyc;CMVrtTA;GFAP-V12Ha-Ras and control TRE-Omomyc;CMVrtTA cells treated with doxycycline for 3 days or untreated. Data represent the mean of triplicates+s.e. (n=3). P-values were calculated by t-test. (g) Omomyc expression impairs the self-renewal ability of triple transgenic TRE-Omomyc;CMVrtTA;GFAP-V12Ha-Ras NPGs. Single neuroprogenitor cells were plated at a clonal density (500 per well) in a 12-well plate and treated or not with doxycycline. After 21 days, the number of spheres was evaluated. Data are shown as means+s.e. of triplicates (n=2). P-values were calculated by t-test.
Figure 3
Figure 3. Histological analysis of symptomatic mice.
Representative GFAP immunostaining of normal CMVrtTA and triple transgenic TRE-Omomyc;CMVrtTA;GFAP-V12Ha-Ras brains. Left panels show that astrocytic density is reduced in Omomyc-expressing mice. Center panels focus on residual GFAP-positive regions. Right panels show higher magnification of astrocytes and active microglia.
Figure 4
Figure 4. Effects of Myc inhibition in the brain of GFAP-V12Ha-Ras symptomatic mice.
(a) Symptomatic triple transgenic TRE-Omomyc;CMVrtTA;GFAP-V12Ha-Ras mice were treated with doxycycline for 7 days (n=2) or untreated (n=3). Histological analysis (left panels) shows a reduction in Ki67 positive (proliferating) cells and an increase in dying TUNEL-positive cells in Omomyc-expressing mice. (b) Quantification of the Ki67 positivity from the histological analysis in a. The percentage of proliferating cells is shown in the graph, and the total number of cells counted in five fields is also indicated in the table. (c) Quantification of the TUNEL positivity from the histological analysis described above. The percentage of TUNEL-positive cells is shown in the graph, and the total number of cells counted in five fields is also indicated in the table. (d) Omomyc treatment causes the appearance of multinucleated cells. Symptomatic triple transgenic TRE-Omomyc;CMVrtTA;GFAP-V12Ha-Ras mice were treated with doxycycline for 7 days. Histological analysis was performed on isolated brains to look for GFAP-positive astrocytes in tumour regions (green dye). Nuclei were counterstained with Hoechst (coloured pink here after merging with the GFAP images to facilitate visualization of the nuclei). (e) Quantification of the number of multinucleated GFAP-positive nuclei after Omomyc treatment (n=2) for 7 days compared with untreated mice (n=2). The average of two mice is shown+s.e. For each mouse, a minimum of 10 microscopic fields and 300 cells were scored. Data are shown as means+s.e. P-value was calculated by Student’s t-test.
Figure 5
Figure 5. Omomyc causes growth arrest and increases cell death in U87MG cells.
(a) Growth curves of U87MG infected with GFP control or GFP-Omomyc-expressing retroviruses. Total cell number was quantified at the indicated time points. Data are shown as the mean±s.e. of triplicates from a single experiment representative of three repeats. P-value at 3 days <0.05; P-value at 4 days <0.01, using a two-tailed t-test. (b) Cell death was assessed by Trypan blue staining. The number of dead cells was quantified at the indicated time points. Data are shown as mean±s.e. of triplicates. P-values were calculated by t-test. (c) U87MG cells were infected with a doxycycline-switchable lentiviral vector expressing Omomyc. Doxycycline treatment increases the number of β-galactosidase positive, senescent-like cells (left panels: typical β-galactosidase phase contrast images, right panel: quantification). The average of three experiments+s.d. is shown. P-values were calculated by a Student’s t-test.
Figure 6
Figure 6. Myc inhibition triggers micro- and multinucleation and mitotic abnormalities in U87MG cells.
(a) Normal mitosis phases in control U87MG cells. Tubulin staining (second column and in red in the merged image) shows proper centrosome maturation and spindle assembly, whereas DAPI staining (first column and in blue in the merged image) highlights correct chromosome alignment and subsequent segregation. (b) Mitotic defects in Omomyc-expressing cells. The same tubulin and DAPI staining as above show that Omomyc induces defects in all mitotic phases, ranging from abnormal multipolar spindles (prophase and metaphase panels), to chromosome misalignments, segregation errors and lagging chromosomes (anaphase and cytokinesis panels), and finally absence of midbody and failed cytokinesis (bottom panel). Mitotic abnormalities involve 14.7% of mitotic figures in Omomyc-expressing cells. (c) GFP (green) immunofluorescence and DAPI nuclear counterstain (blue) show that after 24 h of GFP-Omomyc expression, U87MG cells become multinucleated (bottom panels) whereas that is observed much less frequently in control U87MG (top panel) that express GFP alone. (d) A representative image of a multinucleated Omomyc-expressing cell: α-tubulin staining (in red) shows that all nuclei belong to the same cell. The arrowhead indicates a typical micronucleus.
Figure 7
Figure 7. Omomyc causes alterations in proteins linked to mitotic cell death.
(a) Western blot analysis of samples from GBM cells shows that Omomyc causes a decrease in SAE1 expression in U87MG but not U373MG cells. GBM cells with a lentiviral Omomyc expression cassette were treated with doxycycline for 6 days to induce Omomyc expression. Two independent sets of samples are shown for each of the GBM cell lines. (b) Western blot analysis of GBM samples shows that Omomyc expression triggers an increase in PTP1B phosphorylation in U373MG cells. GBM cells with a lentiviral Omomyc expression cassette were treated with doxycycline for 6 days to induce Omomyc expression. A Taxol control was used to indicate the typical phosphorylation-induced mobility shift of PTP1B during mitotic catastrophe. Taxol-treated control samples are nonadjacent bands from the same western blot.
Figure 8
Figure 8. Myc inhibition decreases the growth of patient-derived neurospheres in vitro and increases the survival of a xenograft mouse model.
(a) Patient-derived neurosphere cultures derived from a resected human glioblastoma were infected with a lentiviral vector harbouring a doxycycline-regulatable Omomyc expression cassette. Myc inhibition by Omomyc decreases the number of spheres after 2 weeks of doxycycline treatment in culture. The mean+s.e.m. is shown (n=6). P-values were calculated by a Student’s t-test. (b) Omomyc expression in disaggregated neurospheres decreases their self-renewal ability. Neurospheres were dissociated into a single-cell suspension and 500 cells per well were added to a 96-well plate. The number of spheres was counted after 2–4 weeks in the presence or absence of doxycycline. The mean+s.e.m. is shown (n=5). P-values were calculated by a Student’s t-test. (c) A Kaplan–Meier survival curve of mice inoculated with patient-derived neurospheres and treated with doxycycline to trigger Omomyc expression (n=6), or with sucrose as the control (n=6). P=0.04 by log-rank test. (d) Omomyc expression increases the number of aberrant nuclei in nestin-positive cells. At the time of euthanasia, brains of the orthotopically injected mice described in 8c were fixed, and sections stained for nestin. Typical images are shown (green: nestin, pink: Hoechst). (e) Quantification of the experiment described in 8d. Five sections taken from different parts of each brain were used to score the number of aberrant nestin-positive nuclei (indicated by arrowheads). Untreated mice n=4, treated with doxycycline n=5. P-values were calculated by a Student’s t-test.

References

    1. Kleihues P., Burger P. C. & Scheithauer B. W. The new WHO classification of brain tumours. Brain Pathol. 3, 255–268 (1993). - PubMed
    1. Wen P. Y. & Kesari S. Malignant gliomas in adults. N. Engl. J. Med. 359, 492–507 (2008). - PubMed
    1. Huse J. T. & Holland E. C. Targeting brain cancer: advances in the molecular pathology of malignant glioma and medulloblastoma. Nat. Rev. Cancer 10, 319–331 (2010). - PubMed
    1. Guha A., Feldkamp M. M., Lau N., Boss G. & Pawson A. Proliferation of human malignant astrocytomas is dependent on Ras activation. Oncogene 15, 2755–2765 (1997). - PubMed
    1. Feldkamp M. M., Lau N., Rak J., Kerbel R. S. & Guha A. Normoxic and hypoxic regulation of vascular endothelial growth factor (VEGF) by astrocytoma cells is mediated by Ras. Int. J. Cancer 81, 118–124 (1999). - PubMed

Publication types

MeSH terms