. 2014 Sep 4;15(3):350-364.
doi: 10.1016/j.stem.2014.06.018. Epub 2014 Aug 14.

Dnmt3a and Dnmt3b have overlapping and distinct functions in hematopoietic stem cells

Affiliations

Dnmt3a and Dnmt3b have overlapping and distinct functions in hematopoietic stem cells

Grant A Challen et al. Cell Stem Cell. .

Abstract

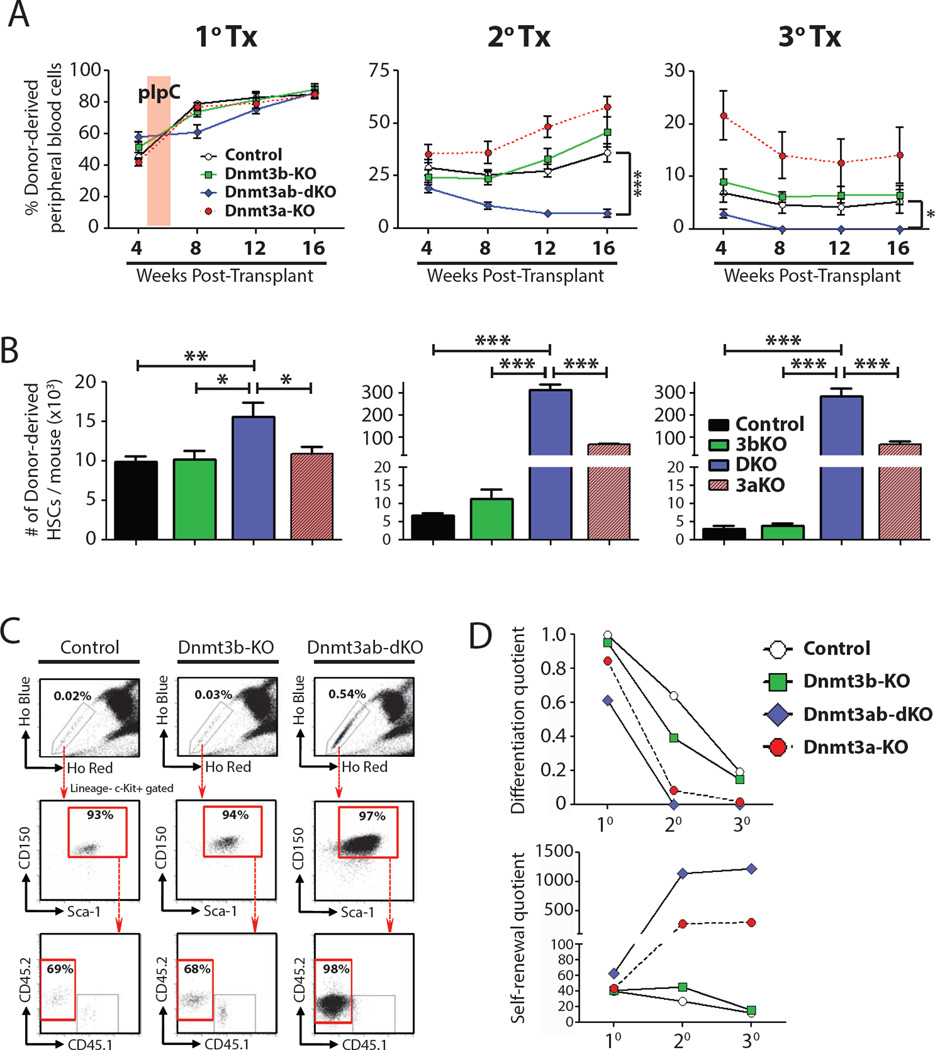
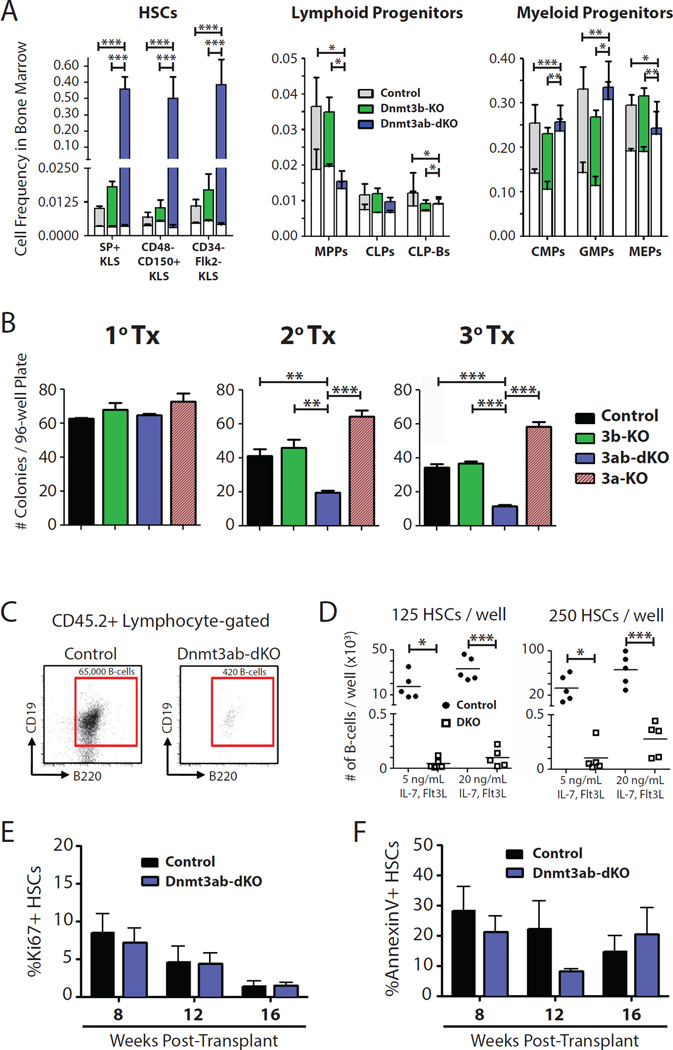
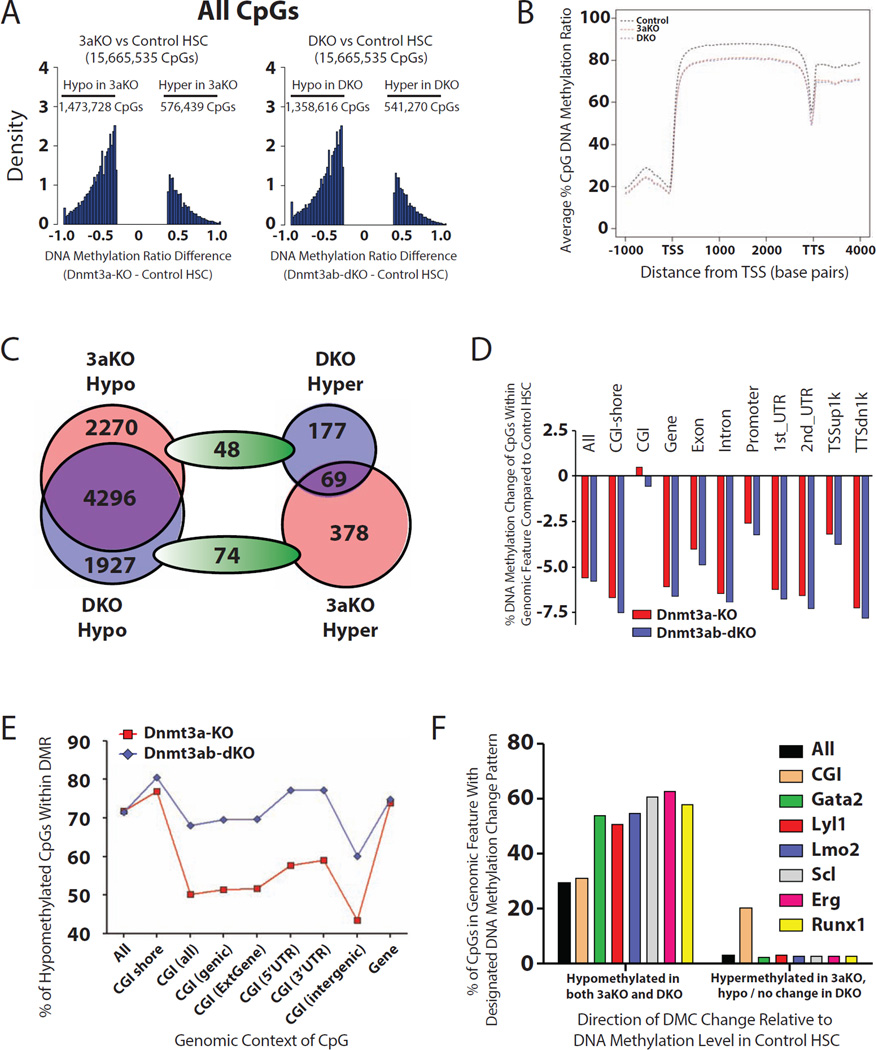
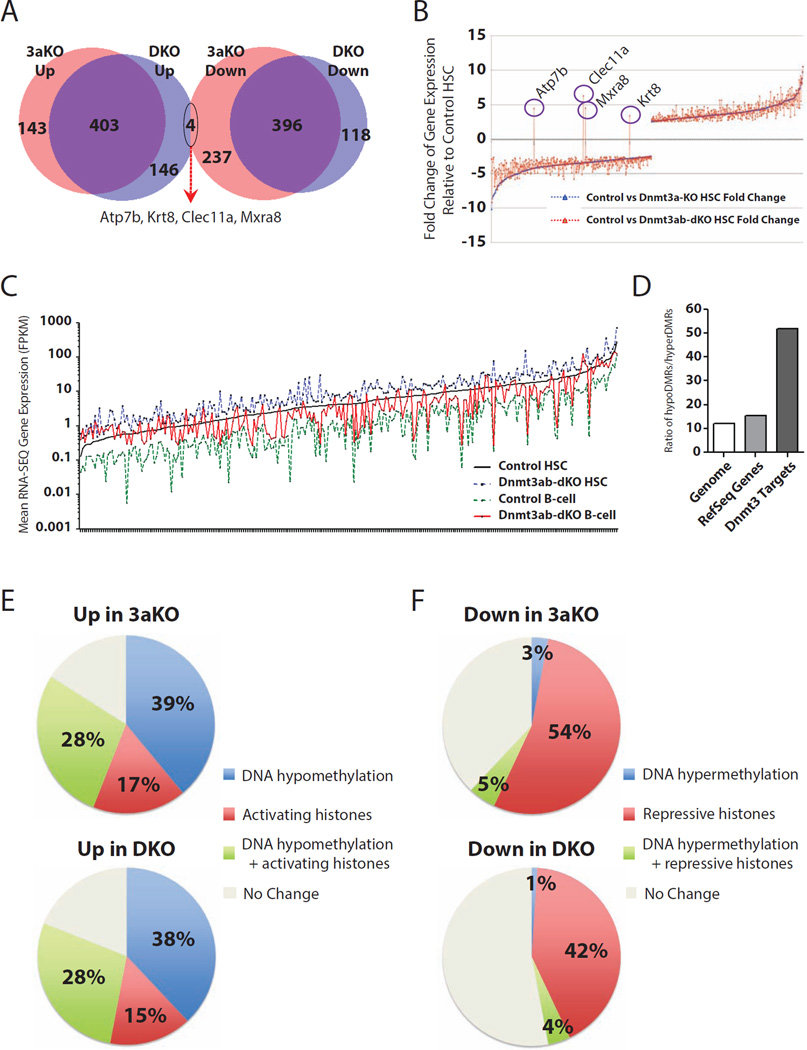
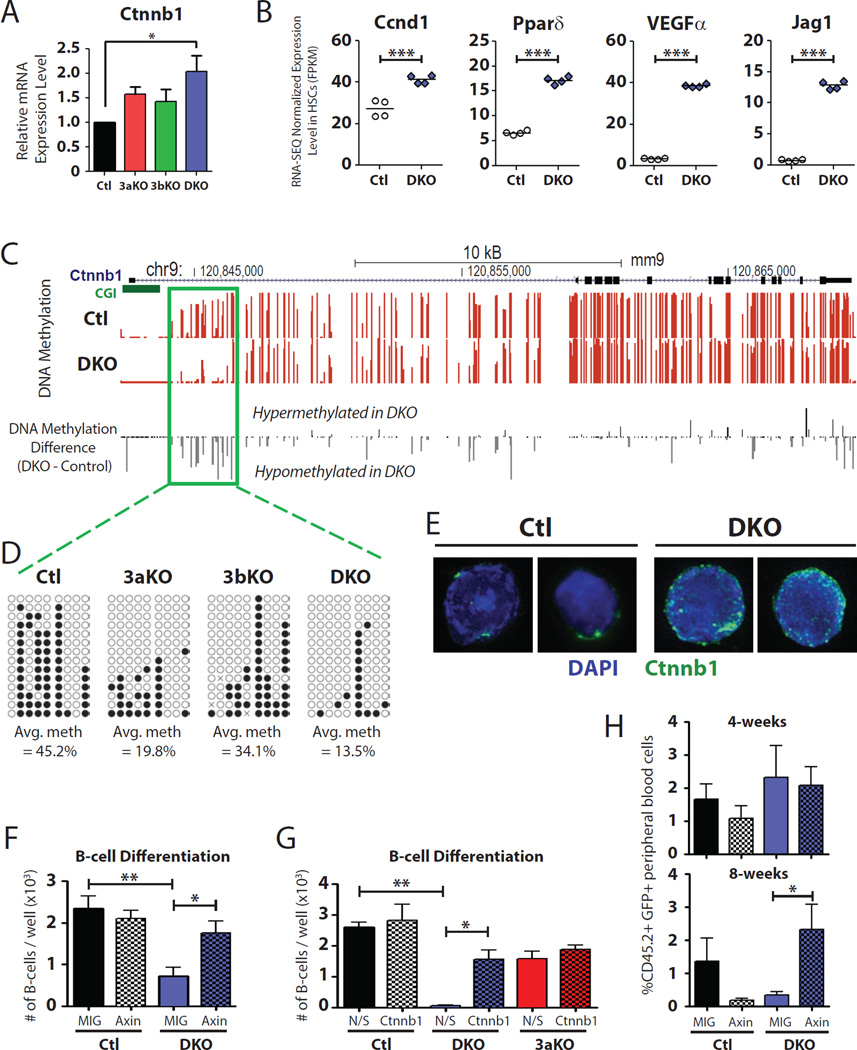
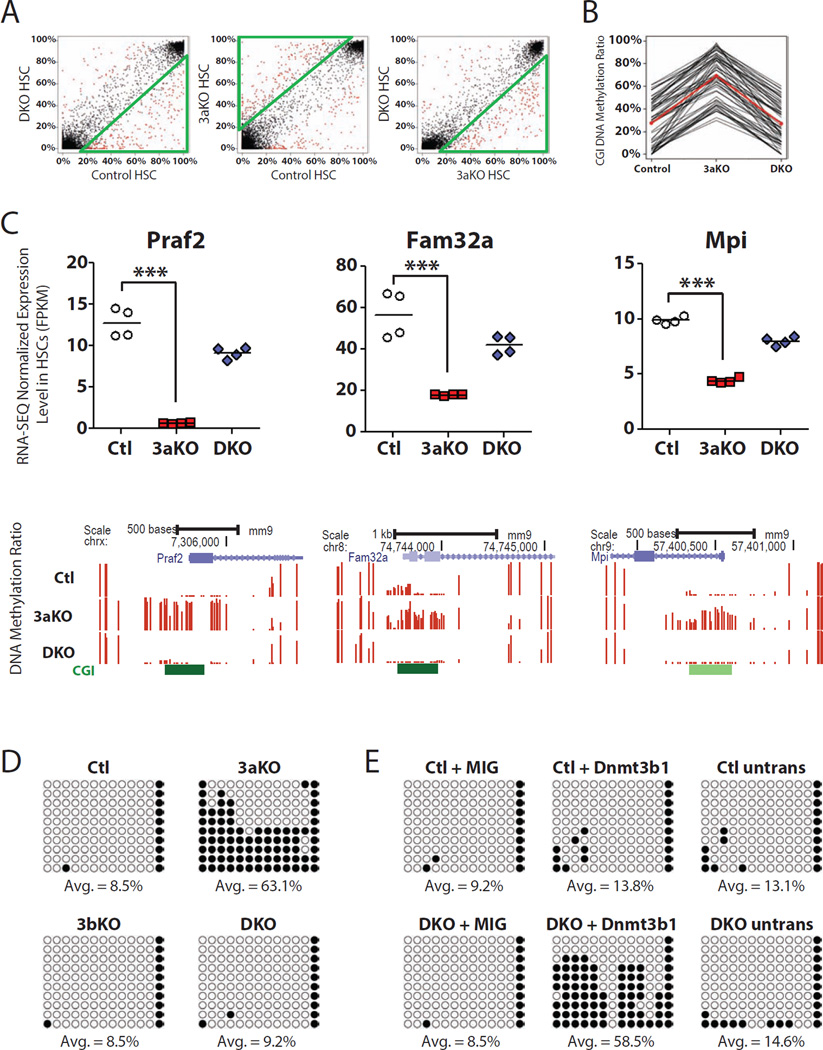
Epigenetic regulation of hematopoietic stem cells (HSCs) ensures lifelong production of blood and bone marrow. Recently, we reported that loss of de novo DNA methyltransferase Dnmt3a results in HSC expansion and impaired differentiation. Here, we report conditional inactivation of Dnmt3b in HSCs either alone or combined with Dnmt3a deletion. Combined loss of Dnmt3a and Dnmt3b was synergistic, resulting in enhanced HSC self-renewal and a more severe block in differentiation than in Dnmt3a-null cells, whereas loss of Dnmt3b resulted in a mild phenotype. Although the predominant Dnmt3b isoform in adult HSCs is catalytically inactive, its residual activity in Dnmt3a-null HSCs can drive some differentiation and generates paradoxical hypermethylation of CpG islands. Dnmt3a/Dnmt3b-null HSCs displayed activated β-catenin signaling, partly accounting for the differentiation block. These data demonstrate distinct roles for Dnmt3b in HSC differentiation and provide insights into complementary de novo methylation patterns governing regulation of HSC fate decisions.


Figures

Figure 1
Figure 1. de novo DNA methylation is required for long-term HSC differentiation in vivo
(A) Donor cell-derived peripheral blood chimerism in mice transplanted with control, Dnmt3b-KO (3bKO) or Dnmt3ab-dKO (DKO) HSCs. The previously determined values for Dnmt3a-KO (3aKO) HSCs (Challen et al., 2012) are included for reference in this and following panels. (B) Enumeration of donor-derived HSCs per mouse 18-weeks post-transplant over serial transplantation. (C) Bone marrow FACS analysis of tertiary transplanted mice showing accumulation of DKO HSCs. (E) Differentiation and self-renewal quotients of HSC genotypes over serial transplant. Mean ± SEM values are shown (n = 16–35 recipient mice per genotype), *P < 0.05, **P < 0.01, ***P < 0.001. See also Figure S1.
Figure 2
Figure 2. Dnmt3b confers some differentiation capacity in HSCs
(A) Frequencies of different cell compartments in the bone marrow of secondary recipient mice. White areas indicate the proportion of CD45.1+ (competitor-derived) cells, n = 9–16. Statistical significance refers to comparisons of CD45.2+ (donor-derived) populations. (B) Number of colonies generated per plate from HSCs at the end of each round of serial transplantation, n = 4. Single HSCs were sorted into individual wells of 96-well plates in Methocult media containing SCF, IL-3, IL-6 and EPO. (C) Flow cytometric analysis of B-cell differentiation from control and DKO HSCs in vitro. (D) Numbers of B-cells generated from control and DKO HSCs after 14-days culture, n = 5. (F) Dynamic analysis of HSC proliferation during secondary hematopoietic reconstitution with Ki67 staining, n = 4. (G) Dynamic analysis of HSC apoptosis during secondary hematopoietic reconstitution with AnnexinV staining, n = 3. Mean ± SEM values are shown, *P < 0.05, **P < 0.01, ***P < 0.001. See also Figure S2.
Figure 3
Figure 3. Global DNA methylation defects in Dnmt3-mutant HSCs
(A) Distribution of all DMCs in the genome of Dnmt3-mutant HSCs relative to control from WGBS data. (B) Average DNA methylation profile of CpGs across genic elements in control, 3aKO and DKO HSCs. (C) Distribution of DMCs within CGIs of Dnmt3-mutant HSCs compared to control. (D) Average DNA methylation changes across genomic elements in Dnmt3-mutant HSCs relative to control. (E) Percentages of hypomethylated DMCs within genomic elements in Dnmt3-mutant HSCs compared to control. (F) Hypomethylated DMCs are enriched in transcription factor binding sites, hypermethylated DMCs in 3aKO HSCs are enriched in CGIs. See also Figure S3 and Tables S1, S2 and S3.
Figure 4
Figure 4. The Dnmt3s repress HSC-specific genes and gene expression changes are explained by epigenetic dynamics
(A) Overlap of differentially expressed genes between Dnmt3-mutant HSCs and control HSCs. (B) Plotting fold change in transcript expression of genes differentially expressed between 3aKO and control HSCs as the baseline, overlay of fold change in DKO HSCs relative to controls show a highly similar pattern. (C) Identification of stem cell genes repressed by Dnmt3s during HSC differentiation. The baseline is RNA-SEQ expression of genes in control HSCs. Plot shows increased expression in DKO HSCs, repression in control B-cells, and intermediate expression (incomplete repression) in DKO B-cells. (D) Ratio of hypoDMRs / hyperDMRs shows enrichment for hypomethylation of Dnmt3-regulated genes relative to the rest of the genome. (E,F) Categorical breakdown of genes differentially expressed in 3aKO and DKO HSCs compared to controls according to their epigenetic status. Increased gene expression in 3aKO and DKO HSCs is dominated by hypomethylation (E) while decreased gene expression is underpinned moreso by loss of activating chromatin (F). Activating histone = increased H3K4me3 and/or reduced H3K27me3. Repressive histones = decreased H3K4me3 and/or increased H3K27me3. See also Figure S4, and Tables S4 and S5.
Figure 5
Figure 5. Increased β-catenin signaling contributes to the differentiation block of DKO HSCs
(A) Real-time PCR analysis of Ctnnb1 transcript expression in HSCs, n = 3. (B) RNA-SEQ expression of Ctnnb1 target genes in control (Ctl) and DKO HSCs. (C) DNA methylation profile of Ctnnb1 locus determined by WGBS. Green box indicates hypomethylated region in DKO HSCs. (D) Bisulfite sequencing of hypomethylated Ctnnb1 region in HSC genotypes (open circle = unmethylated CpG, closed circle = methylated CpG). (E) Immunofluorescent staining for Ctnnb1 (green) in control and DKO HSCs, with DAPI staining (blue) to define the nucleus. (F) Ectopic expression of Axin in DKO HSCs was able to partially rescue the B-cell differentiation defect compared to DKO HSCs transduced with control retrovirus (MIG). Ectopic expression of Axin in Ctl HSCs did not affect B-cell differentiation compared to MIG control cells, n = 4. (G) miRNA-mediated knockdown of Ctnnb1 was also able to restore B-cell in DKO HSCs, but had no effect on B-cell differentiation of 3aKO HSCs (N/S = scrambled non-silencing control miRNA, Ctnnb1 = Ctnnb1 miRNA#1), n = 2. (H) Peripheral blood chimerism following transduction and bone marrow transplant of control and DKO HSCs. Ectopic expression of Axin in DKO HSCs was able to significantly increase peripheral blood differentiation compared to the control MIG vector, n = 9–10 mice / group. Mean ± SEM values are shown, *P < 0.05, **P < 0.01. See also Figure S5.
Figure 6
Figure 6. CGI hypermethylation in Dnmt3a-KO HSCs is mediated by Dnmt3b
(A) Comparison of differentially-methylated CGIs across genotypes. Green triangles indicate the genotype with increased DNA methylation. Red dots indicate CGIs with statistically significant differences in DNA methylation. (B) Identification of CGIs that are hypermethylated in 3aKO HSCs relative to control (Ctl) and DKO HSCs. Red line is the average DNA methylation profile. (C) Gene expression and DNA methylation profiles of genes with hypermethylated promoter CGIs in 3aKO HSCs. Top panel is RNA-SEQ gene expression data, bottom panel is WGBS DNA methylation profiles. The height of each bar represents the DNA methylation level of an individual CpG. (D) Promoter CGI DNA methylation profile of Praf2 across HSC genotypes. Open circles represent unmethylated CpGs, closed circles represent methylated CpGs. (E) DNA methylation analysis of Praf2 promoter by bisulfite PCR following transduction of Ctl or DKO HSCs with a control (MIG) or Dnmt3b-expressing (Dnmt3b1) retrovirus, compared to untransduced (untrans) HSCs. ***P < 0.001. See also Figure S6, Table S6.
Figure 7
Figure 7. Dnmt3b isoform expression and tumor-suppressor role in HSCs
(A) RNA-SEQ expression of Dnmt3b isoforms in control (Ctl) and 3aKO HSCs. Exons 21 and 22 encoding the methyltransferase domain of Dnmt3b1 are reduced in 3aKO HSCs. (B) Ratio of Dnmt3b isoform expression in Ctl and 3aKO HSCs. (C) Frequencies of genetic mutations in DNMT3A and DNMT3B in a range of tumors extracted from the COSMIC database. (D) Overlap of DNMT3 mutations in patients with endometrial and colon cancer in COSMIC database.

References

    1. Bamford S, Dawson E, Forbes S, Clements J, Pettett R, Dogan A, Flanagan A, Teague J, Futreal PA, Stratton MR, et al. The COSMIC (Catalogue of Somatic Mutations in Cancer) database and website. British journal of cancer. 2004;91:355–358. - PMC - PubMed
    1. Beerman I, Bock C, Garrison BS, Smith ZD, Gu H, Meissner A, Rossi DJ. Proliferation-dependent alterations of the DNA methylation landscape underlie hematopoietic stem cell aging. Cell Stem Cell. 2013;12:413–425. - PubMed
    1. Bestor TH. Activation of mammalian DNA methyltransferase by cleavage of a Zn binding regulatory domain. Embo J. 1992;11:2611–2617. - PMC - PubMed
    1. Cancer Genome Atlas Research, N. Genomic and epigenomic landscapes of adult de novo acute myeloid leukemia. N Engl J Med. 2013;368:2059–2074. - PMC - PubMed
    1. Challen GA, Sun D, Jeong M, Luo M, Jelinek J, Berg JS, Bock C, Vasanthakumar A, Gu H, Xi Y, et al. Dnmt3a is essential for hematopoietic stem cell differentiation. Nat Genet. 2012;44:23–31. - PMC - PubMed

Publication types

MeSH terms