. 2014 Aug 21;8(4):1210-24.
doi: 10.1016/j.celrep.2014.07.032. Epub 2014 Aug 14.

Kcnn4 is a regulator of macrophage multinucleation in bone homeostasis and inflammatory disease

Affiliations

Kcnn4 is a regulator of macrophage multinucleation in bone homeostasis and inflammatory disease

Heeseog Kang et al. Cell Rep. .

Abstract

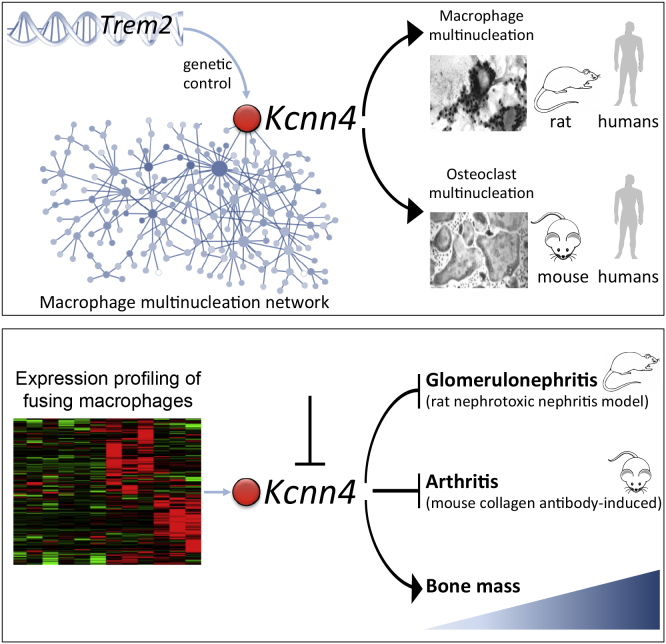
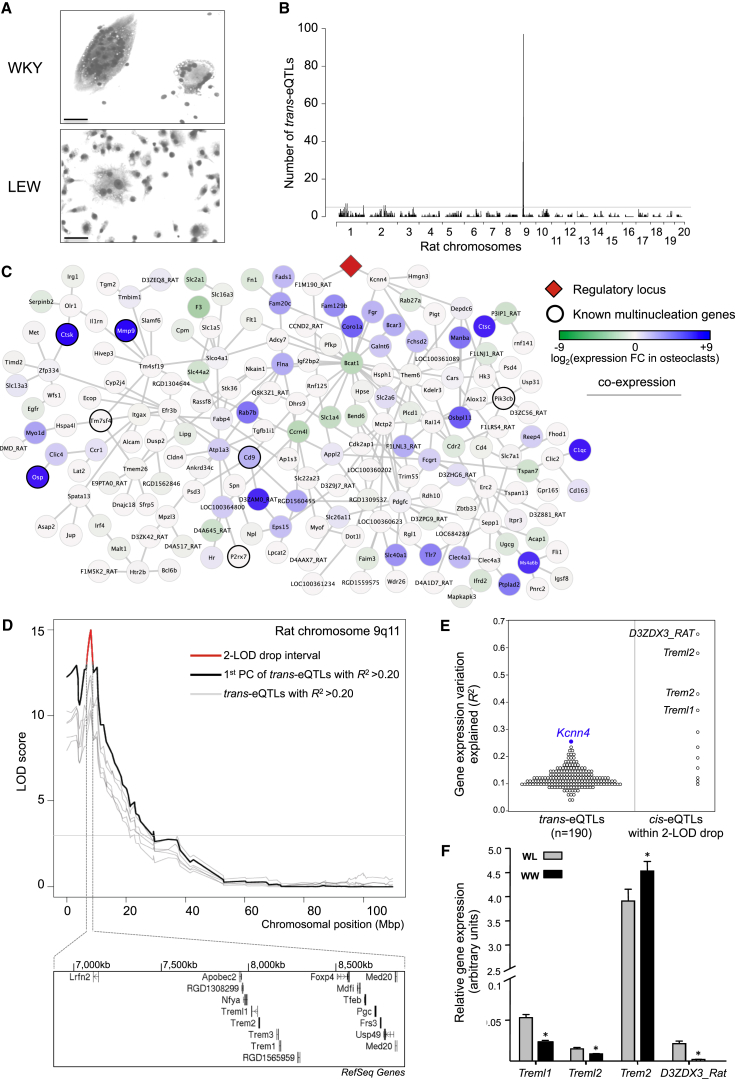
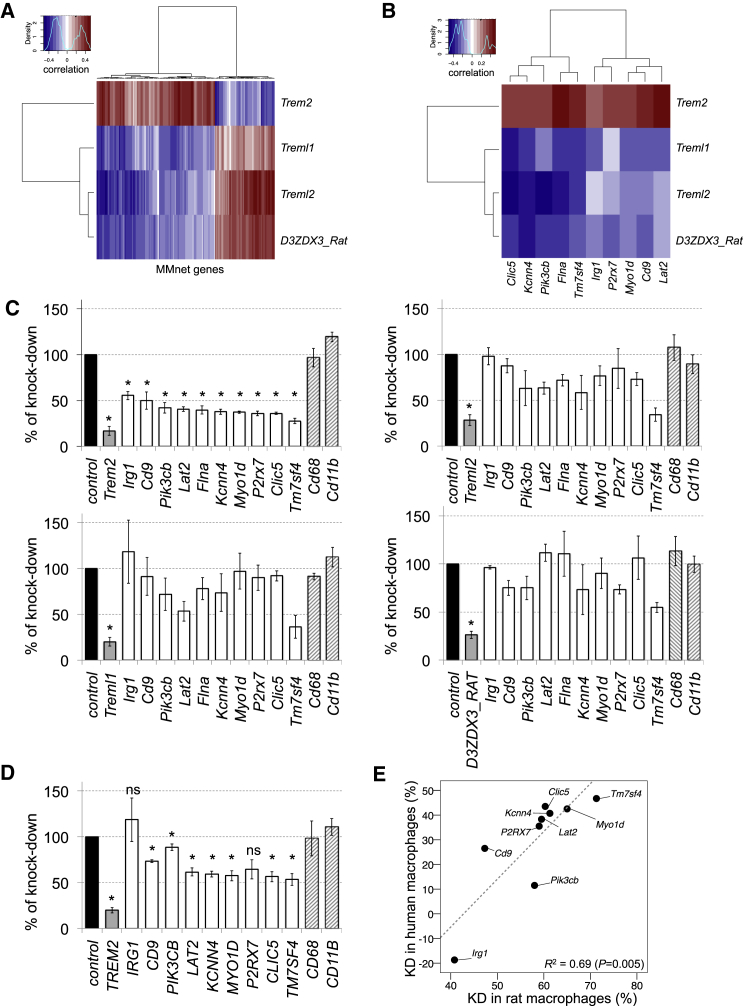
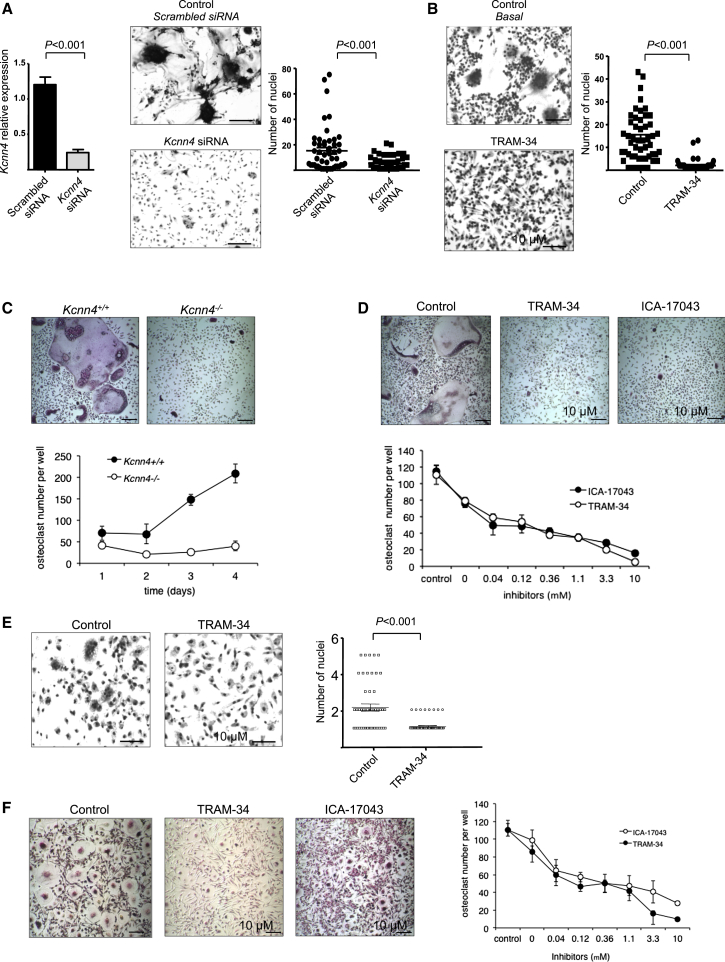
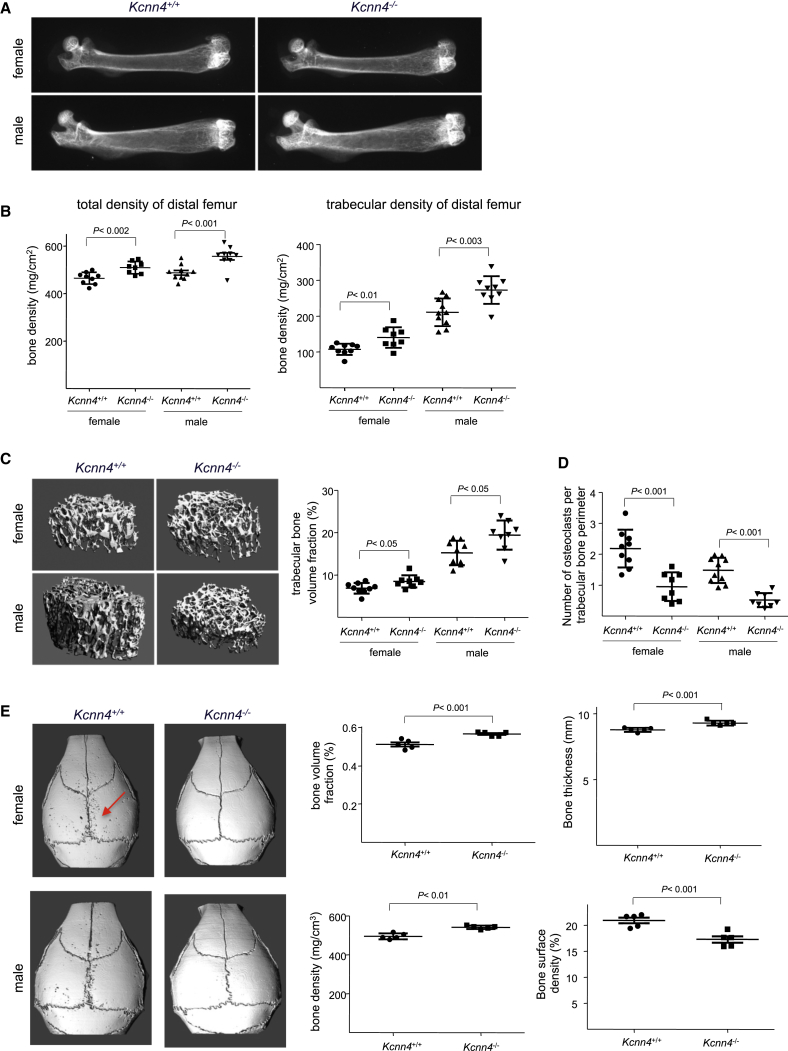
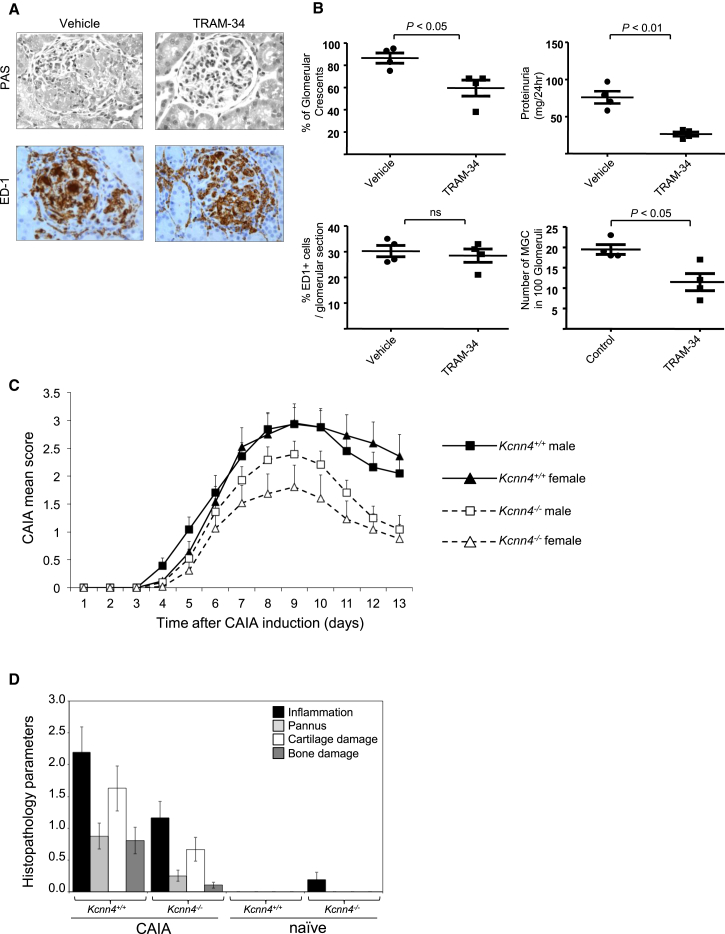
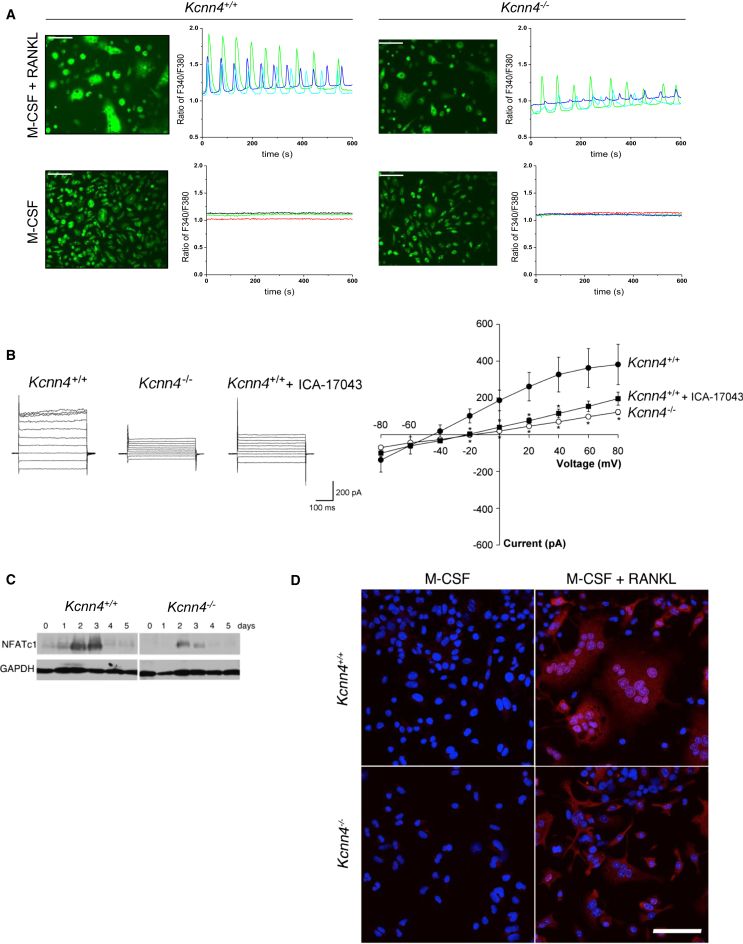
Macrophages can fuse to form osteoclasts in bone or multinucleate giant cells (MGCs) as part of the immune response. We use a systems genetics approach in rat macrophages to unravel their genetic determinants of multinucleation and investigate their role in both bone homeostasis and inflammatory disease. We identify a trans-regulated gene network associated with macrophage multinucleation and Kcnn4 as being the most significantly trans-regulated gene in the network and induced at the onset of fusion. Kcnn4 is required for osteoclast and MGC formation in rodents and humans. Genetic deletion of Kcnn4 reduces macrophage multinucleation through modulation of Ca(2+) signaling, increases bone mass, and improves clinical outcome in arthritis. Pharmacological blockade of Kcnn4 reduces experimental glomerulonephritis. Our data implicate Kcnn4 in macrophage multinucleation, identifying it as a potential therapeutic target for inhibition of bone resorption and chronic inflammation.


Figures

None
Graphical abstract
Figure 1
Figure 1
Identification of Kcnn4 within a Genetically Regulated Macrophage Multinucleation Network (A) Genetic determinants of macrophage multinucleation were explored in WKY and LEW bone-marrow-derived macrophages (BMDMs). WKY macrophages fuse spontaneously to form multinucleate giant cells (MGCs) in vitro and show a marked phenotypic difference when compared to LEW macrophages, which form very few MGCs at day 6 of cell differentiation (original bars, 50 μm). (B) eQTL analysis of the backcross (BC) BMDMs identifies a unique master regulatory locus on rat chromosome 9q11. Genome-wide distribution of trans-eQTLs shows a single locus regulating the expression of 190 transcripts in trans, suggesting master regulation of the trans-eQTL cluster. The detailed eQTL hot spots with the corresponding SNP positions are reported in Table 1. (C) Gene coexpression network of the 190 trans-eQTLs is enriched for osteoclast-expressed genes where the master regulatory locus is highlighted in red. Each gene in the network is represented as a circle (node), and the fold change in expression refers to overexpression (blue) or underexpression (green) in osteoclasts as compared to average expression in other cell types (Supplemental Experimental Procedures). Known multinucleation genes (Mmp9, Ctsk, P2rx7, etc.) are indicated with thick circles. The edges represent coexpression between the two transcripts as identified by ARACNE (Margolin et al., 2006). (D) Genetic linkage showing the principal component of all the trans-cluster transcripts (LOD > 10) together with trans eQTLs with variation in gene expression explained by the SNP (R2) >0.2. The 2-LOD drop interval (in red) and the underlying positional candidates within 2 Mb are also shown. The annotated gene names are according to RefSeq. (E) The cis-eQTLs within the 2-LOD drop interval (in red) are shown together with the trans cluster. Treml1, Trem2, D3ZDX3_Rat, Treml2 are positional candidates (R2 > 0.25) and among the trans-eQTLs, Kcnn4 (in blue) is the most significant trans-eQTL. (F) Quantitative real-time PCR analysis on the positional candidates in BC BMDMs according to their genotype (WKY homozygous, WW; WKY/LEW heterozygous, WL). Note that the expression levels of Trem2 are increased at least 90-fold when compared to other positional candidates. Error bars indicate SEM, p < 0.01. See also Figures S1 and S2.
Figure 2
Figure 2
Trem2 Is a Master Genetic Regulator of Macrophage Multinucleation Network (A) Heatmap of the correlations between macrophage mRNA levels of positional candidates (rows) and all trans-regulated genes of MMnet, showing that Trem2 was positively correlated with the majority (66%) of MMnet transcripts. Red indicates positive correlation and blue indicates negative correlations. (B) Heatmap of the correlations between macrophage mRNA levels of positional candidates (rows) and ten trans-regulated genes representative of the larger MMnet selected for the siRNA knockdown experiments in rat BMDMs. Red indicates positive correlation and blue indicates negative correlations. (C) siRNA against Trem2, Treml2, Treml1, D3ZDX3_Rat in rat macrophages followed by measurement of 10 transcripts belonging to the chromosome 9q11 trans cluster by quantitative real-time PCR. Cd68 and Cd11b expression levels were assessed as control transcripts that do not belong to MMnet. Given the correlation patterns shown in Figure 2B, a one-sample t test was used to test for directionality of the effect in the transcriptional response. Knockdown of Trem2 led to significant (∼50%, p < 0.001) downregulation of all genes tested, whereas knockdown of Treml2, Treml1, D3ZDX3_Rat did not result in a significant alteration in the expression levels of MMnet genes (p > 0.1 for all MMnet genes tested). At least n = 3 rats were used in each experiments. Error bars indicate SEM, p < 0.001. (D) siRNA-mediated knockdown of TREM2 in human monocyte derived macrophages (MDMs) and the quantitative real-time PCR analysis of ten transcripts from the MMnet. MDMs are from buffy coats from four healthy donors. Error bars indicate SEM, p < 0.05 compared to control (scrambled). (E) Knockdown of TREM2 in human MDMs resulted in transcriptional downregulation of MMnet genes, which significantly correlated with downregulation observed in rat BMDMs (R2 = 0.69, p = 0.005).
Figure 3
Figure 3
Kcnn4 Regulates Macrophage Multinucleation in Rodents and Humans (A) WKY BMDMs were cultured in Lab-Tek chambers and incubated with either scrambled or Kcnn4 siRNA, and cells were fixed for the assessment of the multinucleation. Kcnn4 expression levels were measured by quantitative real-time PCR and normalized to Hprt expression, showing 80% knockdown in macrophages following incubation with Kcnn4 siRNA (left panel). Silencing of Kcnn4 led to a marked reduction in macrophage multinucleation as the number of nuclei in macrophages transfected with Kcnn4 siRNA was significantly reduced (right panel) when compared to controls (mean ± SEM; n = 4 rats). Original bars, 50 μm. p < 0.001 determined by Kruskal-Wallis test. (B) When macrophages were cultured in the presence of TRAM-34 (10 μM), the number of nuclei per 100 macrophages was significantly reduced when compared to cells incubated with the media only (control, basal cells). The results are representative of five independent experiments. Original bars, 50 μm. p < 0.001 determined by Kruskal-Wallis test. (C) BMDMs from 6-week-old Kcnn4+/+ and Kcnn4−/− mice were cultured in the presence of macrophage colony stimulating factor (M-CSF) (25 ng/ml) and RANKL (20 ng/ml) for 4 days to induce the differentiation of osteoclasts (upper panel). The formation of osteoclasts measured as the number of TRAP+ multinucleated osteoclasts per well increased with time in Kcnn4+/+ cells but not in Kcnn4−/− cells. Mean ± SD; n = 5; the osteoclast number/well was significantly different (p < 0.001) at all time points; the results are representative of three independent experiments. Original bars, 100 μm. (D) Mouse BMDMs were cultured in the presence of M-CSF (25 ng/ml) and RANKL (40 ng/ml) and treated with TRAM-34 or ICA-17043 (both 10 μM, upper panel). TRAM-34 and ICA-17043 treatment on mouse osteoclasts reduced the number of osteoclasts per well in a dose-dependent manner (lower panel, mean ± SD; n = 5). Original bars, 100 μm. (E) Human-monocyte-derived macrophages were cultured in Lab-Tek chambers, and spontaneous MGC formation was observed in some buffy coats, and this was significantly reduced when cells were incubated with TRAM-34 (10 μM). At least three separate buffy coats were used to differentiate human macrophages. Original bars, 50 μm. p < 0.001 determined by Kruskal-Wallis test. (F) Human peripheral blood monocytes were cultured in the presence of M-CSF (20 ng/ml) and RANKL (10 ng/ml) for 5 days to induce the differentiation of osteoclasts. Cells were treated with TRAM-34 or ICA-17043 (both 10 μM, left panel). Quantification of osteoclast number per well shows that TRAM-34 and ICA-17043 inhibited the formation of monocyte-derived human osteoclasts in a dose-dependent manner (mean ± SD; n = 4). Original bars, 100 μm. See also Figure S3.
Figure 4
Figure 4
Kcnn4 Modulates Bone Homeostasis via Osteoclasts (A) Genetic deletion of Kcnn4 increases bone mass as shown by X-ray analysis performed on femurs from 8-week-old Kcnn4+/+ and Kcnn4−/− female and male mice. Note the stronger radio-opacity in femurs from Kcnn4−/− mice when compared with Kcnn4+/+ mice. (B) Peripheral quantitative computed tomography (pQCT) analysis of femoral bones showing total bone density and trabecular bone density of distal femurs from 8-week-old Kcnn4−/− mice compared with Kcnn4+/+ mice (mean ± SD; n = 7–9). (C) Representative images of microcomputed tomography (microCT) analysis of distal femurs (left panel) from 8-week-old female and male Kcnn4+/+ and Kcnn4−/− mice. Trabecular bone volume fraction from Kcnn4+/+ and Kcnn4−/− female and male mice is shown in the right panel (mean ± SD; n = 7–9). (D) Histomorphometry analysis of tibiae from 8-week-old Kcnn4+/+ and Kcnn4−/− female and male mice showing the number of osteoclasts per trabecular bone perimeter (mean ± SD; n = 10). (E) Microcomputed tomography analysis of calvaria from 8-week-old Kcnn4−/− and Kcnn4+/+ male and female mice that had received a 2 μl of injection of 25 μg LPS on the right calvaria. Mice were sacrificed 5 days later. Note the low abundance of resorption lacunae in Kcnn4−/− mice when compared with wild-type. Calvarial bone volume fraction, bone thickness and bone density were higher, whereas bone surface density was lower in Kcnn4−/− mice when compared with wild-type (right panel; mean ± SD; n = 5). See also Figure S4 and Table S1.
Figure 5
Figure 5
Reduced Severity of Glomerulonephritis and Arthritis by Kcnn4 Inactivation (A) Glomerular immunohistochemistry showing the effect of specific Kcnn4 blocker TRAM-34 in renal injury in the WKY nephrotoxic nephritis model. Following nephrotoxic serum injection, glomerular crescents (PAS) and percentage of ED1+ macrophages were assessed in control (vehicle) and TRAM-34-treated rats (n = 4 rats were used per group of treatment). Original bars, 20 μm. (B) Quantification of glomerular crescents, proteinuria, percentage of ED1+ cells and number of glomerular MGCs. (C) Collagen antibody-induced arthritis (CAIA) was induced in 2-month-old male and female Kcnn4−/− and Kcnn4+/+ mice (mean ± SD; n = 12–15). Arthritic severity was monitored daily using a visual scoring system as detailed in Supplemental Experimental Procedures. Based on inflammation scoring, Kcnn4 deletion reduced inflammation in males and females, though the prevention was more efficient in female mice. From day 8 onward, the CAIA mean score is significantly different between Kcnn4+/+ and Kcnn4−/− animals for both genders (p < 0.001). (D) Histopathomorphometry analysis of the paws and the ankles of Kcnn4+/+ and Kcnn4−/− naive and CAIA-induced female mice. All the histomorphometric parameters (inflammation, pannus, cartilage damage, and bone damage) were compared to CAIA Kcnn4+/+ mice and are significant (mean ± SEM; n = 10–12 mice in each group; p < 0.05). Similar results were obtained in male mice (data not shown). See also Figure S5.
Figure 6
Figure 6
Kcnn4 Regulates Ca2+-NFATc1 Signaling in Multinucleate Macrophages (A) Ca2+ oscillations were recorded by intracellular Ca2+ imaging using fura-2 in multinucleate osteoclasts from Kcnn4+/+ and Kcnn4−/− mice. Fluorescence images of cells is shown on the left panel, whereas traces of change in fura-2 fluorescence ratio in single cells treated with M-CSF only or M-CSF and RANKL for 72 hr are shown on the right panel. Note the decrease in Ca2+ oscillations associated with Kcnn4 deficiency, and the absence of Ca2+ oscillations in the presence of M-CSF alone, independent of Kcnn4. These experiments were repeated multiple times with similar results, and one representative result is shown. Original bars, 50 μm. (B) Representative current responses to increasing voltage steps (−100 mV to +80 mV; 400 ms) observed in mouse BMDMs from Kcnn4+/+ and Kcnn4−/− mice treated with M-CSF (25 ng/ml) and RANKL (40 ng/ml) for 5 days (left panel). I–V plot demonstrates the average current/voltage relationship observed (right panel). Data points for Kcnn4−/− and Kcnn4+/+ macrophages treated with the Kcnn4 inhibitor ICA-17043 (1 μM) were statistically different from Kcnn4+/+ in the range of −20 mV to +80 mV (mean ± SD, p < 0.05; n = 10), with the exception of Kcnn4+/+ + ICA-17043 at + 60 mV (mean ± SD, p = 0.06; n = 10) and +80 (mean ± SD, p = 0.11; n = 10). There was no significant difference between Kcnn4−/− macrophages and Kcnn4+/+ treated with ICA-17043. (C) NFATc1 protein levels in BMDMs from Kcnn4+/+ and Kcnn4−/− mice. BMDMs isolated from Kcnn4+/+ and Kcnn4−/− mice were cultured in the presence of M-CSF (25 ng/ml) and RANKL (40 ng/ml) and subjected to western blot analysis at the indicated times using antibodies directed against NFATc1. GAPDH served as an internal control for equal loading of proteins on a SDS-PAGE protein gel. Note the lower abundance of NFATc1 in Kcnn4−/− macrophages compared with Kcnn4+/+ cells. This figure is representative of several experiments performed with similar results. (D) BMDMs isolated from Kcnn4−/− and Kcnn4+/+ mice were treated with M-CSF (25 ng/ml) alone or supplemented with RANKL (40 ng/ml) for 5 days and subjected to immunocytochemistry using anti-NFATc1 antibody. Note the decrease in immunoreactive NFATc1 in the nuclei of Kcnn4−/− macrophages treated with RANKL compared with Kcnn4+/+ cells. Original bars, 100 μm. See also Figure S6.

References

    1. Aitman T.J., Dong R., Vyse T.J., Norsworthy P.J., Johnson M.D., Smith J., Mangion J., Roberton-Lowe C., Marshall A.J., Petretto E. Copy number polymorphism in Fcgr3 predisposes to glomerulonephritis in rats and humans. Nature. 2006;439:851–855. - PubMed
    1. Ballica R., Valentijn K., Khachatryan A., Guerder S., Kapadia S., Gundberg C., Gilligan J., Flavell R.A., Vignery A. Targeted expression of calcitonin gene-related peptide to osteoblasts increases bone density in mice. J. Bone Miner. Res. 1999;14:1067–1074. - PubMed
    1. Baron R., Tross R., Vignery A. Evidence of sequential remodeling in rat trabecular bone: morphology, dynamic histomorphometry, and changes during skeletal maturation. Anat. Rec. 1984;208:137–145. - PubMed
    1. Begenisich T., Nakamoto T., Ovitt C.E., Nehrke K., Brugnara C., Alper S.L., Melvin J.E. Physiological roles of the intermediate conductance, Ca2+-activated potassium channel Kcnn4. J. Biol. Chem. 2004;279:47681–47687. - PubMed
    1. Behmoaras J., Bhangal G., Smith J., McDonald K., Mutch B., Lai P.C., Domin J., Game L., Salama A., Foxwell B.M. Jund is a determinant of macrophage activation and is associated with glomerulonephritis susceptibility. Nat. Genet. 2008;40:553–559. - PMC - PubMed

Publication types

MeSH terms

Substances