. 2014 Aug 28;158(5):989-999.
doi: 10.1016/j.cell.2014.07.043. Epub 2014 Aug 14.

Broadly neutralizing antibodies and viral inducers decrease rebound from HIV-1 latent reservoirs in humanized mice

Affiliations

Broadly neutralizing antibodies and viral inducers decrease rebound from HIV-1 latent reservoirs in humanized mice

Ariel Halper-Stromberg et al. Cell. .

Abstract

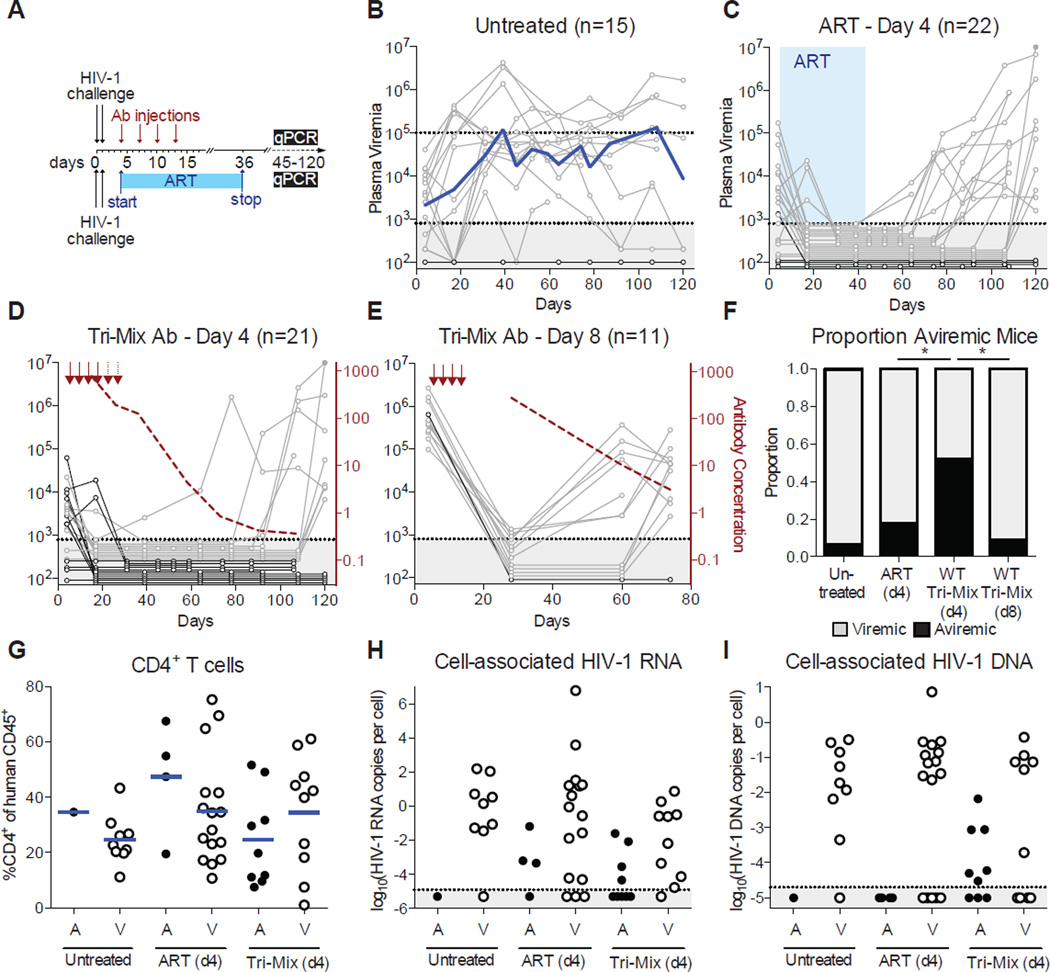
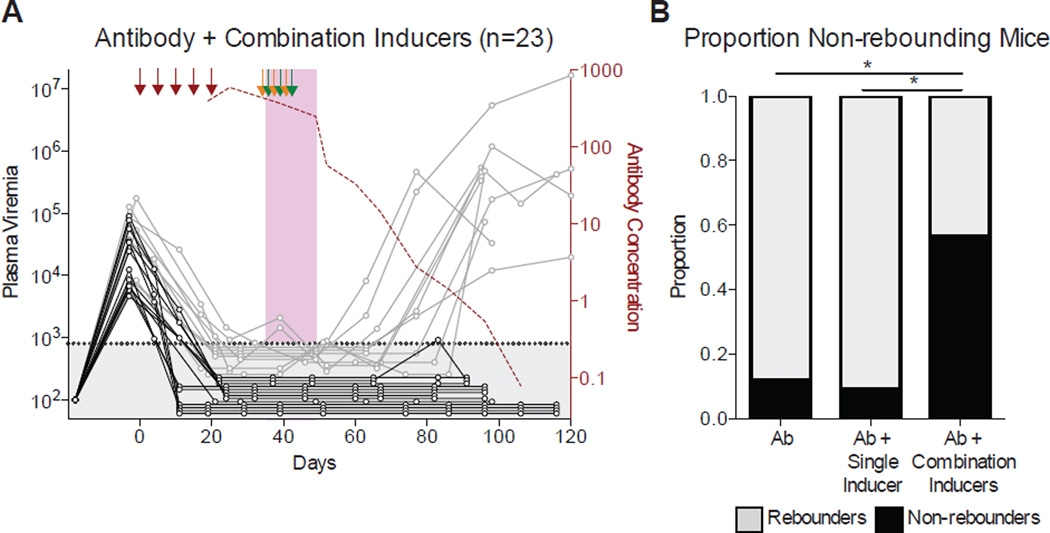
Latent reservoirs of HIV-1-infected cells are refractory to antiretroviral therapies (ART) and remain the major barrier to curing HIV-1. Because latently infected cells are long-lived, immunologically invisible, and may undergo homeostatic proliferation, a "shock and kill" approach has been proposed to eradicate this reservoir by combining ART with inducers of viral transcription. However, all attempts to alter the HIV-1 reservoir in vivo have failed to date. Using humanized mice, we show that broadly neutralizing antibodies (bNAbs) can interfere with establishment of a silent reservoir by Fc-FcR-mediated mechanisms. In established infection, bNAbs or bNAbs plus single inducers are ineffective in preventing viral rebound. However, bNAbs plus a combination of inducers that act by independent mechanisms synergize to decrease the reservoir as measured by viral rebound. Thus, combinations of inducers and bNAbs constitute a therapeutic strategy that impacts the establishment and maintenance of the HIV-1 reservoir in humanized mice.


Figures

Figure 1
Figure 1. Post-exposure prophylaxis with bNAbs
(A) Schematic timeline for the bNAb (top) and ART (bottom) experiments. (B) Plasma viremia for untreated mice. The x-axis is in days post HIV-1 challenge. The y-axis is viral RNA copies/ml. Gray shading indicates values beneath the detection limit of 800 copies/ml. The blue line indicates the geometric mean plasma viremia. (C) Plasma viremia for ART-treated mice. Graph as in (B). The blue shading indicates the treatment period with ART. (D) Plasma viremia for antibody-treated mice. The red arrows indicate antibody tri-mix injections. The dashed red line shows average plasma antibody concentration (µg/ml) for all mice in the group. (E) Graph as in (D), for mice treated with antibody starting 8 days after HIV-1 challenge. (F) The proportion of mice that were viremic at the terminal point for each treatment group (*, p < 0.05; Fisher’s Exact test) (G) Percentage of CD4+ T cells in the spleen at the terminal point measured by flow cytometry, organized by treatment group. (A = aviremic, V = viremic) (H) Cell-associated HIV-1 RNA measured in spleen T cells at the terminal point, plotted as the ratio of HIV-1 RNA to CCR5 copies for each mouse. Gray shading indicates the detection limit of 1.25×10⁻⁵ copies per cell. (I) Cell-associated HIV-1 DNA measured in spleen T cells at the terminal point, plotted as the ratio of HIV-1 RNA to CCR5 copies for each mouse. Gray shading indicates the detection limit of 2.0×10⁻⁵ copies per cell. Mice that died prematurely are not included in Figure 1G–I. See also Figures S1, S2 and Data S1.
Fig. 2
Fig. 2. FcRnull antibodies suppress viremia but do not prevent rebound
(A) Plasma viremia as in Fig. 1D for mice treated with FcRnull tri-mix. (B) For all viremic mice, plasma antibody concentration (µg/ml) on the day of viral rebound. Antibody levels were significantly higher in FcRnull tri-mix treated mice compared to wild-type tri-mix treated mice (*, p < 0.05; ***, p < 0.001; Mann-Whitney test). (C) Sequences of gp120 cloned from plasma. Horizontal lines denote individual clones, grouped by mouse, shown on the right. Red ticks and green ticks indicate non-synonymous and synonymous substitutions relative to gp120YU2, respectively. Blue shading highlights sites of mutations that confer escape to the antibody tri-mix. See also Data S2.
Figure 3
Figure 3. Rebound viremia after therapy with single inducers
(A) Schematic timeline of the experiment. (B–D) Graphs show plasma viremia for individual mice on the left y-axis, geometric mean antibody level (µg/ml) on the right y-axis among all mice in the group (red). The x-axis represents days relative to the first antibody injection. Antibody injections are indicated with red arrows. Mice that had rebound plasma viremia are shown in gray. Mice that failed to rebound are shown in black. (B) Mice that received tri-mix antibodies, but no inducers. (C) Mice that received tri-mix antibodies and vorinostat (green arrows). (D) Mice that received tri-mix antibodies and I-BET151 (purple shading). (E) Mice that received tri-mix antibodies and α (orange arrows). See also Data S3, Figures S3 and S5.
Figure 4
Figure 4. Combination inducers decrease the incidence of rebound viremia
(A) Mice treated with tri-mix of antibodies, and a combination of three inducers. Graph, arrows, and shading are as in Figure 3. (B) Graph shows the proportion of mice that showed rebound viremia for each treatment group, where all mice that received antibody tri-mix and any one of the three single inducers (shown in Figure 3C–E) are pooled together (*, p < 0.05; Fisher’s Exact test). See also Data S4, Figures S3, S4 and S5.
Figure 5
Figure 5. Antibody persistence and premature termination do not account for non-rebounding
(A) Percentage of CD4+ T cells at the terminal point measured in the spleen by flow cytometry. (B) Cell-associated HIV-1 RNA measured in spleen cells at terminal point, plotted as the ratio of HIV-1 RNA to CCR5 DNA copies for each mouse. Mice that had measureable HIV-1 RNA, but undetectable CCR5 DNA are plotted as 104 copies per cell. (C) Plasma viremia before therapy was initiated for each mouse, organized by treatment group and rebound status (N.R. = non-rebounder, Reb. = viral rebounder). There was no significant difference for any individual group (Kruskal-Wallis test). (D) The plasma antibody level (µg/ml) at the time of viral rebound for each mouse that rebounded, organized by treatment group. The mean plasma antibody level at the time of rebound was 2.97 µg/ml for all groups. (E) For each mouse that rebounded, the number of days that elapsed from when the antibody level dropped below 2.97 µg/ml to the time of rebound. (F) For mice that did not rebound, the number of days that elapsed from when each mouse’s antibody levels dropped below 2.97 µg/ml to the terminal point. (F) Cell-associated HIV-1 DNA measured in spleen T cells at the terminal point, plotted as the ratio of HIV-1 DNA to CCR5 copies for each mouse. Mice that had measureable HIV-1 DNA, but undetectable CCR5 DNA are plotted as 104 copies per cell. Mice that died prematurely are not included in Figure 5A–B.

Comment in

  • Neutralizing the HIV reservoir.
    Marsden MD, Zack JA. Marsden MD, et al. Cell. 2014 Aug 28;158(5):971-972. doi: 10.1016/j.cell.2014.08.010. Cell. 2014. PMID: 25171398 Free PMC article.

References

    1. Abela IA, Berlinger L, Schanz M, Reynell L, Gunthard HF, Rusert P, Trkola A. Cell-cell transmission enables HIV-1 to evade inhibition by potent CD4bs directed antibodies. PLoS pathogens. 2012;8:e1002634. - PMC - PubMed
    1. Agosto LM, Zhong P, Munro J, Mothes W. Highly active antiretroviral therapies are effective against HIV-1 cell-to-cell transmission. PLoS pathogens. 2014;10:e1003982. - PMC - PubMed
    1. Aida Y, Pabst MJ. Removal of endotoxin from protein solutions by phase separation using Triton X-114. Journal of immunological methods. 1990;132:191–195. - PubMed
    1. Alegre ML, Frauwirth KA, Thompson CB. T-cell regulation by CD28 and CTLA-4. In Nat Rev Immunol. 2001:220–228. - PubMed
    1. Archin NM, Bateson R, Tripathy M, Crooks AM, Yang KH, Dahl NP, Kearney MF, Anderson EM, Coffin JM, Strain MC, et al. HIV-1 Expression within Resting CD4 T-Cells Following Multiple Doses of Vorinostat. In J Infect Dis. 2014:1–26. - PMC - PubMed

Publication types

MeSH terms