. 2014 Sep 2;22(9):1311-1321.
doi: 10.1016/j.str.2014.06.016. Epub 2014 Aug 14.

HIV-1 envelope protein gp41: an NMR study of dodecyl phosphocholine embedded gp41 reveals a dynamic prefusion intermediate conformation

Affiliations

HIV-1 envelope protein gp41: an NMR study of dodecyl phosphocholine embedded gp41 reveals a dynamic prefusion intermediate conformation

Nils-Alexander Lakomek et al. Structure. .

Abstract

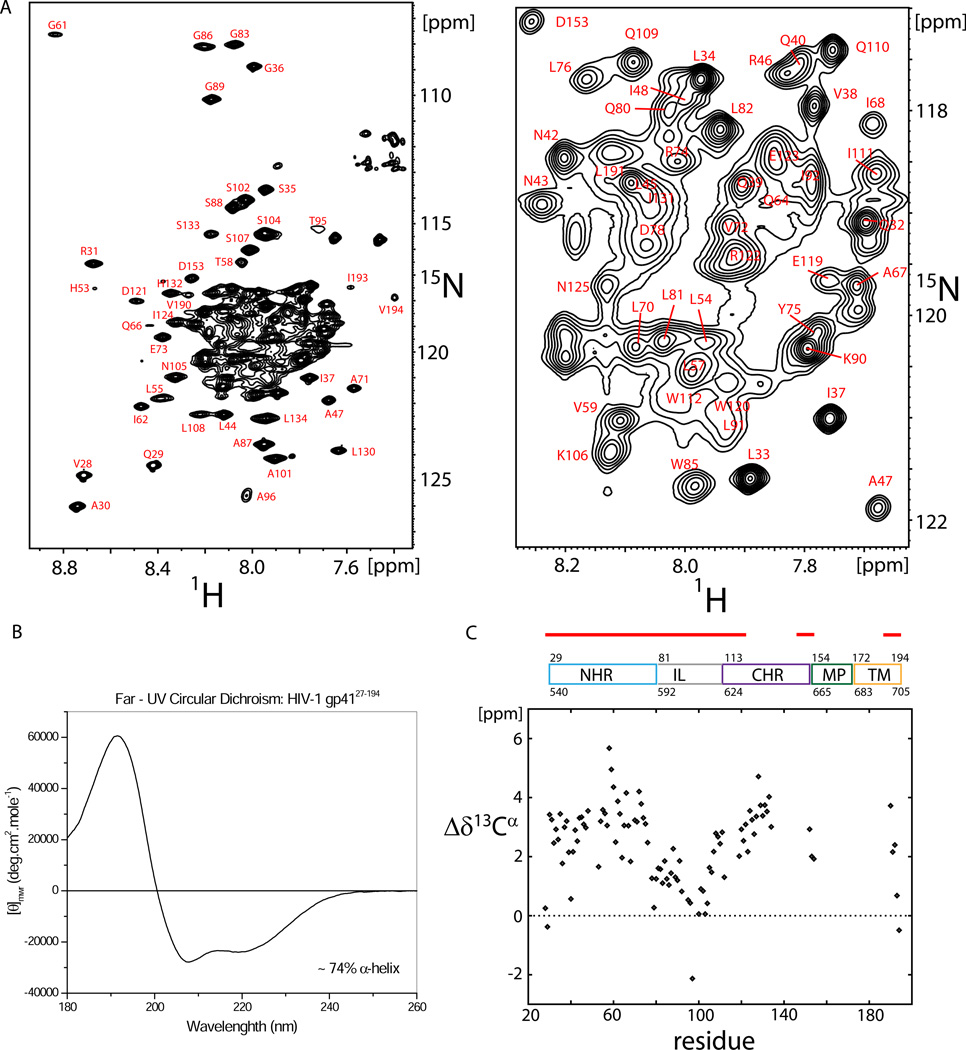
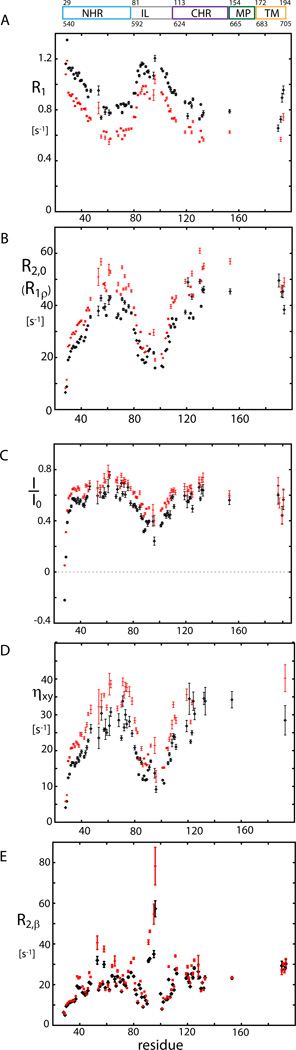
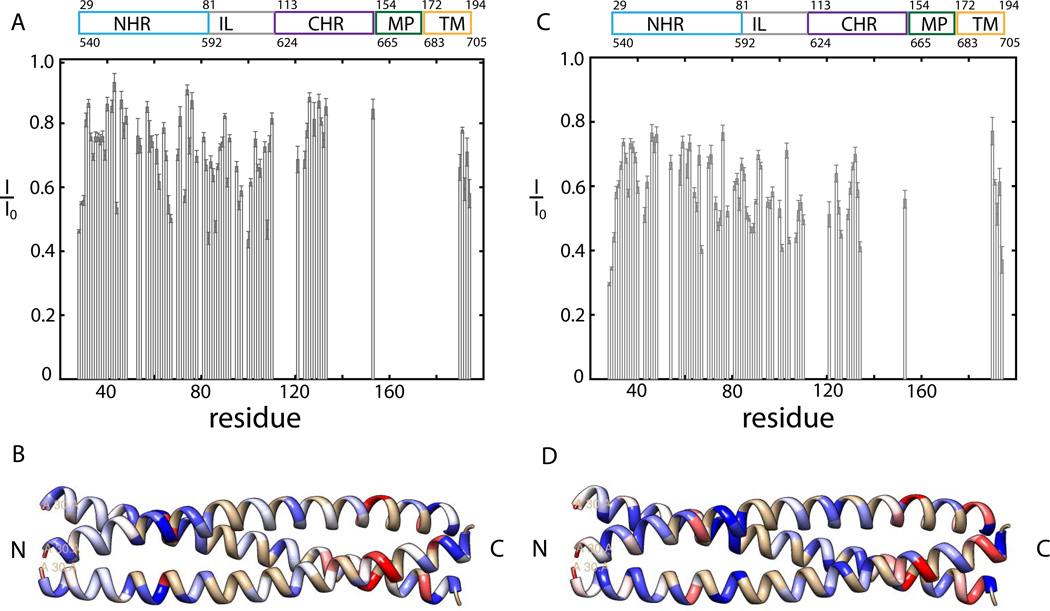
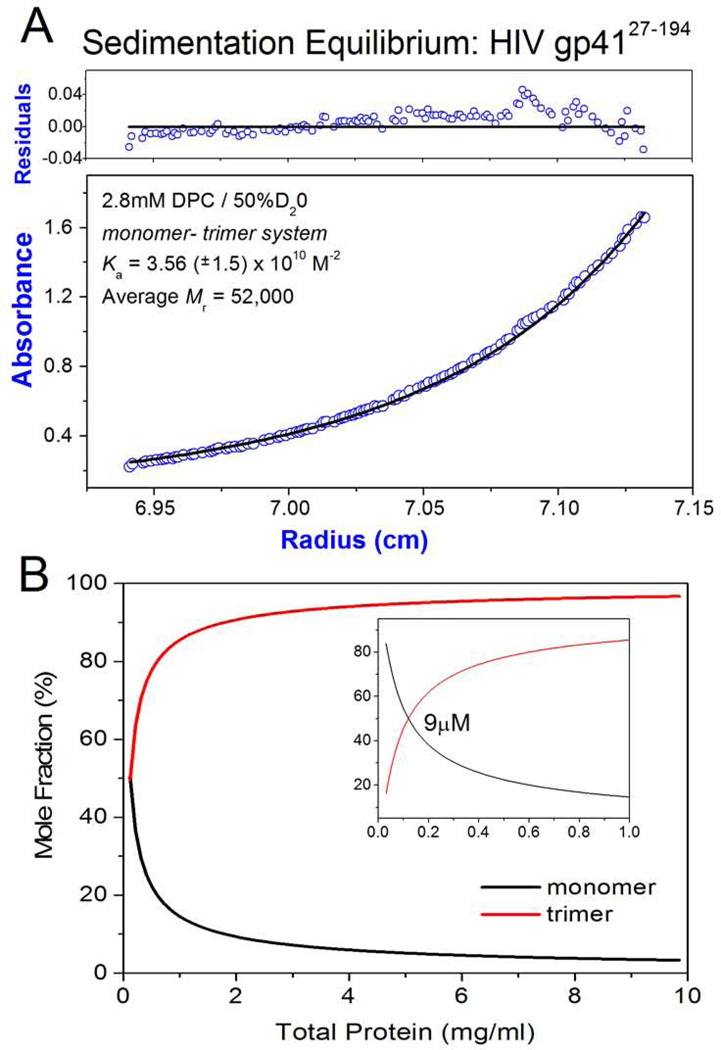
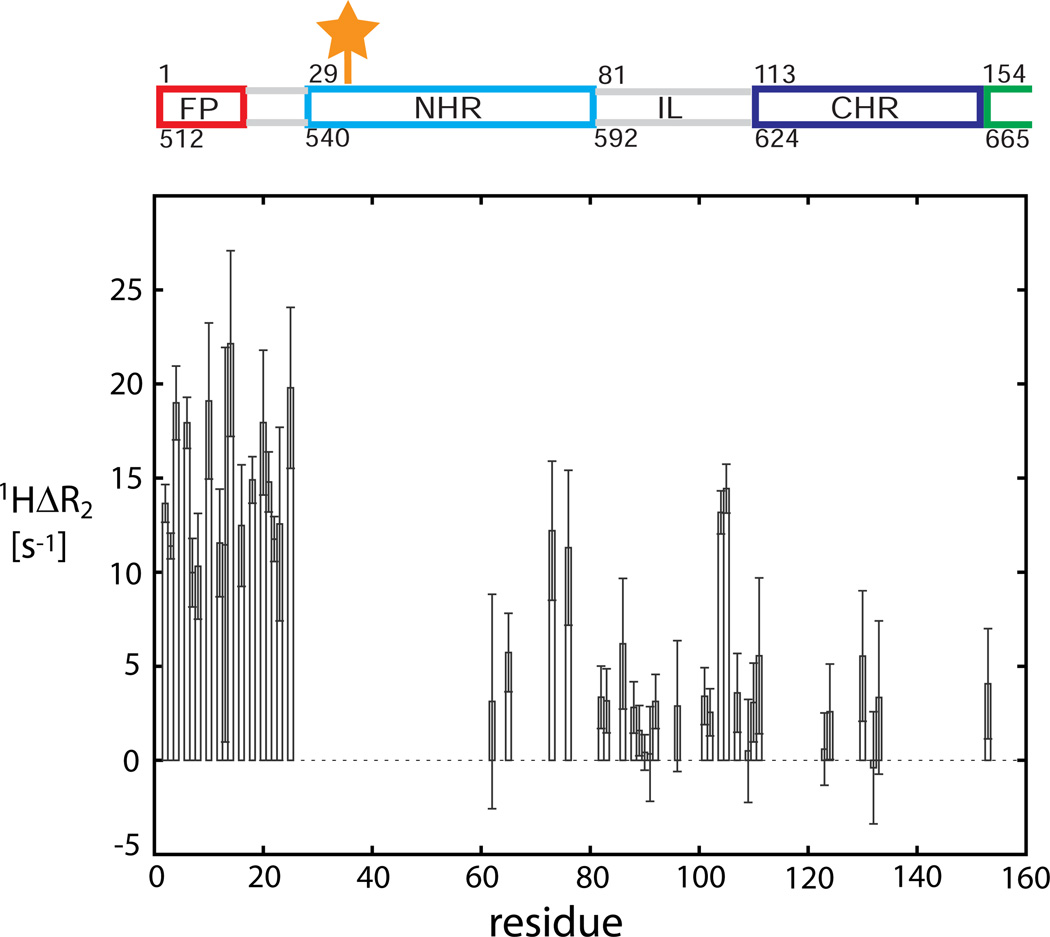
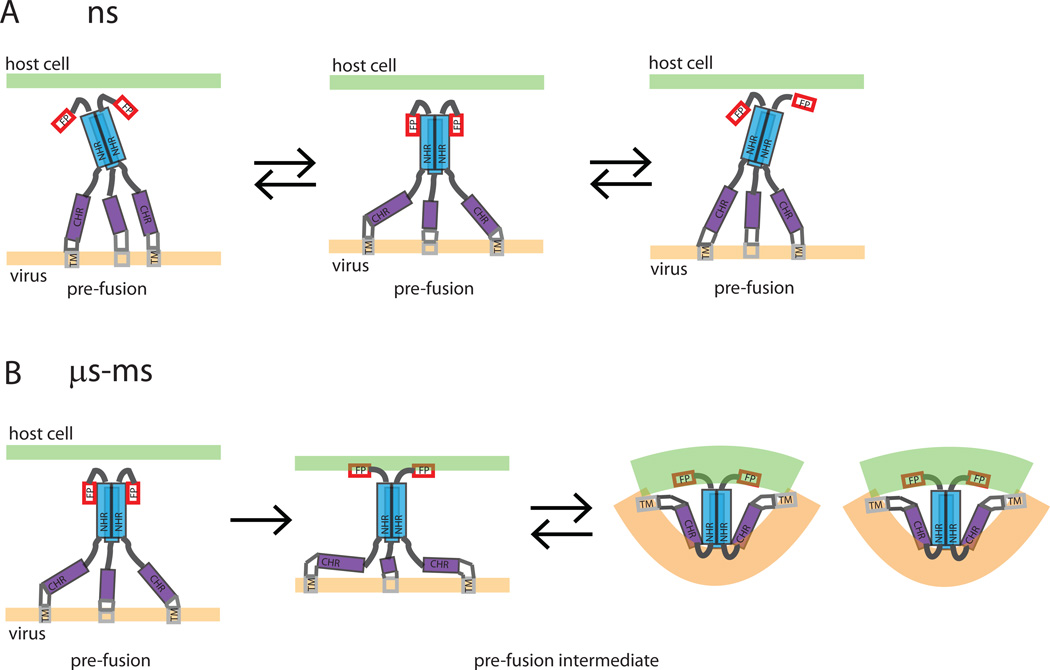
Human immunodeficiency viral (HIV-1) fusion is mediated by the viral envelope gp120/gp41 complex (ENVelope glycoprotein). After gp120 shedding, gp41 is exposed and elicits membrane fusion via a cascade of conformational changes. In contrast to prefusion and postfusion conformation, little is known about any intermediate conformation. We report on a solution NMR investigation of homotrimeric HIV-1 gp41(27-194), comprising the transmembrane region and reconstituted in dodecyl phosphocholine (DPC) micelles. The protein is mainly α-helical, but experiences internal dynamics on the nanosecond and micro to millisecond time scale and transient α-helical behavior for certain residues in the N-terminal heptad repeat (NHR). Strong lipid interactions are observed, in particular for C-terminal residues of the NHR and imunodominant loop region connecting NHR and C-terminal heptad repeat (CHR). Our data indicate an extended conformation with features anticipated for a prefusion intermediate, presumably in exchange with a lowly populated postfusion six-helical bundle conformation.


Figures

Figure 1
Figure 1. Secondary structure propensity of gp4127–194
a) 800 MHz 15N-1H TROSY-HSQC spectrum of 1.0 mM 2H15N13C gp4127–194 in DPC micelles, 50mM sodium acetate, pH 4.0, 25 mM KCl, recorded at 40 °C (left) and where the most crowded region has been magnified for clarity (right). b) Far-UV spectrum of gp4127–194. The mean residue ellipticity θmwr [degrees cm2mol–1] is plotted versus the wave length [nm]. c) 13Cα secondary chemical shifts of gp4127–194 in DPC micelles.
Figure 2
Figure 2. 15N relaxation data of gp4127–194 in DPC micelles
a) 15N R1 relaxation data recorded at 600 MHz (black) and 800 MHz (red) are highly consistent for both fields. b) R2,0 relaxation data (derived from R with a 2 kHz RF field; R1 contribution corrected) at 600 MHz (black) and 800 MHz (red). c) 15N- {1H} NOE values. d) Transverse CSA–dipolar cross-correlated relaxation rates ηxy. e) Hahn echo transverse relaxation rates, R2,β, at 600 MHz (black) and 800 MHz (red) for the slowly relaxing component of the 15N-{1H} doublets. Unlike in the R experiment, all conformational-exchange effects, Rex, contribute to R2,β and are not refocused.
Figure 3
Figure 3. Normalized intensities (I/I0) for the lipid PRE and solvent PRE sample
Intensities are normalized by comparison to the intensity of the reference sample I0, the smaller the ratio, the stronger the PRE effect is. I/I0 of 0.1 mM gp4127–194, 50 mM Na Ac pH4, 25mM KCl, 35 mM DPC plus a) 0.5 mM 5-DSA (final concentration) and c) 5 mM Gadodiamide (Omniscan) (final concentration). Normalized intensities are visualized for the NHR domain of 1ENV. Residues are color coded according to their lipid interactions and solvent exposure: b) blue for little lipid interactions (I/I0> 0.93) to white for medium lipid interactions (I/I0=0.71) to red for strong lipid interactions (I/I0< 0.5) and d) blue for little solvent exposure (I/I0> 0.77) to white for medium solvent exposure (I/I0=0.61) to red for strong solvent exposure (I/I0< 0.44).
Figure 4
Figure 4. Analytical Ultracentrifugation
a) Sedimentation equilibrium ultracentrifugation of HIV-1 gp4127–194: Panels are absorbance (bottom panel) and residuals (upper panel). Opened circles show 280nm absorbance gradients in the centrifuge cell. The solid line indicates the calculated fit for the monomer-trimer association. Residuals show the difference in the fitted and experimental values as a function of radial position. The data shown refers to a 15N13C2H labelled protein with a calculated monomeric mass of 22,000 (sample used directly for NMR analyses). The concentration range of the gradient (open circles) at equilibrium is ~ 1.0 µM – 20 µM. b) The monomer – trimer potential of gp4127–194 is indicated as mole fraction of monomer and trimer plotted as function of total protein concentration. Profiles were constructed using the Ka value indicated in (A). The insert is at a tenfold lower protein concentration and the indicated protein molarity corresponds to ~ 50% monomer and 50% trimer composition. The molecular weight of the non-labelled gp4127–194 construct is 19.65 kDa (1mg/ml = 50.9µM) and the NMR measurements described in the study were performed at ~ 20mg/ml (1mM).
Figure 5
Figure 5. PRE measurements for the paramagnetic nitroxide spin-labeled S35C mutant of gp411–194
The difference of 1H R2 rates is taken with respect to the reference sample, reduced by ascorbic acid. An increased difference rate 1H ΔR2 indicates (transient) proximity. The position of the paramagnetic spinlabel is indicated by the orange star.
Figure 6
Figure 6. A schematic model of the initial stages of gp41 mediated membrane fusion
A schematic model of the initial stages of gp41 mediated membrane fusion compatible with our data. a) The gp41 domains exhibit stochastic dynamics of smaller (NHR and CHR) and higher amplitude on a 2–5 ns timescale. b) Larger conformational changes that require transition of a higher energy barrier occur on a µs-ms time scale. (The TM and MPER region adjacent to the CHR region are drawn for completeness, although our data do not provide any direct information on the arrangement of those two domains. Also, the transient α-helical notches in the NHR region are not included in the scheme).

Comment in

References

    1. Bartesaghi A, Merk A, Borgnia MJ, Milne JL, Subramaniam S. Prefusion structure of trimeric HIV-1 envelope glycoprotein determined by cryo-electron microscopy. Nature structural & molecular biology. 2013;20:1352–1357. - PMC - PubMed
    1. Blumenthal R, Durell S, Viard M. HIV Entry and Envelope Glycoprotein-mediated Fusion. Journal of Biological Chemistry. 2012;287:40841–40849. - PMC - PubMed
    1. Buzon V, Natrajan G, Schibli D, Campelo F, Kozlov MM, Weissenhorn W. Crystal structure of HIV-1 gp41 including both fusion peptide and membrane proximal external regions. PLoS pathogens. 2010;6:e1000880. - PMC - PubMed
    1. Caffrey M. HIV envelope: challenges and opportunities for development of entry inhibitors. Trends in microbiology. 2011;19:191–197. - PMC - PubMed
    1. Chan DC, Fass D, Berger JM, Kim PS. Core structure of gp41 from the HIV envelope glycoprotein. Cell. 1997;89:263–273. - PubMed

Publication types

MeSH terms

LinkOut - more resources